



Table of contents
No published benchmark study prices a "home renovation retail" landing page as its own category, so this report builds the answer from the two data sets that overlap it: Unbounce's conversion-rate benchmarks and LocaliQ's 2025 home-services search-ad data, checked against the digital sales growth Home Depot and Lowe's report to their own investors. Where the data does not exist at the exact intersection, that gap is stated plainly rather than filled with a guess.
Key Takeaways
- Doors & Windows Sales search ads convert at 4.41%, the second-lowest CVR among tracked home-services trades (LocaliQ 2025).
- The overall home-services average CVR is 7.33%, against 7.52% for all industries on Google and Microsoft Ads.
- Cost per lead for Doors & Windows Sales runs USD 200.34, second only to Roofing & Gutters at USD 228.15.
- Unbounce's home-improvement landing pages convert in a 3.8% to 12.3% band, with the all-industry median at 6.6%.
- A repair-and-maintenance sub-industry converts roughly 3x better than home and renovation services on the same Unbounce data set.
- Home Depot's digital-platform sales grew approximately 11% in Q4 fiscal 2025 alone.
- Lowe's online sales grew 8.8% in fiscal 2025 and now represent 13% of total retail sales.
- Lowe's Q4 fiscal 2025 comparable sales rose 1.3%, credited partly to Pro, online and home-services growth.
- The average cost per click across all industries is USD 5.26, against USD 8.76 for Doors & Windows Sales specifically.
- Construction & Contractors pages post the lowest home-services CVR at 2.61%.
- The FTC's reviews and testimonials rule has been enforceable since October 21, 2024, directly touching CRO trust elements.
| Metric | Home renovation retail proxy | All-industry benchmark | Source |
|---|---|---|---|
| Landing page conversion rate | 3.8%–12.3% (home improvement band) | 6.6% median | Unbounce Conversion Benchmark Report |
| Search-ad conversion rate | 4.41% (Doors & Windows Sales) | 7.52% | WordStream by LocaliQ 2025 |
| Cost per lead | USD 200.34 (Doors & Windows Sales) | USD 70.11 | WordStream by LocaliQ 2025 |
| Cost per click | USD 8.76 (Doors & Windows Sales) | USD 5.26 | WordStream by LocaliQ 2025 |
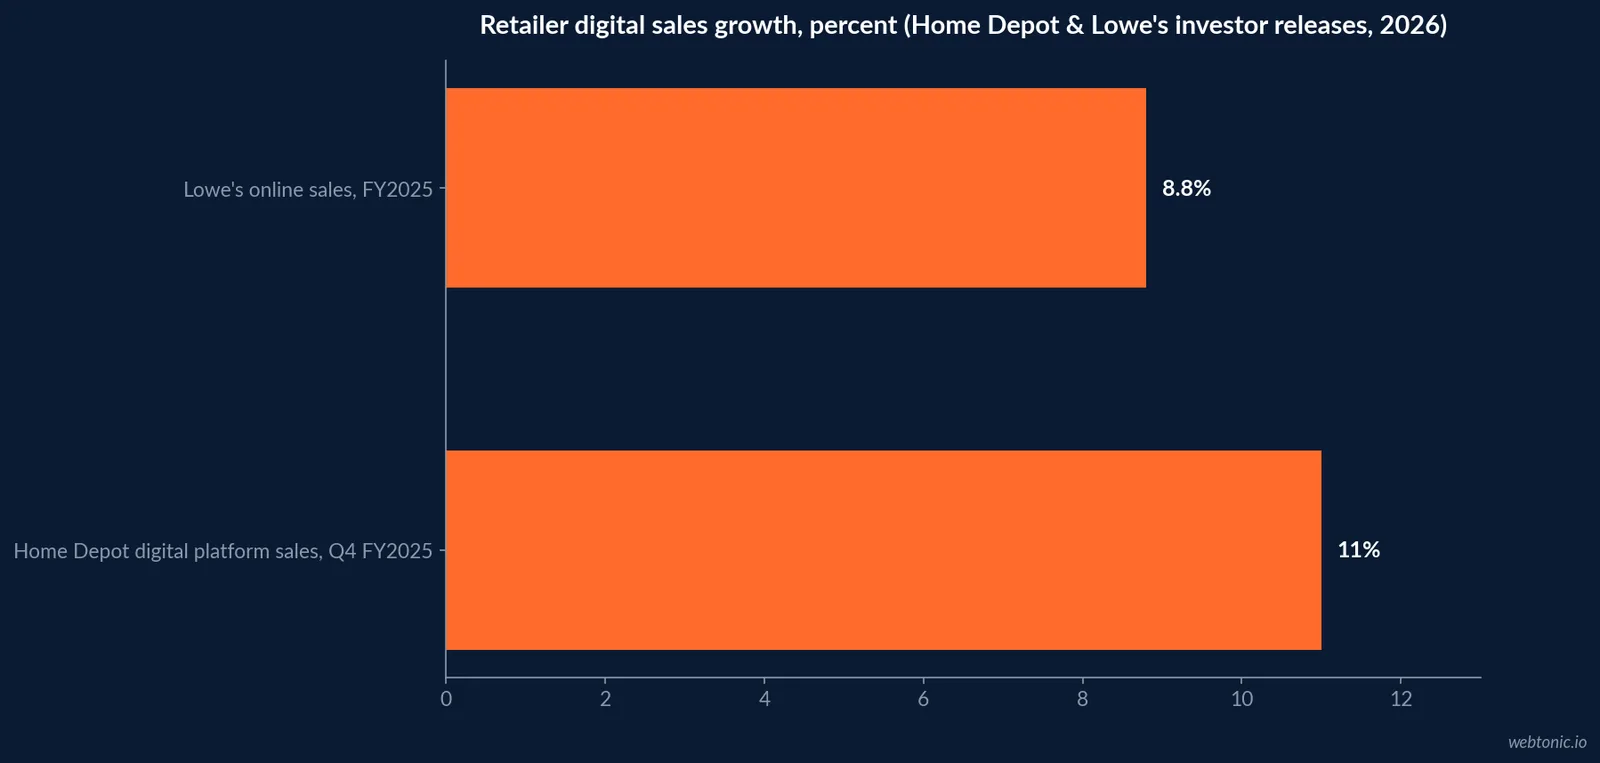
| Retailer digital sales growth | +11% (Home Depot, Q4 FY25) / +8.8% (Lowe's, FY25) | n/a | Home Depot and Lowe's investor releases |
Why there is no single "home renovation retail landing page" benchmark
The category sits between two data sets that measure different things. Unbounce's Conversion Benchmark Report, built from more than 41,000 landing pages and 57 million-plus tracked conversions, groups renovation-adjacent activity under a broader home-improvement and professional-services banner. Its professional services breakdown notes that a repair-and-maintenance sub-industry converts roughly three times better than home and renovation services on the same survey, which tells a retailer that the words "renovation" and "repair" on a page brief are not interchangeable for CRO purposes even though a shopper might use them interchangeably in a search bar.
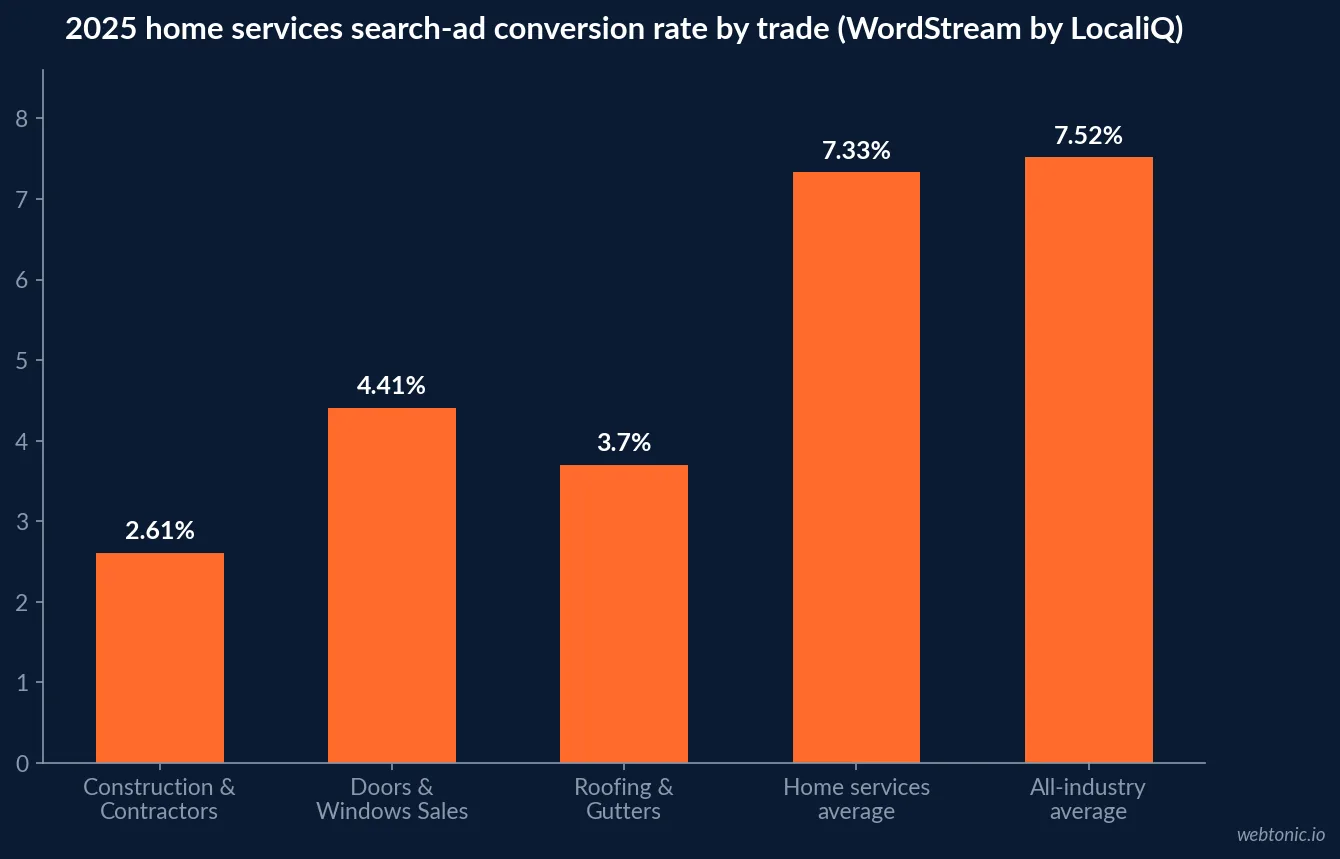
WordStream by LocaliQ's 2025 Home Services Benchmarks report, covering 3,211 US search campaigns running April 2024 to March 2025, measures the adjacent metric: how often a search click on a home-services ad turns into a lead, which is the landing page's job. Doors & Windows Sales posts a 4.41% conversion rate on that data set, one of the lower figures the report tracks, just ahead of Construction & Contractors at 2.61%.
What a five-figure purchase does to a conversion rate
A window or door replacement is not an impulse buy. Home Service Direct-cited residential project values for that category run roughly USD 8,000 to 15,000, which is high enough that most homeowners request two or three quotes before committing on any single site. That shopping pattern is priced directly into the USD 200.34 cost per lead and USD 8.76 cost per click WordStream by LocaliQ reports for Doors & Windows Sales — the second-highest cost-per-lead figure on the whole home-services table after Roofing & Gutters at USD 228.15. A landing page competing in that category has to earn a form-fill against a shopper who already expects to compare bids, which is a different design brief than a same-day handyman or cleaning-service page converting at 13% to 17%.
| Home services trade | Avg. CVR | Avg. CPL (USD) | Avg. CPC (USD) |
|---|---|---|---|
| Cleaning / Maid Services | 17.65% | 46.99 | — |
| Window Cleaning | 13.58% | 66.69 | — |
| Handyman Services | 13.45% | 54.05 | — |
| Doors & Windows Sales | 4.41% | 200.34 | 8.76 |
| Construction & Contractors | 2.61% | 165.67 | — |
| Roofing & Gutters | 3.70% | 228.15 | 10.70 |
| Overall home services | 7.33% | — | — |
The category's own historical conversion baseline
Unbounce has tracked a Home Improvement vertical since at least 2017, and while the exact percentile cut-offs have shifted since, the shape of the curve has not: a wide gap between a median page and a top-quartile one. Its 2017 Conversion Benchmark Report put Home Improvement pages at a 25th percentile of 1.4%, a median of 3.3%, a 75th percentile of 6.9% and a 90th percentile of 11.7%. The 2025 all-industry range of 3.8% to 12.3% sits close to that same historical top half, which suggests the ceiling for a well-built home-improvement page has not moved much in eight years even as the median has likely drifted with mobile traffic share and ad-cost inflation.
| Percentile (Unbounce, historical Home Improvement baseline) | Conversion rate |
|---|---|
| 25th percentile | 1.4% |
| 50th percentile (median) | 3.3% |
| 75th percentile | 6.9% |
| 90th percentile | 11.7% |
| 2025 all-industry range for comparison | 3.8%–12.3% |
The mobile conversion gap this category can't ignore
Search behavior for a home-improvement purchase is overwhelmingly mobile-first — a homeowner comparing window installers is doing it from a phone in the garage, not a desktop at the office. Unbounce's own research, covered by Search Engine Journal, found roughly an 8-percentage-point gap between desktop and mobile landing page conversion rates across its full 41,000-page data set. That gap is not home-improvement-specific, but it is a bigger risk for this category than for a lower-cost purchase: losing conversion on the device most home-improvement traffic actually arrives on, against a page already converting near 4%, compounds the USD 200.34 cost-per-lead problem rather than offsetting it.
| Retail category benchmark | Jan 2025 | Apr 2025 | Jul 2025 | Oct 2025 | Dec 2025 |
|---|---|---|---|---|---|
| NAICS 444 monthly retail sales, USD millions (not seasonally adjusted) | 39,280 | 40,711 | 39,924 | 39,749 | 40,762 |
US Census Bureau data for Building Material and Garden Equipment and Supplies Dealers shows the category holding in a narrow USD 39,280 to 40,762 million monthly band across 2025 — essentially flat traffic and revenue at the category level. When the top-line retail number is not growing, a landing page's conversion rate becomes the only lever a marketing team fully controls, which is the case for treating even a one-point CVR gain as a priority rather than a nice-to-have.
What Home Depot and Lowe's investor numbers imply about landing page ROI
Neither big-box retailer reports a landing-page-specific figure, but both quantify the digital channel a landing page sits inside. Home Depot told analysts on its fourth-quarter fiscal 2025 earnings call that "sales leveraging our digital platforms increased approximately 11 percent" compared with the same quarter a year earlier, against total fiscal 2025 sales of USD 164.7 billion reported in its Q4 and full-year release. Lowe's 2025 annual report states online sales grew 8.8% and now make up 13% of retail sales, and its Q4 2025 press release credits part of a 1.3% comparable-sales increase to "continued growth in Pro, online, and home services sales."
That is enough scale that a landing page redesign moving conversion from 4.4% to 5.4% on a Doors & Windows Sales campaign, or from the low to the high end of Unbounce's 3.8% to 12.3% home-improvement band, is worth pursuing on its own even before a retailer's much larger e-commerce base is considered.
Retail category headwinds a landing page cannot fix
Census Bureau data for Building Material and Garden Equipment and Supplies Dealers (NAICS 444) shows monthly sales for the category running in the USD 39 billion to 40.7 billion range through 2025, and the Harvard Joint Center for Housing Studies Leading Indicator of Remodeling Activity projects renovation and repair spending growth slowing to just 0.5% year over year by the second quarter of 2027. HIRI's own Q3 2025 market forecast revised full-year 2025 growth down to 2.5% from an earlier 3.4% estimate. A page cannot out-convert a soft macro category, but it can decide whether a shrinking pool of clicks turns into leads or bounces.
| Signal | 2025 figure | What it means for a landing page brief |
|---|---|---|
| NAICS 444 monthly retail sales | USD 39.3B–40.7B/month | Traffic volume is roughly flat; CRO, not more spend, is the lever |
| HIRI market growth forecast | 2.5% (revised down from 3.4%) | Budget the page for efficiency, not volume growth |
| Harvard JCHS LIRA outlook | 0.5% growth by Q2 2027 | Expect softer intent-to-purchase through the plan period |
| Home improvement market size | USD 526.5B (2025), USD 540.1B (2026 est.) | The addressable pool a 1-point CVR gain is drawn from |
Five CRO fixes the data actually supports
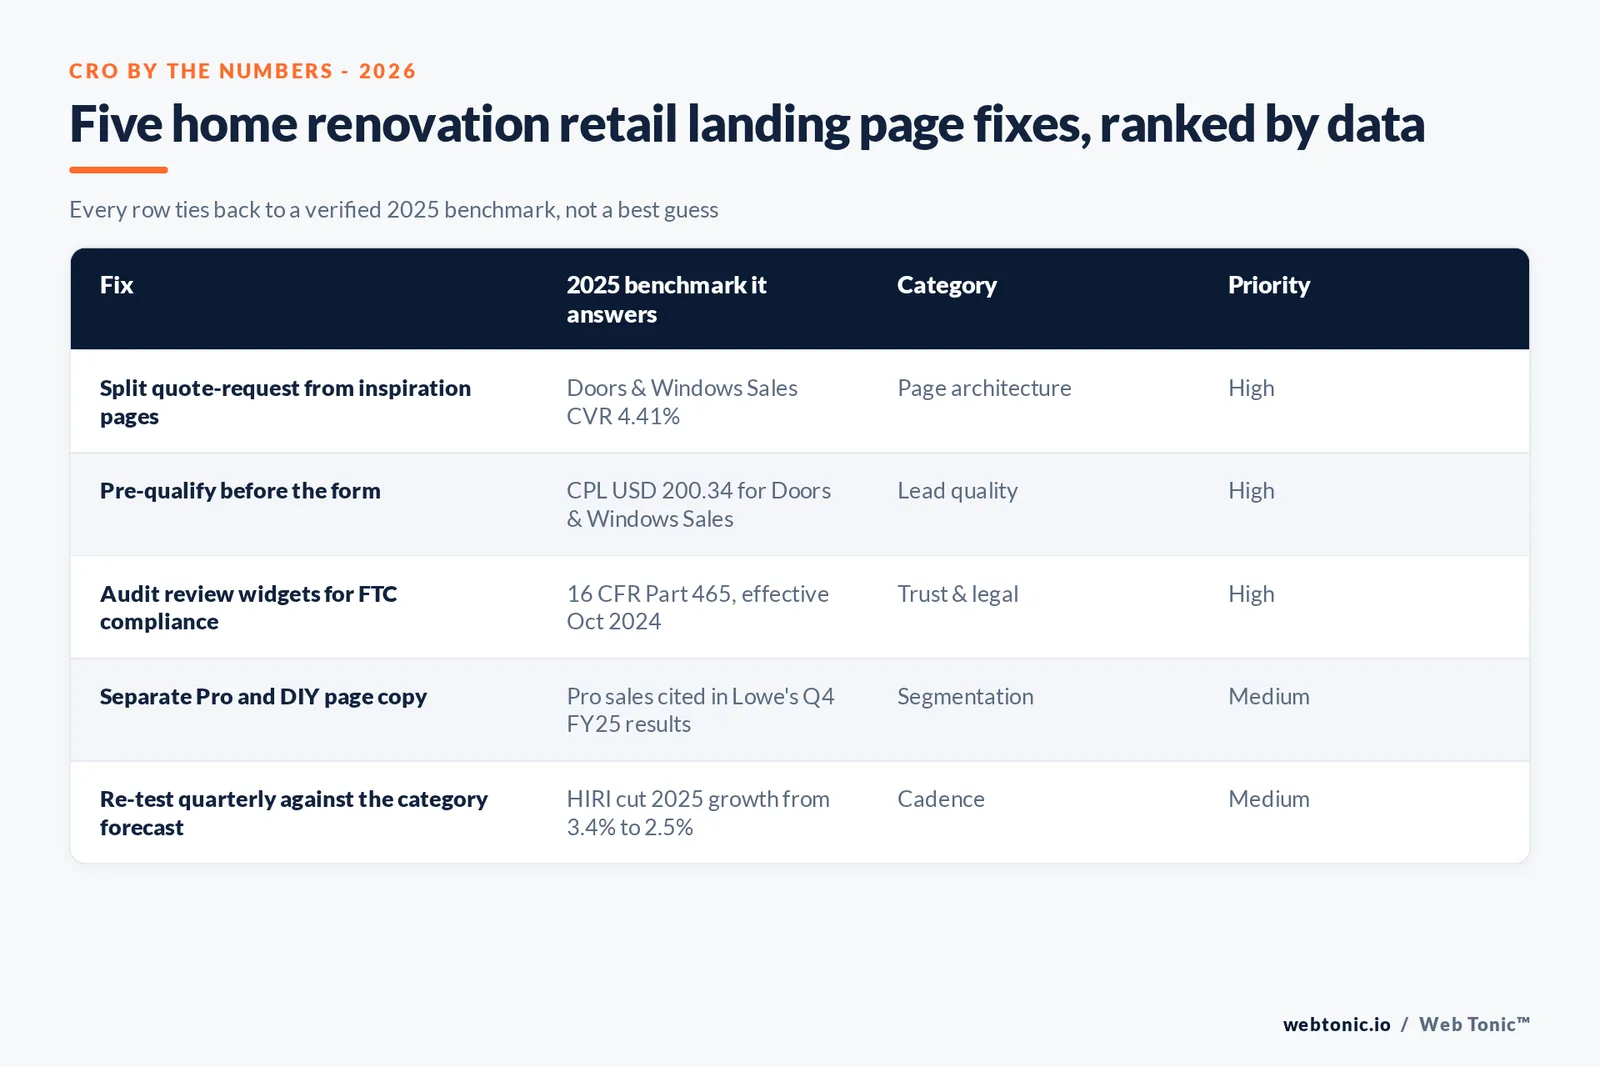
- Split the quote-request page from the inspiration page. A considered-purchase category (4.41% CVR) needs a different form length and proof set than a same-day service page converting above 13%.
- Price-anchor before the form, not after. With cost per lead already at USD 200.34, a page that filters out unqualified clicks before the form protects the higher acquisition cost per trade.
- Audit every review widget against the FTC rule. The Reviews and Testimonials Rule (16 CFR Part 465) has applied since October 21, 2024; a trust badge built on unverifiable reviews is now a legal exposure, not just a UX risk.
- Match page copy to the Pro or the DIY buyer, not both. Home Depot and Lowe's both cite Pro-driven growth in recent results; a single generic landing page underserves the higher-intent trade buyer.
- Re-test quarterly, not annually. HIRI's own forecast moved from 3.4% to 2.5% growth in one quarter; a page built for one macro assumption can be stale within a season.
Professional services data confirms the same pattern from another angle
Unbounce's Professional Services breakdown reports a 6.1% median conversion rate for that broader category, just under the 6.6% all-industry median, but its own sub-industry view shows repair and maintenance services converting roughly three times better than home and renovation services on the same survey. That is independent confirmation, from a different Unbounce cut of the data, of the same pattern LocaliQ's search-ad numbers show: a same-day, lower-cost service page consistently outperforms a considered, higher-ticket renovation page on conversion rate, regardless of which benchmark provider is measuring it.
Trust signals now carry legal risk, not just a UX cost
Star ratings, review counts and homeowner testimonials are standard CRO levers on a renovation landing page, and they are now regulated. The FTC's Rule on the Use of Consumer Reviews and Testimonials (16 CFR Part 465) has been enforceable since October 21, 2024, and it authorizes civil penalties against anyone who buys, sells or knowingly disseminates a fake review or a testimonial that misrepresents a real customer's experience. A retailer whose landing page cites "4.8 stars from verified customers" or features a homeowner testimonial video needs to be able to show that content is real and unedited; a CRO test that lifts conversion with an unverifiable trust badge is now a compliance exposure, not just a design choice.
How this compares with Web Tonic's own conversion work
Web Tonic's performance creative and growth marketing teams build landing pages against the same category logic used above: match the page to the buyer's consideration stage rather than the channel budget. See how the underlying paid channel is priced in Google Ads' 2026 pricing guide, how a lead-cost figure like the ones above compares across other verticals on the average cost per lead by industry page, and how conversion rate itself benchmarks more broadly on the conversion rate statistics page.
Frequently Asked Questions
What is a good conversion rate for a home renovation retail landing page?
There is no landing-page-only study for the category, so the honest answer blends two adjacent data sets. Unbounce's Conversion Benchmark Report puts the median across all industries at 6.6%, with home-improvement and renovation-adjacent verticals landing on the low side of that 3.8% to 12.3% range, while a repair and maintenance sub-industry on the same report converts roughly three times better than home and renovation services. LocaliQ's 2025 home-services search data, a proxy for the same buyer clicking through to a landing page, puts Doors & Windows Sales at 4.41% and the home-services average at 7.33%. Treat 4% to 7% as the band to beat, not a guarantee.
Why do Doors & Windows Sales landing pages convert lower than plumbing or HVAC?
Cost and consideration time. WordStream by LocaliQ's 2025 Home Services Benchmarks report prices the average cost per lead for Doors & Windows Sales at USD 200.34, the second-highest of the trades it tracks after Roofing & Gutters at USD 228.15, against an overall home-services average nearer USD 90. A five-figure window or door replacement is a considered purchase, so shoppers request several quotes before converting on any single page, which pulls the click-to-lead rate down even when the page itself is well built.
Do Home Depot's and Lowe's own digital numbers say anything about landing page investment?
Indirectly, yes. Home Depot told investors that sales leveraging its digital platforms grew approximately 11% in the fourth quarter of fiscal 2025, and Lowe's FY2025 annual report states online sales grew 8.8% and now make up 13% of total retail sales. Neither number isolates a landing page, but both retailers are still moving mid-single-digit-plus percentages of total revenue onto pages the marketing team designs and tests, which is the scale that makes a one-point CRO gain worth chasing.
Should a home renovation retailer chase the Unbounce median or the LocaliQ average?
Neither number alone. Unbounce measures completed landing-page form conversions across 41,000 pages and 57 million-plus conversions; LocaliQ measures search-ad clicks that turn into a lead across 3,211 campaigns in the same window. A page built for a Doors & Windows Sales campaign should be graded against the LocaliQ 4.41% figure because that is the same funnel stage and the same buyer intent; a page built for a broader renovation-inspiration or catalog visit should be graded against the Unbounce home-improvement range instead.
What does the FTC's reviews rule mean for a renovation retailer's landing page?
The FTC's Rule on the Use of Consumer Reviews and Testimonials, in force since October 21, 2024 (16 CFR Part 465), bans buying or selling fake reviews and using company-controlled review sites without disclosure. A landing page that leans on trust badges, star ratings or homeowner testimonials to lift conversion has to be able to show those reviews are real and unedited, or the CRO gain becomes a compliance liability instead of a win.
Sources
Unbounce — Conversion Benchmark Report
Unbounce — Professional Services conversion rate breakdown
WordStream by LocaliQ — 2025 Home Services Benchmarks (PDF)
WordStream — 2025 Google Ads Benchmarks
The Home Depot — Q4 FY2025 earnings call transcript
The Home Depot — Q4 and fiscal 2025 results release
Lowe's — 2025 Annual Report
Lowe's — Q4 2025 press release
US Census Bureau — Monthly Retail Trade, NAICS 444
Harvard Joint Center for Housing Studies — Leading Indicator of Remodeling Activity
HIRI — U.S. Size of the Home Improvement Products Market, 2025 Q3
Federal Trade Commission — Final rule banning fake reviews and testimonials


