



Table of contents
Just 49.1% of the mobile web passes all three Core Web Vitals, and 76% of HVAC searches happen on mobile. For a heating and ventilation contractor, technical SEO is not an abstraction — it is the difference between a homeowner reaching a booking form in two seconds and abandoning at a 53% bounce rate. Here is the 2026 data that matters.
Key Takeaways
- 49.1% of mobile and 58.0% of desktop sites pass all three Core Web Vitals as of May 2026 — a 9-point device gap.
- LCP is the mobile bottleneck at 64.4% good; on desktop CLS is weakest at 72.8%.
- Bounce rate climbs from 9% at 1-2 seconds to 53% at 5-10 seconds.
- Every 100ms of latency costs ~1% in conversions; 1-second pages convert at 3.05% versus 1.08% at 6 seconds.
- 71% of sites deploy schema but only 22% validate cleanly — a 49-point gap.
- Crawl budget waste averages 30-40% without crawl directives; canonical fixes lift indexation 20-35% in 60 days.
- 73% of pages with good CWV rank in the top 10 versus 53% with poor scores.
- 95% of HVAC organic leads convert by phone, and phone leads close at ~46% versus 7.8% for forms.
1. Core Web Vitals Pass Rates in May 2026
Field data from Chrome's real-user dataset puts mobile pass rates at 49.1% and desktop at 58.0%, up from 28.6% on mobile in 2022 — a 20-point gain in four years.
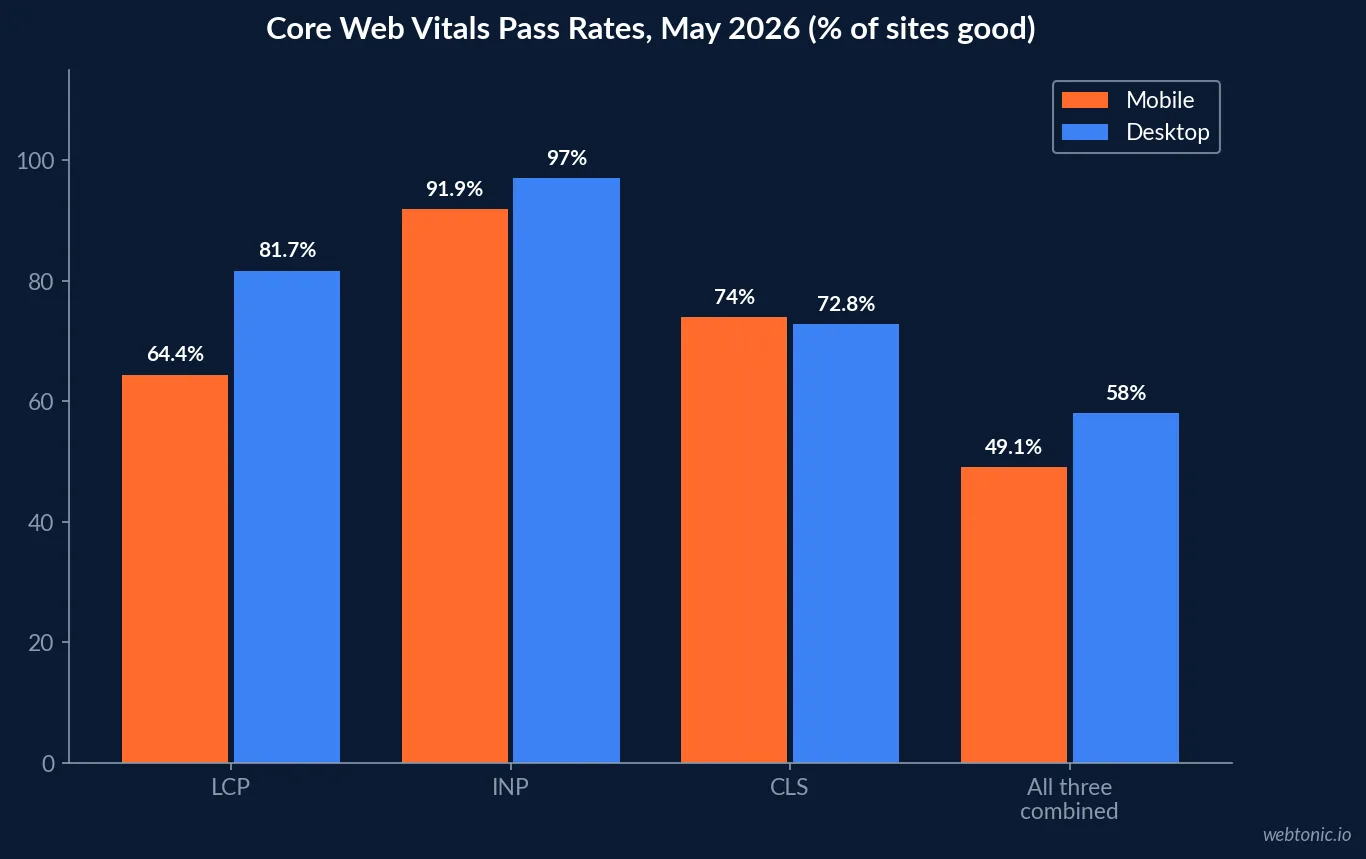
| Metric | Threshold (good) | Mobile good | Desktop good |
|---|---|---|---|
| LCP | ≤ 2,500 ms | 64.4% | 81.7% |
| INP | ≤ 200 ms | 91.9% | ~97% |
| CLS | ≤ 0.1 | 74.0% | 72.8% |
| All three combined | Simultaneous pass | 49.1% | 58.0% |
Two details change how a contractor should read this. Popularity forms a U-shape: top-1,000 sites hit 55.9% mobile pass while mid-market sites ranked 10,000 to 100,000 bottom out at 41.7% — the tier most local business sites resemble. And the country spread is nearly tenfold, from Sweden at 70.8% to Nigeria at 7.8% on mobile, because field data reflects real devices and networks, not a lab score. Independent real-user tracking across 200,000 websites reports 81.7% good LCP, 91.9% good INP and 88.8% good CLS at the p75 level, confirming that the composite pass is what fails, not usually one metric in isolation.
2. Why LCP Is the HVAC Priority
Aggregated 2026 technical benchmarks put average LCP at 2.1 seconds on desktop versus 3.8 seconds on mobile — an 81% difference — with combined CWV pass rates around 42% and HTTPS adoption at 95.6%.
| Finding | Figure | Source context |
|---|---|---|
| Pages with good CWV in Google's top 10 | 73% | vs 53% with poor scores |
| Bounce reduction from passing all three | 24% lower | Google / Deloitte Digital |
| Conversion lift from LCP 4s → 2s | +15% | Vodafone case study |
| Pageview lift from same improvement | +8% per session | Vodafone case study |
| Sites failing INP after FID retirement | 35% | INP replaced FID March 2024 |
| E-commerce sites passing all three | 31% | vs 54% informational sites |
The INP transition is worth flagging because it caught many sites unaware: performance research notes sites that passed FID at 97% now pass INP at only 65%. The same analysis records 2.3MB median page weight (up 12% from 2024), 34% of page weight from third-party scripts, 62% of web traffic on mobile, and platform-level differences — framework-based sites passing at 58% against WordPress at 38%.
3. The Speed-to-Revenue Curve
Speed benchmark data makes the cost of latency concrete, and the shape of the curve is what matters: the penalty accelerates rather than scaling linearly.
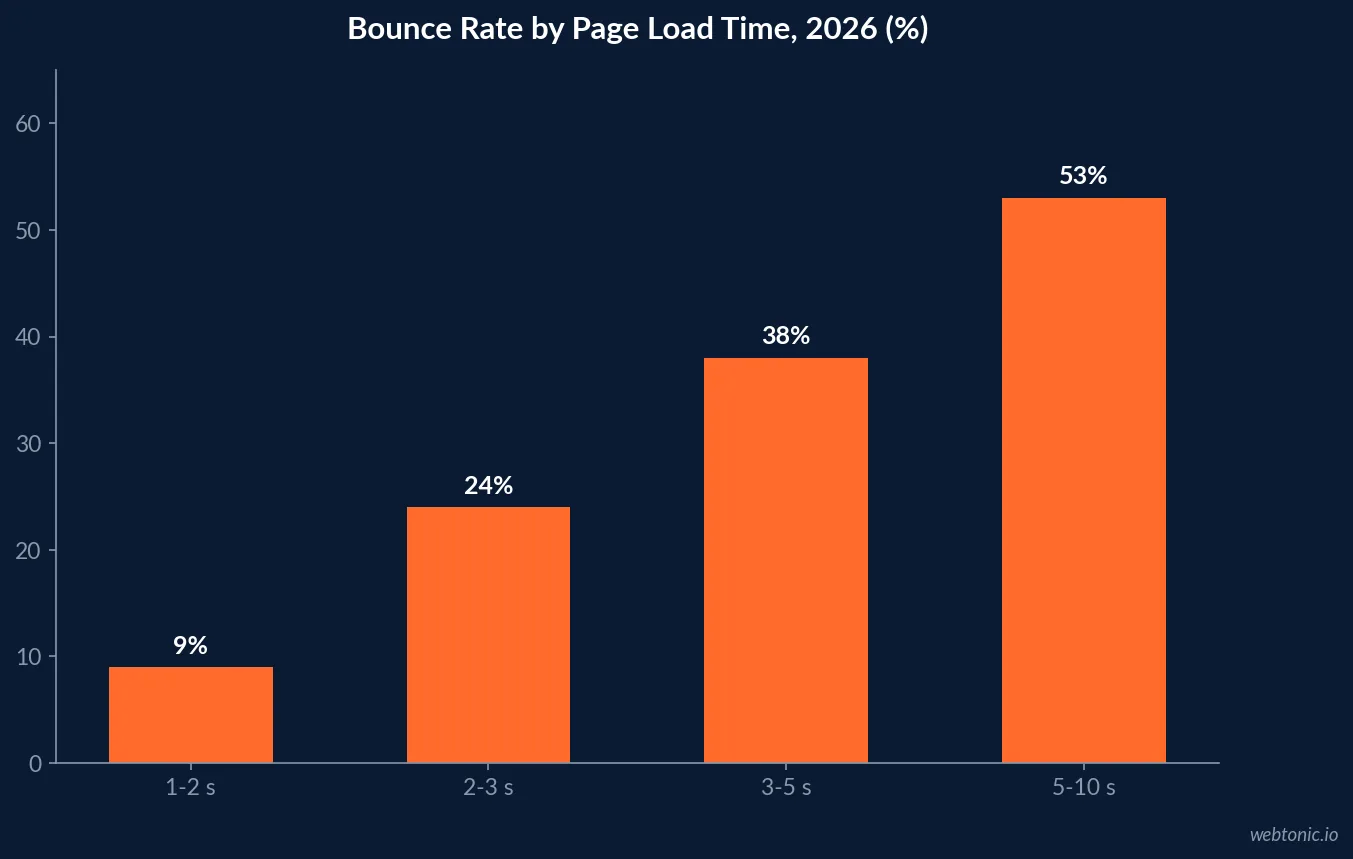
| Load time | Bounce rate | What it means for a booking page |
|---|---|---|
| 1-2 seconds | 9% | Nine in ten visitors stay |
| 2-3 seconds | 24% | A quarter gone before the form |
| 3-5 seconds | 38% | Typical unoptimised HVAC mobile site |
| 5-10 seconds | 53% | Majority lost |
The corroborating enterprise data is unusually consistent: Amazon calculated 100ms of latency costs 1% of sales, Walmart found conversions rose 2% per 1-second improvement, the BBC loses 10% of its audience per additional second, and Portent measured 3.05% conversion at 1 second falling to 1.08% at 6 seconds. Alongside that, 70% of consumers say page speed influences purchase decisions, 53% of mobile visitors abandon after 3 seconds, and 79% who hit performance issues say they will not return.
4. Schema Markup: High Adoption, Low Validity
An April 2026 audit of 5,000 production sites across eight CMS platforms and 11 schema types produced the most actionable finding in this dataset.
| Schema metric | Result | Interpretation |
|---|---|---|
| Sites deploying ≥1 schema type | 71% | Adoption is no longer a differentiator |
| Sites passing Rich Results Test cleanly | 22% | Validity is the differentiator |
| The gap | 49 points | 49% sit in deploy-but-broken middle |
| Sites with ≥1 validation error | ~60% of schema users | Blocks rich results outright |
| Correlation with AI citation rate | +0.34 for valid schema | Matters as AI answers grow |
For a contractor the required types are narrow and testable: LocalBusiness or HVACBusiness with consistent NAP, Service entries per offering, FAQPage on advice content, and Review or AggregateRating where genuinely earned. Deploying all four badly is worse than deploying two cleanly. The local-entity layer is covered in depth in our HVAC local SEO statistics.
5. Crawl Budget and Indexation on Service-Area Sites
HVAC sites accumulate city and service-combination pages faster than almost any other local vertical, which turns crawl efficiency into a real constraint. 2026 benchmark analysis quantifies the common failure modes.
| Indexation signal | Benchmark | Action threshold |
|---|---|---|
| Healthy indexation ratio | 70%-90% | Normal for maintained sites |
| Ratio below 70% | Structural warning | Audit architecture |
| Ratio below 50% (mature site) | Audit required | Usually templating or thin pages |
| Crawl budget waste without directives | 30%-40% | Add robots rules, control facets |
| Indexation lift after canonical fixes | +20%-35% in 60 days | Highest-leverage cleanup |
| Schema validation error rate | ~60% of adopters | Validate before scaling pages |
The same research notes that fewer than 45% of pages on large JavaScript-heavy domains pass all three Core Web Vitals simultaneously, and warns about the most common misreading of Search Console: confusing submitted with indexed. A site with 10,000 submitted URLs and 4,000 indexed is rarely producing bad content — it is producing duplicate templates at scale. Teams building city-page systems should read our approach in growth marketing.
6. What Technical Quality Is Worth in HVAC Lead Terms
HVAC-specific SEO research attaches revenue behaviour to the technical work.
| HVAC organic metric | Figure | Comparison |
|---|---|---|
| Organic lead to customer rate | 50% | vs 45% paid digital |
| Organic share of unique lead volume | 42% | 44% of paying customers |
| Organic leads converting by phone | 95% | Not forms, not chat |
| Phone lead close rate | ~46% | vs 7.8% for form fills |
| Established organic cost per lead | $10-$30 | vs $104 blended Google Ads |
| Advertisers seeing CPL increases | 69%, avg +10.51% | Paid costs rising |
Because 95% of organic HVAC leads arrive by phone, the technical priorities are not the usual e-commerce list. Click-to-call must be above the fold on mobile, tap targets must not shift during layout (the CLS problem), and the number must be crawlable text rather than an image. A 3.8-second mobile LCP on a page whose only conversion action is a phone tap is a direct loss of the highest-closing lead type a contractor has.
7. The Map Pack and Profile Layer
Technical work on the website is only half the local equation. Google Business Profile research shows the profile itself behaving like a ranking and conversion asset.
| Profile factor | Measured effect | Why it compounds |
|---|---|---|
| Complete, verified profiles | 80% more discovery appearances | 4x more website visits |
| Profiles with 100+ photos | 520% more calls | 1,065% more website clicks |
| Profiles with 10+ photos | 42% more direction requests | Low-effort baseline |
| Review signals in local pack weight | 16% → 20% (2023-2026) | Growing ranking factor |
| ≥1 new review per week | Rank ~25% higher | Velocity beats total volume |
| Consumers refusing sub-4-star businesses | 68% | 31% require 4.5+ |
| GBP interactions on mobile | 71% | Mobile-first by default |
Contractor-specific estimates place Map Pack click share at 40% to 60% of total page clicks where it appears, with mobile share of local HVAC searches generally cited at 60% to 75%+, and separate analysis puts the top three Google Maps results at 65% to 75% of all local clicks.
8. AI Answers Are Changing the Technical Brief
2026 HVAC marketing data estimates 22% of home-service searches now surface an AI-generated response before a click, while 76% of HVAC searches happen on mobile, up from 73%.
| AI-era signal | Data point | Technical implication |
|---|---|---|
| Home-service searches with AI answers | 22% | Structure content for extraction |
| Valid schema ↔ AI citation correlation | +0.34 | Validation is now a visibility lever |
| AI naming a specific provider | Almost never | Category answers, not brand answers |
| AI “hire a professional” rate for HVAC | 66.7% | 14-industry average 44.2% |
| Mobile share of HVAC search | 76% | Mobile CWV is the only CWV |
That 66.7% pro-recommendation rate is a favourable structural fact for contractors: assistants overwhelmingly tell HVAC searchers to hire a professional rather than attempt a repair, but they rarely name one. Clean entity markup, consistent NAP and extractable answer formatting are the mechanisms by which a specific contractor becomes nameable. Our HVAC SEO statistics covers the content side of the same problem.
9. A Prioritised Technical Audit for Contractor Sites
| Priority | Fix | Expected effect |
|---|---|---|
| 1 | Mobile LCP under 2.5s (hero images, third-party scripts) | Bounce from 38% toward 9-24% |
| 2 | Click-to-call above the fold, stable layout | Protects the 46%-closing lead type |
| 3 | Validate every schema type emitted | Joins the 22%, not the 49% broken |
| 4 | Resolve canonical chains and duplicate city pages | +20-35% indexation in 60 days |
| 5 | Crawl directives and faceted-nav control | Recovers 30-40% wasted crawl |
| 6 | Trim third-party scripts (34% of page weight) | Improves INP and LCP together |
| 7 | Google Business Profile completeness and photos | 80% more discovery appearances |
| 8 | Weekly review acquisition cadence | ~25% ranking uplift vs stale profiles |
Sequenced that way, the work compounds: speed improves both ranking eligibility and conversion, indexation cleanup makes city pages viable, and schema validity feeds both rich results and AI citation. The measurement scaffolding behind it — call tracking, source attribution, and page-level conversion reporting — sits in our data intelligence work.
10. What the Data Recommends
- Treat mobile as the only benchmark. 76% of HVAC searches and 62% of all web traffic are mobile.
- Fix LCP first. It is the failing metric at 64.4% good on mobile.
- Target the composite pass, not one metric. Only 49.1% of mobile sites clear all three.
- Validate schema before adding more of it. 71% deploy, 22% validate.
- Audit indexation ratio quarterly. Below 70% is a structural signal.
- Budget for third-party script discipline. 34% of page weight, rising median page size.
- Optimise for the phone call. 95% of organic HVAC leads convert that way.
- Keep the profile layer active. Review velocity and photo depth move both rank and calls.
The summary for 2026: technical SEO for a heating and ventilation business is a mobile speed problem, a schema validity problem and an indexation hygiene problem — in that order. The industry averages are beatable, since roughly half the web fails the composite Core Web Vitals check and only 22% of sites ship valid structured data. Contractors weighing where technical work sits against paid channels can compare the economics in our HVAC digital marketing statistics and HVAC LinkedIn Ads statistics, or bring the audit to our team.
Frequently Asked Questions
What Core Web Vitals score does an HVAC website need in 2026?
All three metrics must pass simultaneously at the 75th percentile over a rolling 28-day window: LCP at or under 2,500 milliseconds, INP at or under 200 milliseconds, and CLS at or under 0.1. As of May 2026, 49.1% of the mobile web and 58.0% of the desktop web clear all three. LCP is the mobile bottleneck at 64.4% good, while CLS is the surprising desktop weak point at 72.8%. For HVAC specifically the mobile number is what counts, because roughly 76% of HVAC searches happen on mobile devices.
Does page speed actually affect HVAC lead volume?
The bounce curve is steep and well documented. Pages loading in 1 to 2 seconds see a 9% bounce rate; 2 to 3 seconds pushes it to 24%, 3 to 5 seconds to 38%, and 5 to 10 seconds to 53%. Conversion data mirrors it: pages loading in 1 second convert at 3.05% versus 1.08% at 6 seconds, and every 100 milliseconds of additional latency costs roughly 1% in conversions. Since 95% of HVAC organic leads convert by phone call and phone leads close at about 46% against 7.8% for form submissions, a slow mobile page is losing calls, not just sessions.
Is schema markup worth implementing for a contractor site?
Yes, but implementation quality is where most sites fail. A 5,000-site audit in April 2026 found 71% of sites deploy at least one schema type while only 22% pass Google's Rich Results Test cleanly across every type they emit — a 49-point gap, with 49% of sites sitting in the deploy-but-broken middle. Roughly 60% of sites using schema have at least one validation error preventing rich results. Valid schema also correlated +0.34 with AI-search citation rate, which matters as AI answers absorb more contractor queries.
How much does indexation matter for a local HVAC site?
More than most contractors realise, because service-area and city pages multiply quickly. Indexation ratios of 70% to 90% are typical for well-maintained sites, while ratios below 50% on a mature site usually warrant a technical audit, and ratios below 70% often signal structural problems. Crawl budget waste averages 30% to 40% on sites without crawl directives and faceted navigation controls, and sites that resolve canonical chain conflicts see indexation coverage improve 20% to 35% within 60 days.
What is the single highest-return technical fix for an HVAC website?
Mobile LCP, in almost every audit. It is the metric most sites fail, average LCP is 2.1 seconds on desktop against 3.8 seconds on mobile — an 81% difference — and mobile is where the traffic is. The usual causes are uncompressed hero imagery, third-party scripts (now 34% of total page weight) and a 2.3MB median page weight that has risen 12% since 2024. Fixing LCP simultaneously improves the bounce curve, the conversion curve and the ranking signal: 73% of pages with good Core Web Vitals rank in the top 10 versus 53% of pages with poor scores.
Sources
PageSpeed Matters — Core Web Vitals Pass Rates, May 2026
SearchLab — Technical SEO Statistics 2026
SearchLab — Website Speed & Performance Statistics 2026
Digital Applied — Page Speed Statistics & Revenue Impact 2026
Digital Applied — Schema Markup Adoption: 5,000-Site Audit 2026
Authority Specialist — Technical SEO Statistics
Authority Specialist — HVAC SEO Statistics
CoreWebVitals.io — State of Core Web Vitals
PipelineOn — HVAC SEO Guide 2026
The Stacc — Google Business Profile & Map Pack Study
RYN Digital — HVAC Marketing Statistics 2026


