



Table of contents

Measuring a fractional head of growth means measuring two separate things: whether the growth system improved, and whether the leadership hours caused it. Most scorecards conflate them and then argue about attribution.
Key Takeaways
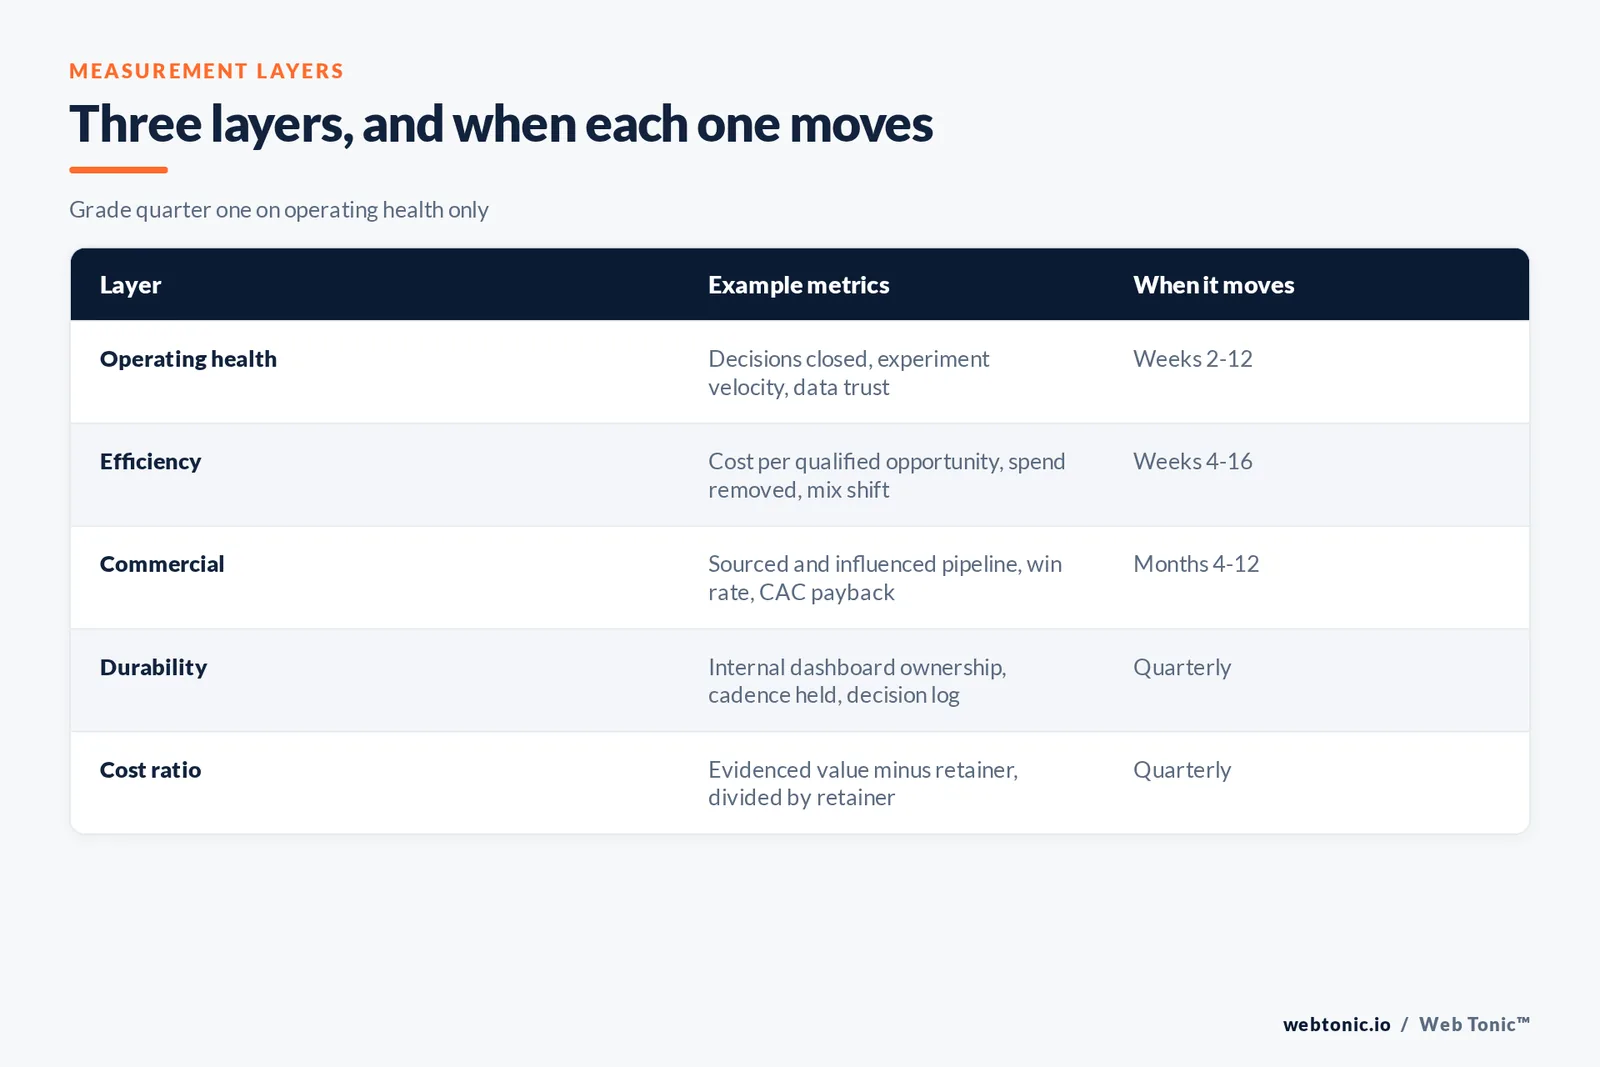
- Use three layers: operating health (weeks 2–12), efficiency (weeks 4–16), commercial outcome (months 4–12). Grade quarter one on the first layer only.
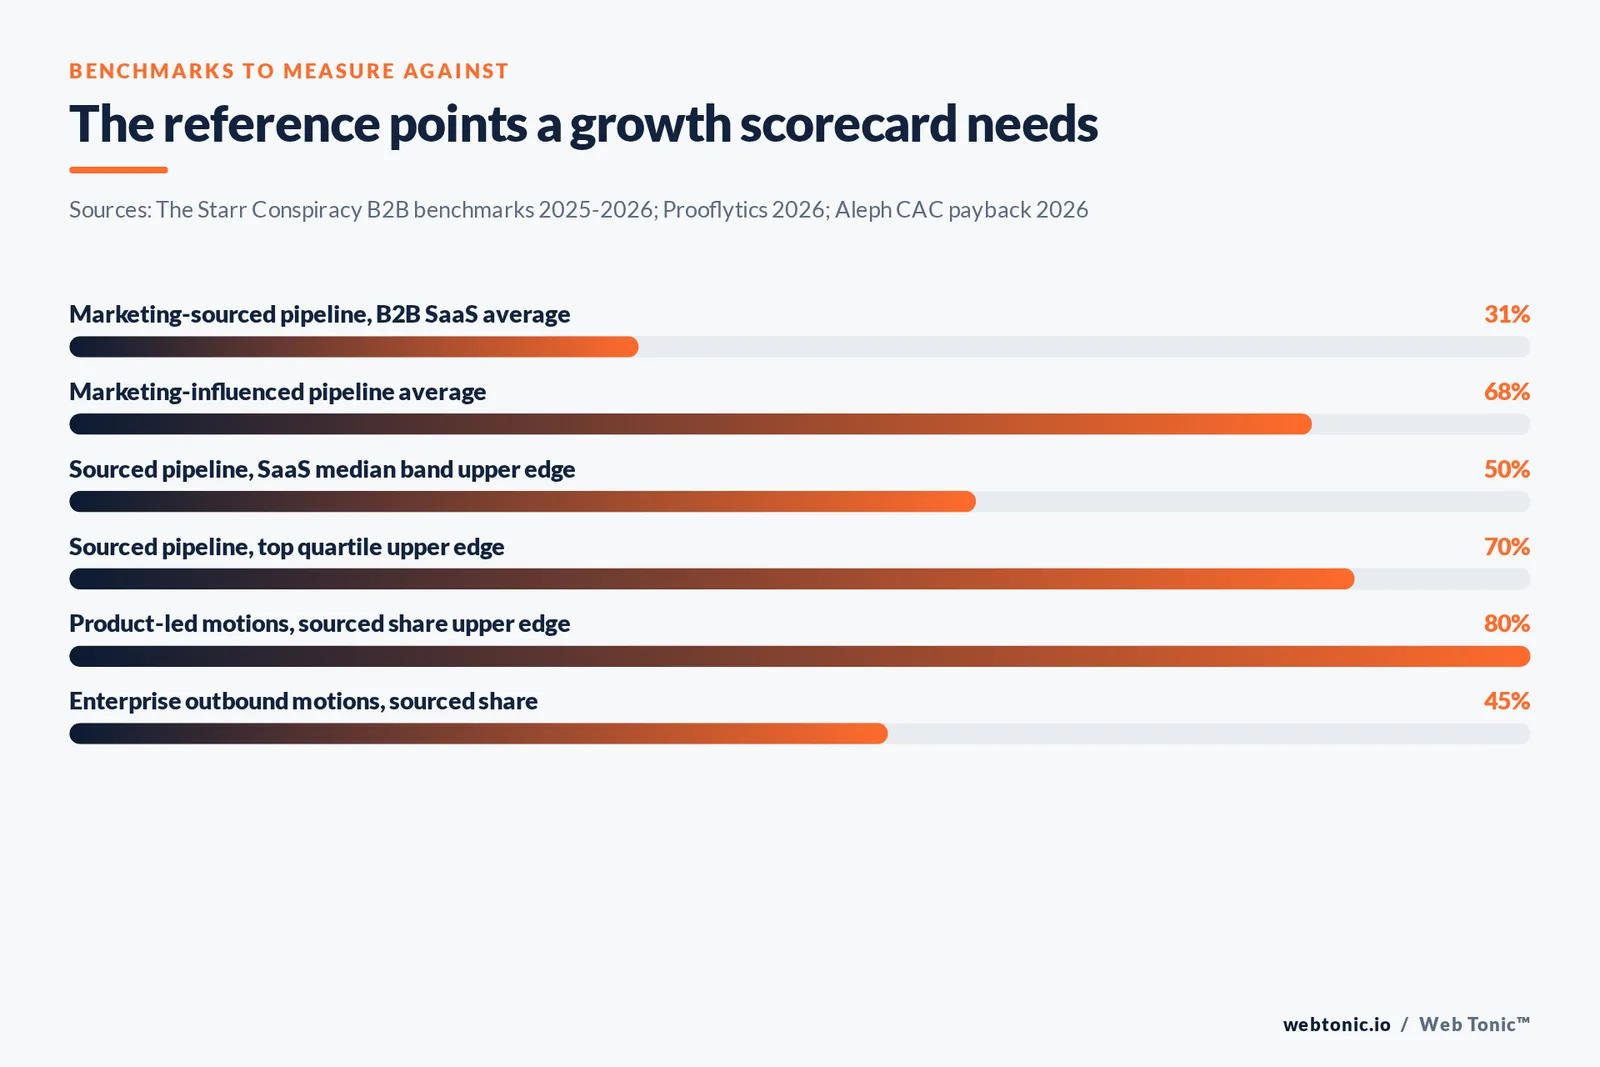
- Pipeline share is the anchor metric. B2B SaaS benchmarks put marketing-sourced pipeline near a 31% average, with a 30–50% median band and 60–70% in the top quartile.
- Pair sourced with influenced pipeline — benchmarked around 68% — so one number cannot be gamed by changing attribution rules mid-quarter.
- Experiment velocity is the cleanest leadership signal: 1–2 valid experiments a month early-stage, 3–5 with a structured process, 6–10 in high-performing operations.
- Payback sets the judgement window. Full-year 2025 actuals across 342 companies show a 16-month median CAC payback, 6 months top quartile and 24-plus at the bottom.
- Express cost as a ratio, not a feeling. A $5,000–$15,000 monthly retainer against pipeline created, waste removed and decisions closed is a defensible board slide.
Decide what the role was hired to change
A scorecard is only meaningful if it matches the mandate. A fractional head of growth hired to fix channel economics should not be graded on brand awareness; one hired to build an experimentation system should not be graded on a single campaign's ROAS. Engagement norms of 10–20 hours a week also cap what is fair: the role owns decisions, priorities and the system, while execution capacity sits elsewhere.
So write the measurement plan at kickoff and name three things: the two or three decisions the quarter must close, the leading indicators that show the system improving, and the commercial metric you will judge over two to three quarters. Anything not on that list is context, not a grade.
Then fix the instrument before reading it. If conversion and pipeline data are not verified end to end, the first month of any scorecard measures your tracking, not your growth — which is why measurement repair is usually the first item our data intelligence team touches on a new engagement.
| Layer | Example metrics | When it should move |
|---|---|---|
| Operating health | Decisions closed, experiment velocity, data trust, forecast accuracy | Weeks 2–12 |
| Efficiency | Cost per qualified opportunity, wasted spend removed, channel mix shift | Weeks 4–16 |
| Commercial | Marketing-sourced and influenced pipeline, win rate, CAC payback | Months 4–12 |
| Durability | Internal ownership of dashboards, cadence held, documented decisions | Quarterly |
It also helps to be explicit about which operator you hired. A fractional CGO or chief growth officer with a cross-functional remit — acquisition, activation, retention, and the paid and product surfaces in between — is accountable for a wider funnel than a fractional CMO focused on demand and brand, or a CRO focused on the sales model. In a SaaS business with recurring revenue, the founder usually cares most about the customer economics at each stage: what acquisition costs, how activation converts, and whether retention holds long enough for the model to scale. Those four words belong on the scorecard as named metrics, not as themes, and the head of growth's own execution time should be visible against them.
Layer one: operating health
This is the layer the role controls directly, so it carries most of the weight in quarter one. Four metrics do the job. Decisions closed: how many of the named quarter-one decisions are documented, signed and being acted on. Experiment velocity: valid experiments launched per month against a stated baseline. Data trust: verified events over expected events, traced from click to CRM record. Forecast accuracy: how close last month's forecast was to actuals.
Velocity deserves a benchmark rather than a target plucked from the air. Published velocity benchmarks put early-stage growth teams at 1–2 valid experiments a month, teams with a structured process at 3–5, and high-performing operations at 6–10 across creative, landing page, offer and email surfaces. Moving one band inside a quarter is a strong result; skipping two usually means the definition of "experiment" loosened.
Add a quality guard alongside the count. Track the share of experiments that reach a decision (win, lose or inconclusive with a reason) rather than the share that win. Counting only winners incentivises safe tests, and safe tests are how a growth programme becomes an optimisation programme without anyone noticing.
Layer two: efficiency
Efficiency is where leadership shows up in money without waiting for a sales cycle. Three measures matter: cost per qualified opportunity against the written lead definition, spend actually reallocated or switched off (evidenced by change history, not identified in a document), and the shift in channel mix towards channels that pay back.
The discipline here is definitional. Cost per qualified opportunity is worthless if the qualification bar moves during the measurement window, which is why the definition belongs in the day-60 decision log with the sales leader's name on it. Similarly, count reallocated budget only where the change is visible in a platform or finance record.
Report the mix shift as a share, not a story. If paid search went from 70% to 45% of spend while cost per qualified opportunity fell, that is a decision with evidence attached; if the mix is unchanged after a quarter, the stop list from the diagnostic phase was advisory. That distinction is the single most useful thing a finance stakeholder can be shown, and it travels well alongside delivery work in growth marketing.
Layer three: commercial outcome
Pipeline is the anchor, and it needs two numbers rather than one. B2B benchmark data reports marketing-sourced pipeline averaging about 31% for B2B SaaS with influenced pipeline near 68%, and recommends pairing the two for a coverage-plus-credit view. 2026 benchmark analysis adds motion context: a 30–50% SaaS median, 60–70% top quartile, 60–80% for product-led motions and 30–45% for enterprise businesses with strong outbound.
Then payback. 2026 payback benchmarks built on full-year 2025 actuals from 342 companies show a 16-month median, a top quartile of 6 months or fewer and a bottom quartile of 24 months or more. Two consequences follow: judging a growth leader on closed revenue at day 90 is a category error, and improving payback by even a few months is a larger win than most campaign-level gains.
Win rate and deal quality complete the picture. A growth leader who narrows targeting will often reduce lead volume and raise win rate — a result that looks like failure on a volume dashboard and like progress on a revenue one. Agree in advance which of those you are optimising for, because the two dashboards will disagree in month two.
Turning the scorecard into a cost ratio
Boards ask one question: was the retainer worth it. Answer it with arithmetic and shown inputs. On the cost side, published ranges put fractional growth leadership at $5,000–$15,000 a month for 10–20 hours a week, with ARR-banded guidance of $8,000–$12,000 at $1M–$5M ARR and $12,000–$20,000 above it. On the comparison side, a full-time equivalent starts at a $140,000 median base and reaches $180,000–$280,000 for senior venture-backed roles, before benefits, tooling and a search fee.
On the value side, use only what you can evidence: pipeline created against the sourced definition, spend removed per change history, and cost-per-opportunity improvement applied to actual volume. Then state what you have not attributed — seasonality, pricing changes, a new competitor — because the credibility of the ratio depends on the exclusions being visible.
Include the avoided-risk line if the alternative was a hire. Senior mis-hire benchmarks cite costs of up to 213% of salary plus roughly $28,000 of executive process cost and search fees of 25–35% of salary, and executive-hiring research puts the total cost of a failed executive hire at 5–10x annual salary. Optionality has a price, and a quarter of fractional leadership is a cheap way to buy it.
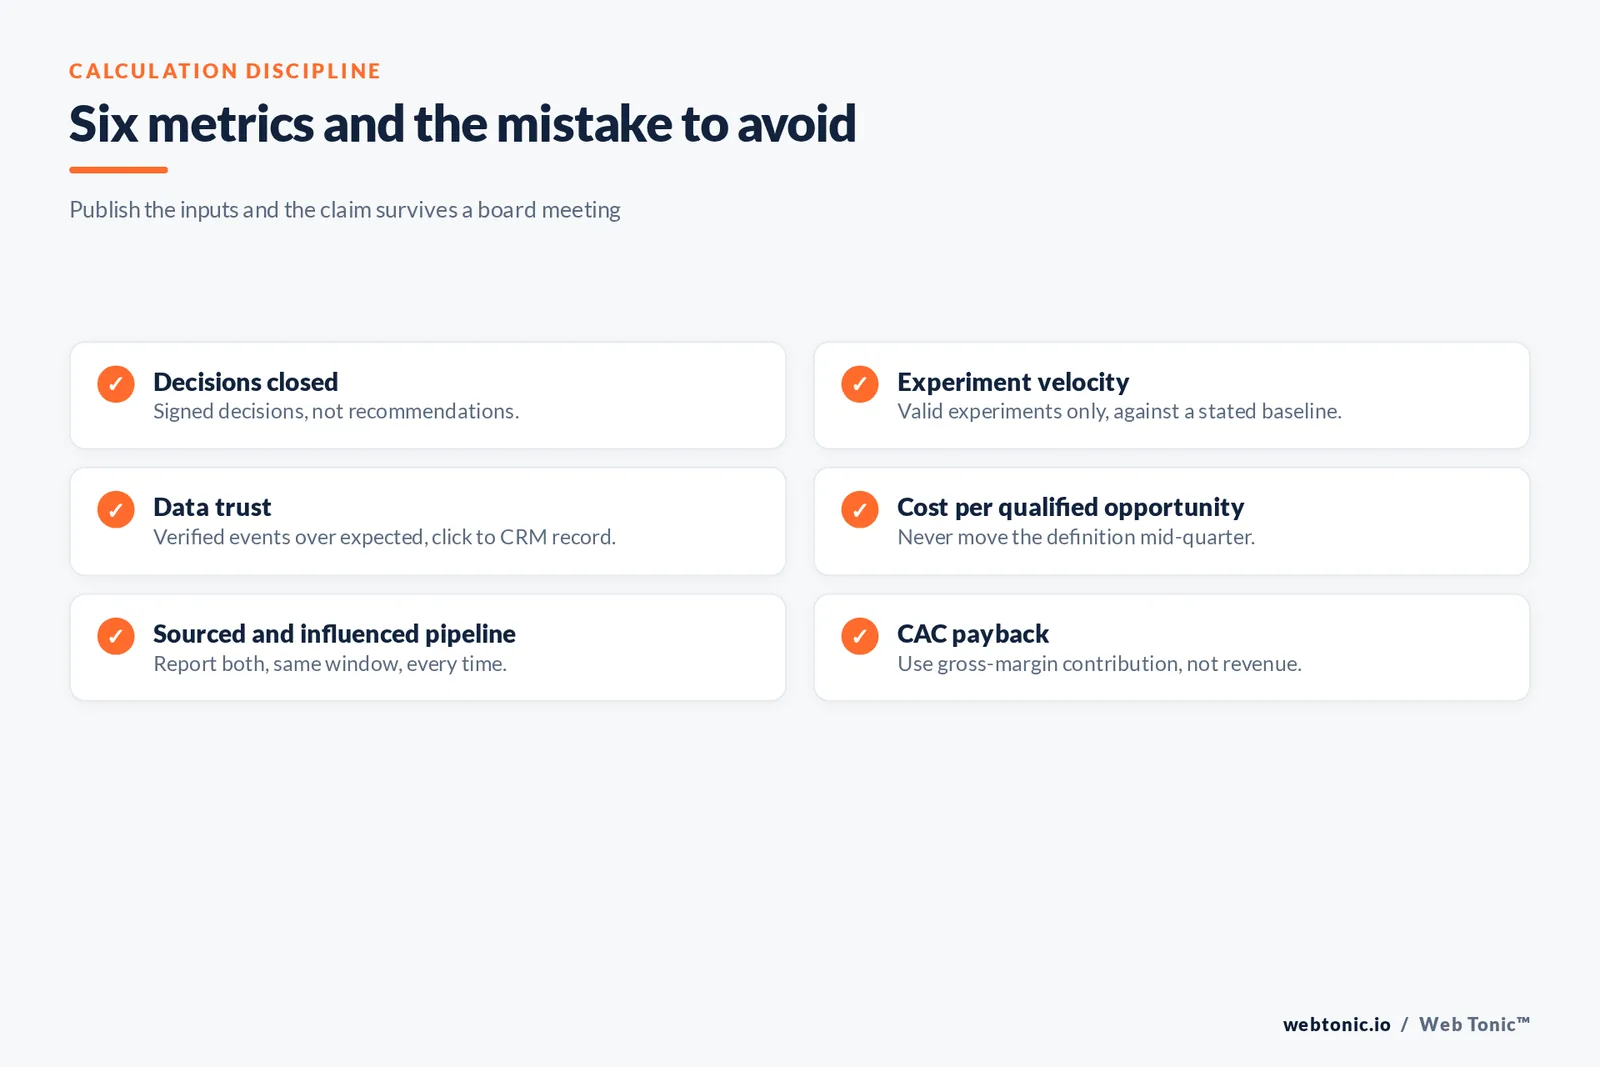
| Metric | How to calculate it | Common mistake |
|---|---|---|
| Decisions closed | Signed decisions ÷ decisions named at kickoff | Counting recommendations as decisions |
| Experiment velocity | Valid experiments launched per month vs baseline | Counting anything shipped as an experiment |
| Data trust | Verified events ÷ expected events, click to CRM | Trusting the platform's own status label |
| Cost per qualified opportunity | Spend ÷ opportunities meeting the written definition | Changing the definition mid-quarter |
| Sourced and influenced pipeline | Both shares reported together, same window | Reporting whichever number looks better |
| CAC payback | CAC ÷ monthly gross-margin contribution per customer | Using revenue instead of gross margin |
Company stage changes what is worth measuring at all. A business at $1M–$5M ARR is testing whether a repeatable acquisition motion exists, so the honest scorecard is about product-market signal, funnel conversion and experience quality rather than efficiency at scale. Past $10M ARR the question flips: the motion works, and the growth team's job is to scale it without letting CAC drift. A good operator will say which of those two jobs they are doing, and will refuse metrics that belong to the other one.
Setting the baseline you will be judged against
A baseline needs four properties: it is recorded before any change ships, it uses corrected data, it names the comparison window, and it carries the external benchmark alongside your own number. Skip any of those and the day-90 review turns into a debate about whether the number is "good".
The corrected-data point does most of the work. If duplicate conversion events are removed in week two, reported performance will appear to get worse — so the before-and-after must be captured as a finding, side by side, in the diagnostic document. Teams that skip this step spend month two defending a fix instead of building on it.
Window discipline matters almost as much. Comparing a 30-day post-change period against a 90-day pre-change average is a common own goal; use equal lengths, matched for seasonality where you can, and state the window on the report. And record the market context: a 31% sourced-pipeline average, a 16-month median payback and a 3–5 monthly experiment band are the reference points that make your own numbers legible to a board that does not live in the account.
One more baseline is worth capturing and almost always skipped: the cost of the status quo. Record what current spend is producing at current conversion rates before the engagement changes anything, because the strongest case a growth leader makes in month three is usually the counterfactual — what the quarter would have cost had nothing been stopped.
Reporting cadence that survives scrutiny
Weekly, review decisions and blockers — 60 minutes, no slides, the decision log open. Monthly, publish one page: the three layers, the benchmark next to each number, and what changed as a result. Quarterly, re-score against the kickoff baseline and take one of three branches: continue, change scope, or hand over to a permanent hire.
Two rules keep the reporting honest. First, one dashboard, owned internally — if only the fractional lead can produce the numbers, you have bought a dependency rather than a system. Second, never restate history silently; when a definition changes, publish the old and new series side by side for one cycle.
Finally, put the benchmark on the page. A 34% sourced-pipeline share reads as a failure in isolation and as solid progress next to a 31% B2B SaaS average, and the same is true of payback and velocity. Context is what turns a scorecard into a decision, which is the whole point of buying fractional growth leadership in the first place. There is more on the operating detail across the blog, or bring us your current numbers.

Related reading
- Fractional CGO / Head of Growth — How to Report It to a Board
- Fractional CGO / Head of Growth: what it costs in 2026
- Fractional CGO / Head of Growth: what it is and when you actually need one
- Marketing Strategy Consulting services at Web Tonic
Frequently Asked Questions
What is the single best metric for a fractional head of growth?
There isn't one, but if forced to choose in quarter one, use experiment velocity against a stated baseline — it is controllable, benchmarked (1–2, 3–5 and 6–10 valid experiments a month by maturity), and it predicts the later commercial layers.
When should we expect pipeline to move?
Leading indicators inside 90 days; sourced pipeline share over two to three quarters. With a median CAC payback of about 16 months, revenue-level proof arrives later than most engagement terms, which is why the judgement window belongs in the contract.
How do we stop attribution arguments?
Report sourced and influenced pipeline together in the same window, freeze definitions in a signed decision log, and publish both series for one cycle whenever a definition changes. Most attribution disputes are definition disputes wearing a disguise.
How do we calculate whether the retainer paid for itself?
Evidenced value — pipeline created under the sourced definition, spend removed per change history, cost-per-opportunity improvement applied to real volume — minus the retainer, divided by the retainer, with exclusions stated. A monthly retainer of $5,000–$15,000 makes the arithmetic simple; the discipline is in the exclusions.
Should the fractional lead own the dashboard?
They should design it and an internal owner should run it. Design without handover is the most common way a strong quarter fails to compound, because the reporting stops the week the engagement does.
Sources
The Starr Conspiracy (B2B marketing benchmarks 2025–2026), Prooflytics (marketing-sourced pipeline benchmarks 2026), Aleph (CAC payback benchmarks 2026), Exactius (experimentation velocity benchmarks), MarketerHire (fractional head of growth engagement norms and rates), Treetop Growth Strategy (2026 fractional executive pricing guide), Founderpath (SaaS head of growth salary benchmarks), Talentfoot (senior leadership mis-hire benchmark 2026), JRG Partners (cost of a bad executive hire 2026). Accessed September 2026.


