



Table of contents
Food Service & Catering Ad Creative Statistics
Professional food photography increases delivery-app orders by 35% and UGC video earns a 25.47% hook rate for food brands. Here are the ad creative benchmarks shaping food service and catering marketing in 2026.
Key Takeaways
- Food photography lifts delivery-app orders by 35% and menu conversion rates by 25% (Snappr/Grubhub)
- UGC for food & bev brands delivers 2.57 ROAS, peaking at 3.07 during December holiday hosting (Billo)
- Video ads generate 4.2× more engagement than static image posts for hospitality brands (Sprout Social)
- Catering Meta Ads produced 8× ROAS and $32,000 in new revenue from $4,000 ad spend over 4 months (AI Advantage Agency)
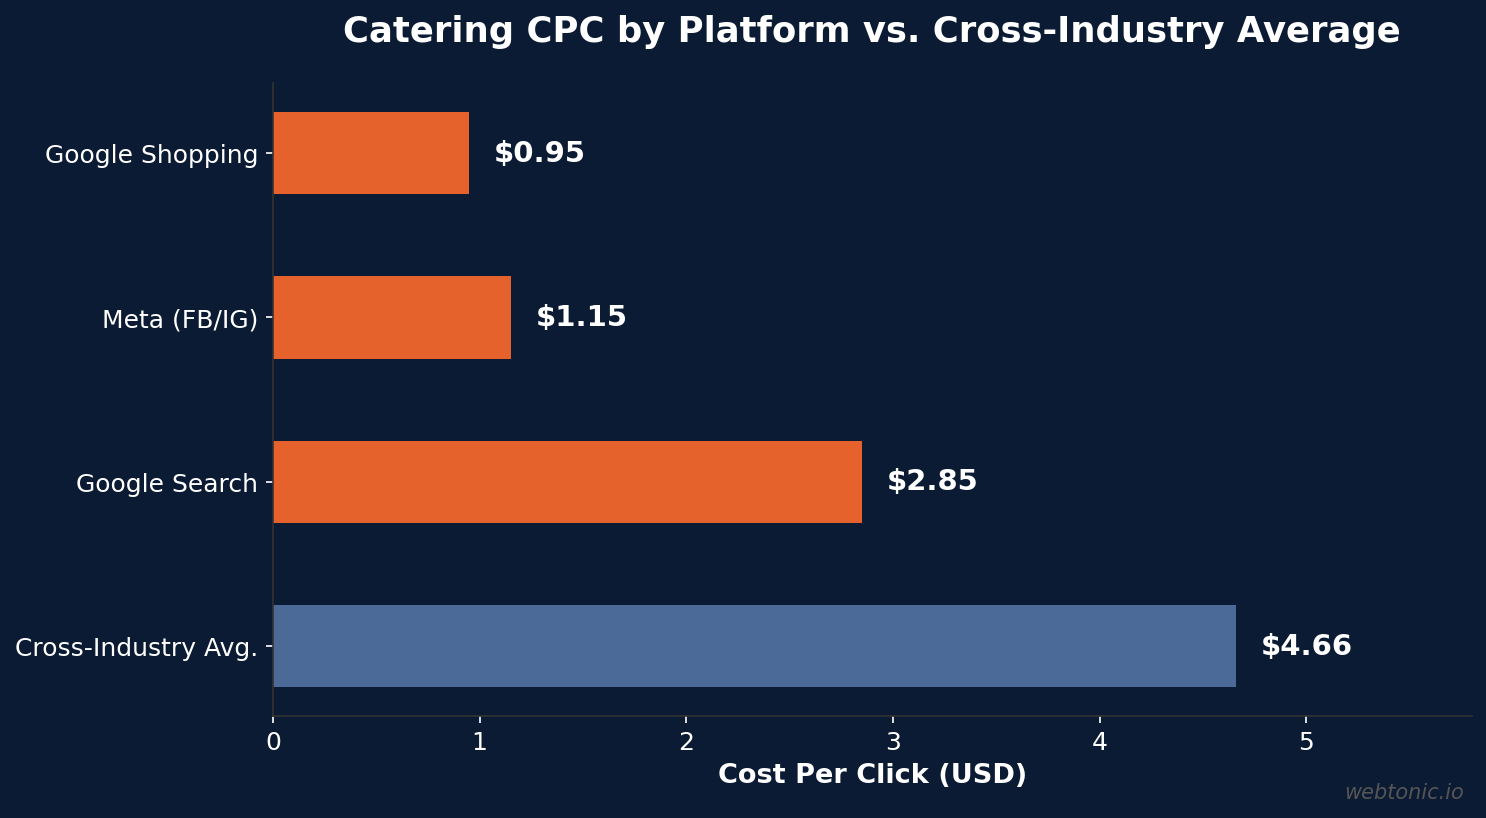
- Google Ads CPC in catering averages $2.85 with a 4.6% conversion rate — below the $4.66 cross-industry average (CuFinder)
- 67% of Gen Z choose restaurants based on social media, making platform-native creative a growth lever (MGH/YPulse)
- Influencer partnerships return $5.20 per $1 spent in the hospitality sector (Influencer Marketing Hub)
- 45% of diners have visited a restaurant after seeing it on Instagram (Toast/Social Media Today)
Ad Creative Benchmarks at a Glance
The table below summarizes the core performance benchmarks for food service and catering ad creative across major paid channels in 2026.
| Metric | Google Ads | Meta (FB/IG) | Industry Note |
|---|---|---|---|
| Average CPC | $2.85 | $1.15 | Below cross-industry avg of $4.66 |
| Conversion Rate | 4.6% | 2.8% | Google search intent drives higher CVR |
| Cost Per Acquisition | $42.50 | $250 (per booking) | Meta CPA higher for full-service catering |
| Click-Through Rate | 5.2% | 1.51% (UGC) | Search intent vs social discovery |
| ROAS | 3.5–5× | 2.57–8× | Wide range tied to creative quality |
Sources: CuFinder Catering Benchmarks 2026, Billo UGC Benchmarks, AI Advantage Agency
Food Photography and Visual Creative Performance
In food service advertising, the image is the first — and often the only — conversion lever. Snappr's consumer research found that viewing food photos is 1.44× more important than reading menu descriptions and 1.38× more important than reviews when ordering from delivery apps. A Limetray study confirmed that menu conversion rates increase by over 25% when images are present, while Grubhub reports 30%+ increases in online orders from restaurants that upload professional photos.
Deliveroo data reinforces the pattern: the majority of online orders go to restaurants with the most photos on their menus, with order rates reaching 24% when 30–40% of menu items are photographed. For catering companies investing in ad creative, the implication is direct — budgeting for professional food photography is one of the highest-ROI creative investments available.
Beyond delivery apps, food photography quality shapes paid social performance. Restaurants posting 4+ times per week on Instagram see 31% more profile visits and 22% more direction requests, according to Later and Sprout Social. The combination of volume and visual quality compounds — more posts with better photos creates a virtuous discovery loop.
Video and Short-Form Ad Creative Statistics
Video has become the dominant format for food service advertising. According to Searchlab's 2026 hospitality marketing report, video posts generate 4.2× more engagement than static images for hospitality brands, a gap that continues to widen as algorithms favor motion content.
TikTok leads the short-form charge for food discovery: restaurant-related content earns 38 billion views annually on the platform, with the "TikTok made me try it" phenomenon driving real foot traffic (TikTok for Business 2026). 67% of Gen Z consumers choose restaurants based on social media content, a statistic from MGH and YPulse that underscores why platform-native video creative — not repurposed TV spots — drives the best results in food service.
The performance advantage extends to paid formats. Billo's food and beverage benchmarks show UGC video ads achieve a 25.47% hook rate, meaning roughly one in four viewers stops scrolling. However, the CTR of 1.51% trails the 1.56% cross-industry average, revealing what Billo calls the "hook-to-click gap": food content earns attention with a sensory promise but can lose it if the transition to a product pitch feels abrupt.
User-Generated Content vs. Studio Creative
The economics of UGC creative for food service brands are compelling. Billo's 2026 analysis found that food and beverage UGC delivers a 2.57 ROAS on average, rising to 3.07 during December when holiday hosting and food gifting peak. The biggest conversion window for food brands is not Black Friday — it is the two weeks before Christmas.
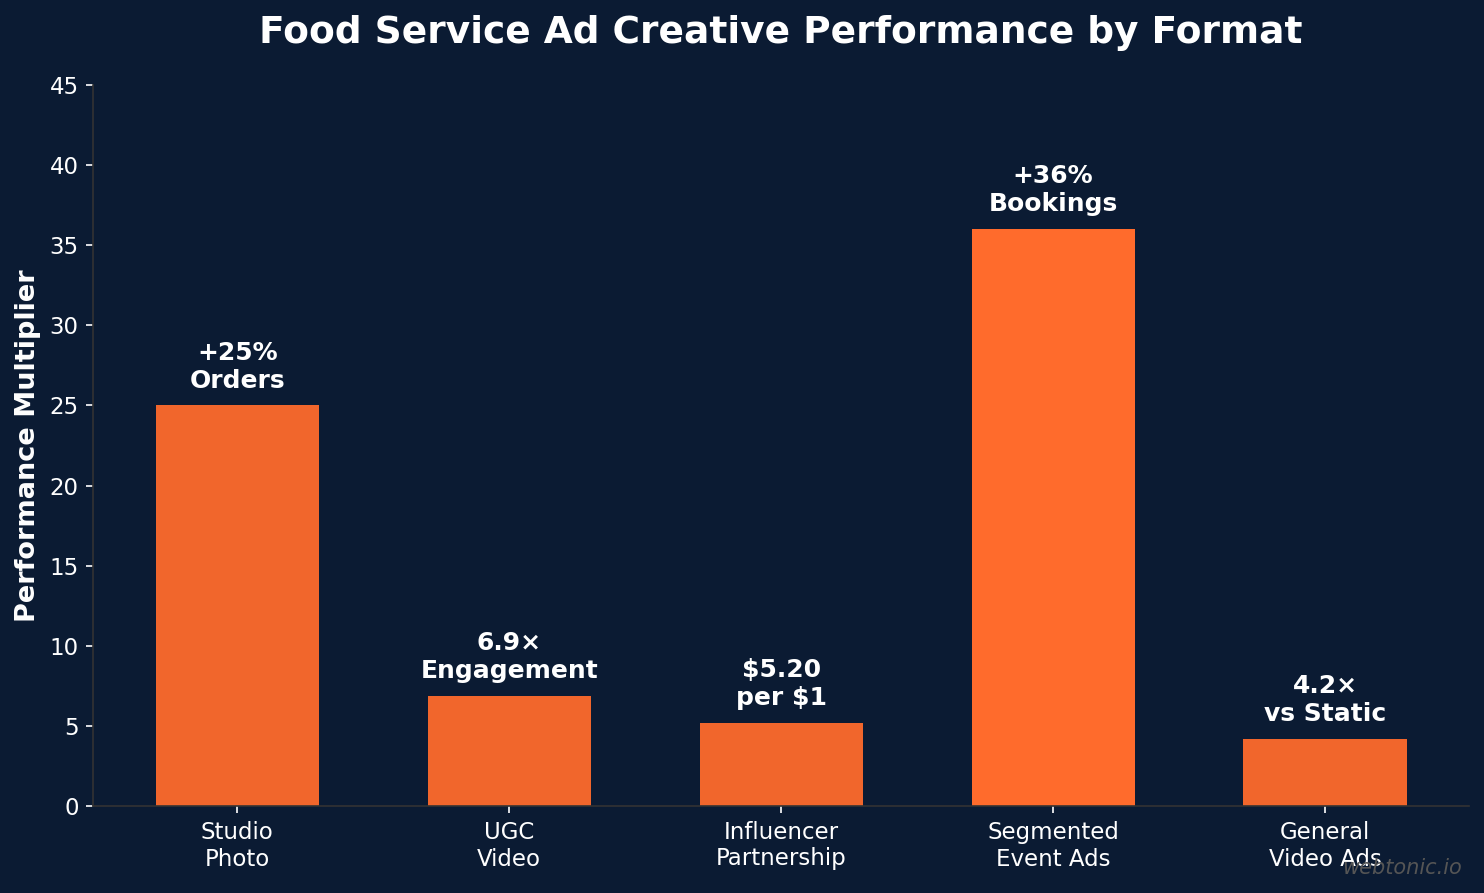
User-generated content generates 6.9× higher engagement than brand-created content for restaurants, according to Stackla and Nosto. The reason is what Billo describes as the "taste gap": no ad can make someone taste something, but a creator's genuine first reaction to opening and tasting a product activates viewer imagination in a way that polished studio shots cannot.
That said, studio and UGC creative serve different roles in the funnel. Professional photography dominates for menu presentation and Google Ads display campaigns, while UGC video outperforms for social media discovery and retargeting. Smart food service advertisers allocate budget to both.
Platform-by-Platform Ad Creative Performance
| Platform | Key Creative Stat | Best Format | Source |
|---|---|---|---|
| 45% of diners visited after discovery | Carousel + Reels | Toast / Social Media Today | |
| TikTok | 38B annual restaurant views | Short-form UGC (<30s) | TikTok for Business 2026 |
| $1.15 CPC, 2.8% CVR | Video + lead forms | CuFinder 2026 | |
| Google Search | $2.85 CPC, 5.2% CTR | RSAs with local extensions | CuFinder 2026 |
| Google Shopping | $0.95 CPC | Product feed (meal kits) | CuFinder 2026 |
Instagram remains the top platform for food service discovery, with 84% of hospitality businesses maintaining an active presence (Social Media Today 2026). Meanwhile, influencer partnerships deliver $5.20 for every $1 spent in hospitality, making creator collaborations a cost-effective supplement to traditional ad buys (Influencer Marketing Hub 2026).
Catering-Specific Ad Creative Case Study Data
One of the most detailed catering ad performance studies comes from AI Advantage Agency, which documented a 4-month Meta Ads campaign for an event catering company. The results set a useful benchmark for the industry:
- $4,000 total ad spend produced $32,000 in confirmed bookings — an 8× ROAS
- Monthly bookings increased from 12 to 16, a 36% lift sustained even during historically slow months
- Cost per booking averaged $250, which compares favorably to the industry's blended CPA of $42.50 for leads (CuFinder) given that these were full-service catering events
- Separate creative for corporate, wedding, and private events outperformed undifferentiated campaigns
- Dedicated landing pages per service type and daily optimization against confirmed bookings (not clicks or leads) drove the sustained performance
The study highlights a principle that generalizes across food service growth marketing: creative segmented by event type — each with tailored visuals, messaging, and landing pages — consistently outperforms one-size-fits-all campaigns.
Creative Format ROI Comparison
| Creative Format | Avg. Engagement Lift | Avg. ROAS | Best Use Case |
|---|---|---|---|
| Professional Food Photography | +25–35% orders | 3.5–5× | Menu listings, Google Ads, delivery apps |
| UGC Video (Short-Form) | 6.9× vs brand content | 2.57× | Social discovery, retargeting |
| Influencer Partnership | $5.20 per $1 spent | 5.2× | Brand awareness, new audience reach |
| Segmented Event Creative | +36% bookings | 8× | Catering lead gen (Meta Ads) |
| Video Ads (General) | 4.2× vs static | 2.5–4× | Awareness, consideration |
Ad Creative Best Practices for Food Service and Catering
- Lead with food — not logos. Snappr data shows photos are 1.44× more important than descriptions. Make the food the hero of every ad.
- Invest in professional photography for paid search. Google Ads with high-quality images in Performance Max and Shopping campaigns see higher CTR and lower CPA.
- Use UGC for social discovery. The 6.9× engagement advantage of user-generated content means organic-looking creator videos outperform polished brand spots on Instagram and TikTok.
- Segment creative by event type. AI Advantage Agency's 8× ROAS came from building separate creative, audiences, and landing pages for corporate, wedding, and private events.
- Close the hook-to-click gap. Food content earns attention easily (25.47% hook rate), but converting that attention requires a smooth transition from sensory appeal to clear action — avoid abrupt product pitches.
- Leverage seasonal peaks. December delivers the highest food UGC ROAS (3.07×), driven by holiday hosting and gifting. Plan creative refreshes for Q4.
- Post consistently on Instagram. Restaurants posting 4+ times weekly see 31% more profile visits. For catering brands, this means a steady cadence of event photos, behind-the-scenes prep, and client testimonials.
- Test video first for awareness. With 4.2× engagement vs static and 38B annual TikTok views for restaurant content, short-form video should be the default format for top-of-funnel paid social campaigns.
Food Service Ad Creative vs. Other Industries
| Metric | Food Service / Catering | Cross-Industry Avg. | Difference |
|---|---|---|---|
| Google Ads CPC | $2.85 | $4.66 | −39% (lower cost) |
| Google Ads CVR | 4.6% | 4.4% | +5% above average |
| UGC Hook Rate | 25.47% | 24.42% | +4% above average |
| UGC CTR | 1.51% | 1.56% | −3% below average |
| UGC ROAS | 2.57 | 2.45 | +5% above average |
| Influencer ROI | $5.20 per $1 | $4.87 per $1 | +7% above average |
Food service advertising benefits from a natural creative advantage: food is inherently visual and emotionally appealing. This explains the above-average hook rates and influencer ROI, while the slightly lower CTR reflects the challenge of converting sensory attention into commercial action.
Related reading
- Video Marketing in Food Service & Catering: 2026 Statistics & Benchmarks
- The Complete Food Service & Catering Branding Statistics Report (2026)
- How Ad Creative Performs in Beauty & Skincare: 2026 Data & Benchmarks
- Branding services at Web Tonic
FAQ
What type of ad creative works best for catering companies?
Segmented creative by event type delivers the strongest results. A documented case study showed 8× ROAS when corporate, wedding, and private event campaigns each had dedicated visuals, messaging, and landing pages. For social channels, UGC video outperforms studio-produced content by 6.9× in engagement, while professional food photography remains essential for Google Ads and delivery-app listings.
How much does food service advertising cost per click?
Google Ads CPC for catering averages $2.85, which is 39% below the cross-industry average of $4.66. Facebook and Instagram CPC averages $1.15, with conversion rates of 2.8% on Meta platforms. Cost per acquisition (CPA) for catering leads runs approximately $42.50, though full-service event bookings through Meta Ads can cost around $250 per confirmed booking.
Does professional food photography actually increase sales?
Yes — the data is strong. High-quality food photos increase delivery-app orders by 35% and menu conversion rates by over 25%, according to Snappr and Limetray. Consumers rate food photos 1.44× more important than menu descriptions when making ordering decisions. Deliveroo's data shows that restaurants with the most menu photos receive the largest share of online orders.
What social media platform drives the most results for food service advertising?
Instagram leads for food service discovery, with 45% of diners having visited a restaurant after seeing it on the platform. TikTok is the fastest-growing channel, generating 38 billion restaurant-related views annually. For paid advertising, Meta Ads (Facebook and Instagram) offer the most cost-effective CPC at $1.15, while Google Ads delivers higher intent with a 5.2% CTR.
How does UGC compare to brand-produced content for food brands?
UGC outperforms brand content by 6.9× in engagement for restaurants, according to Stackla and Nosto. The key advantage is authenticity: creator reactions to food products close what Billo calls the "taste gap" — they create a vicarious sensory experience that studio shots cannot replicate. However, UGC ROAS (2.57×) can vary significantly by season, peaking at 3.07× in December and dipping during slower months.
Sources
CuFinder — Catering Industry Marketing Benchmarks 2026
AI Advantage Agency — Catering Meta Ads Case Study
Snappr — Food Photos Increase Orders by 35%
Billo — UGC for Food & Beverage Brands 2026
Searchlab — Hospitality Marketing Statistics 2026
Restroworks — Restaurant Social Media Statistics 2025
Datassential — Foodservice Industry Trends 2026


