Table of contents
64% of healthcare marketers struggle to prove ROI to leadership (Freshpaint), and fertility clinics face additional reporting complexity: 30–40% of IVF patients drop off between consultation and first cycle (Meddilink). Without real-time dashboards tracking every stage of the patient journey, those leaks remain invisible. Here are the statistics defining how fertility clinics approach marketing dashboards and reporting in 2026.
Key Takeaways
- 64% of healthcare marketers cannot prove marketing ROI to leadership, making dashboards a visibility lifeline for fertility clinics (Freshpaint 2026).
- 30–40% of IVF patients drop off between consultation and first treatment cycle, creating a critical reporting blind spot that dashboards must track (Meddilink).
- Fertility clinics tracking 4 core KPIs — new patient volume, IVF conversion rate, patient satisfaction, and compliance rate — see measurable improvements in cycle volume (Fertility Bridge).
- Google Ads campaigns for fertility average a 6.8% conversion rate at $112 CPA, requiring cost-per-consultation dashboards to optimize spend (Benchmarketing 2026).
- Top-performing clinics achieve 8.2× ROAS when Google Ads and SEO data are tracked through unified marketing dashboards over sustained periods (Tandem Medical).
- Only 9% of healthcare organizations integrate call center data into dashboards, despite phone calls driving 60%+ of fertility consultations (Freshpaint 2026).
- Real-time dashboard adoption in healthcare grew 34% year-over-year as organizations move from monthly to weekly or daily reporting cycles (Macbach 2026).
Core KPIs Every Fertility Dashboard Must Track
Fertility Bridge identifies four key performance indicators that directly predict IVF cycle volume. Clinics that track all four in real-time dashboards can identify drop-off points and intervene before patients churn.
| KPI | What It Measures | Why It Matters |
|---|---|---|
| New Patient Volume | Monthly new consultations booked | Top-of-funnel health; flags marketing or referral declines |
| IVF Conversion Rate | % of consultations → treatment starts | 30–40% drop off here — highest-leverage KPI |
| Patient Satisfaction Score | NPS or post-visit rating | Drives referrals; 83% require 4+ stars before choosing a clinic |
| Treatment Compliance Rate | % completing recommended protocol | Retention signal; affects lifetime value |
Marketing Channel Benchmarks for Fertility Dashboards
A fertility marketing dashboard needs clear benchmarks against which to evaluate campaign performance. These numbers from Benchmarketing 2026 and other sources represent the current industry standard.
| Channel / Metric | Benchmark | Dashboard Alert Threshold |
|---|---|---|
| Google Ads CTR | 5.28% | Flag below 3.5% |
| Google Ads CPC | $9.84 | Flag above $14.00 |
| Google Ads CVR | 6.8% | Flag below 4.0% |
| Google Ads CPA | $112 | Flag above $160 |
| Meta Ads CTR | 1.72% | Flag below 1.0% |
| Meta Ads ROAS | 2.8× | Flag below 1.8× |
| Email Open Rate | 22–26% | Flag below 18% |
| Organic CVR | 3–8% | Flag below 2.5% |
Sources: Benchmarketing 2026, Authority Specialist, Macbach 2026
Patient Journey Funnel Metrics
The fertility patient funnel has more stages and longer cycle times than most healthcare verticals. Dashboards that track each stage expose the exact points where patients leak out — and where marketing or operational changes will have the highest impact.
- 30–40% patient drop-off between consult and first cycle — the single largest funnel leak in fertility marketing. Five blind spots drive it: delayed follow-up, unclear financial communication, missing emotional support, poor schedule coordination, and gaps in cycle-completion outreach (Meddilink).
- 60–75% of patient journeys begin with informational searches, meaning dashboards must track awareness-stage content performance alongside bottom-funnel conversions (Authority Specialist).
- 40–50% of initial organic visits result in a bounce if content doesn't address the patient's specific treatment concern within the first scroll (Authority Specialist).
- LIV Fertility grew from 35 to 120 leads/month by implementing funnel tracking across GA4, call tracking, form submissions, and WhatsApp inquiries in a unified dashboard (Tandem Medical).
- Patients spend 3–6 months in the research phase before booking a consultation, focusing heavily on success rates and procedure details — dashboard reporting windows must be long enough to capture this extended consideration period (Authority Specialist).
- ICG's MIS dashboard provides actual funnel conversion data from active IVF campaigns — operational data showing Google Ads at 12.16% conversion rate vs. Meta at 1.36% from lead to qualified consultation (ICG).

Fertility-Specific Dashboard Platforms in 2026
Specialized platforms now offer real-time marketing and clinical dashboards designed specifically for fertility and IVF practices. These tools bridge the gap between marketing attribution and clinical outcomes that general marketing dashboards miss.
- eIVF Fertility Vision provides real-time clinical, financial, and patient outcome dashboards including revenue trends, patient billing metrics, and payer mix breakdowns (eIVF).
- Vitrify CRM tracks lead-to-appointment journeys with live KPIs, lab analytics, and ROI calculations per ad platform — all in a single dashboard (Vitrify).
- MedART (Meddilink) updates clinical KPIs continuously as data is entered — no exports or BI consultants required. Clinical directors see performance by physician, protocol, and patient group (Meddilink).
- Irresist maps marketing spend to patient movement layers — lead, booked consultation, attended consultation, and treatment start — with attribution visibility at every stage (Irresist).
- Freshpaint Insights offers cross-channel CAC, CPA, and CTR tracking designed for HIPAA compliance, with automatic performance updates as campaigns run (Freshpaint).
Healthcare Dashboard Maturity Model
Where does your fertility clinic's reporting stack sit? Improvado's 2026 framework defines three attribution maturity stages that directly correlate with reporting sophistication.
| Stage | Capabilities | Accuracy | Annual Investment |
|---|---|---|---|
| Stage 1: Digital-Only | Web analytics + ad platform data | 30–50% visibility | $5K–$20K/year |
| Stage 2: Multi-Touch | CRM integration + call tracking + UTM | 60–70% visibility | $50K–$150K/year |
| Stage 3: Omnichannel + EMR | Full cross-channel + EMR revenue matching | 75–85% visibility | $150K–$500K/year |
Budget Allocation Insights from Dashboard Data
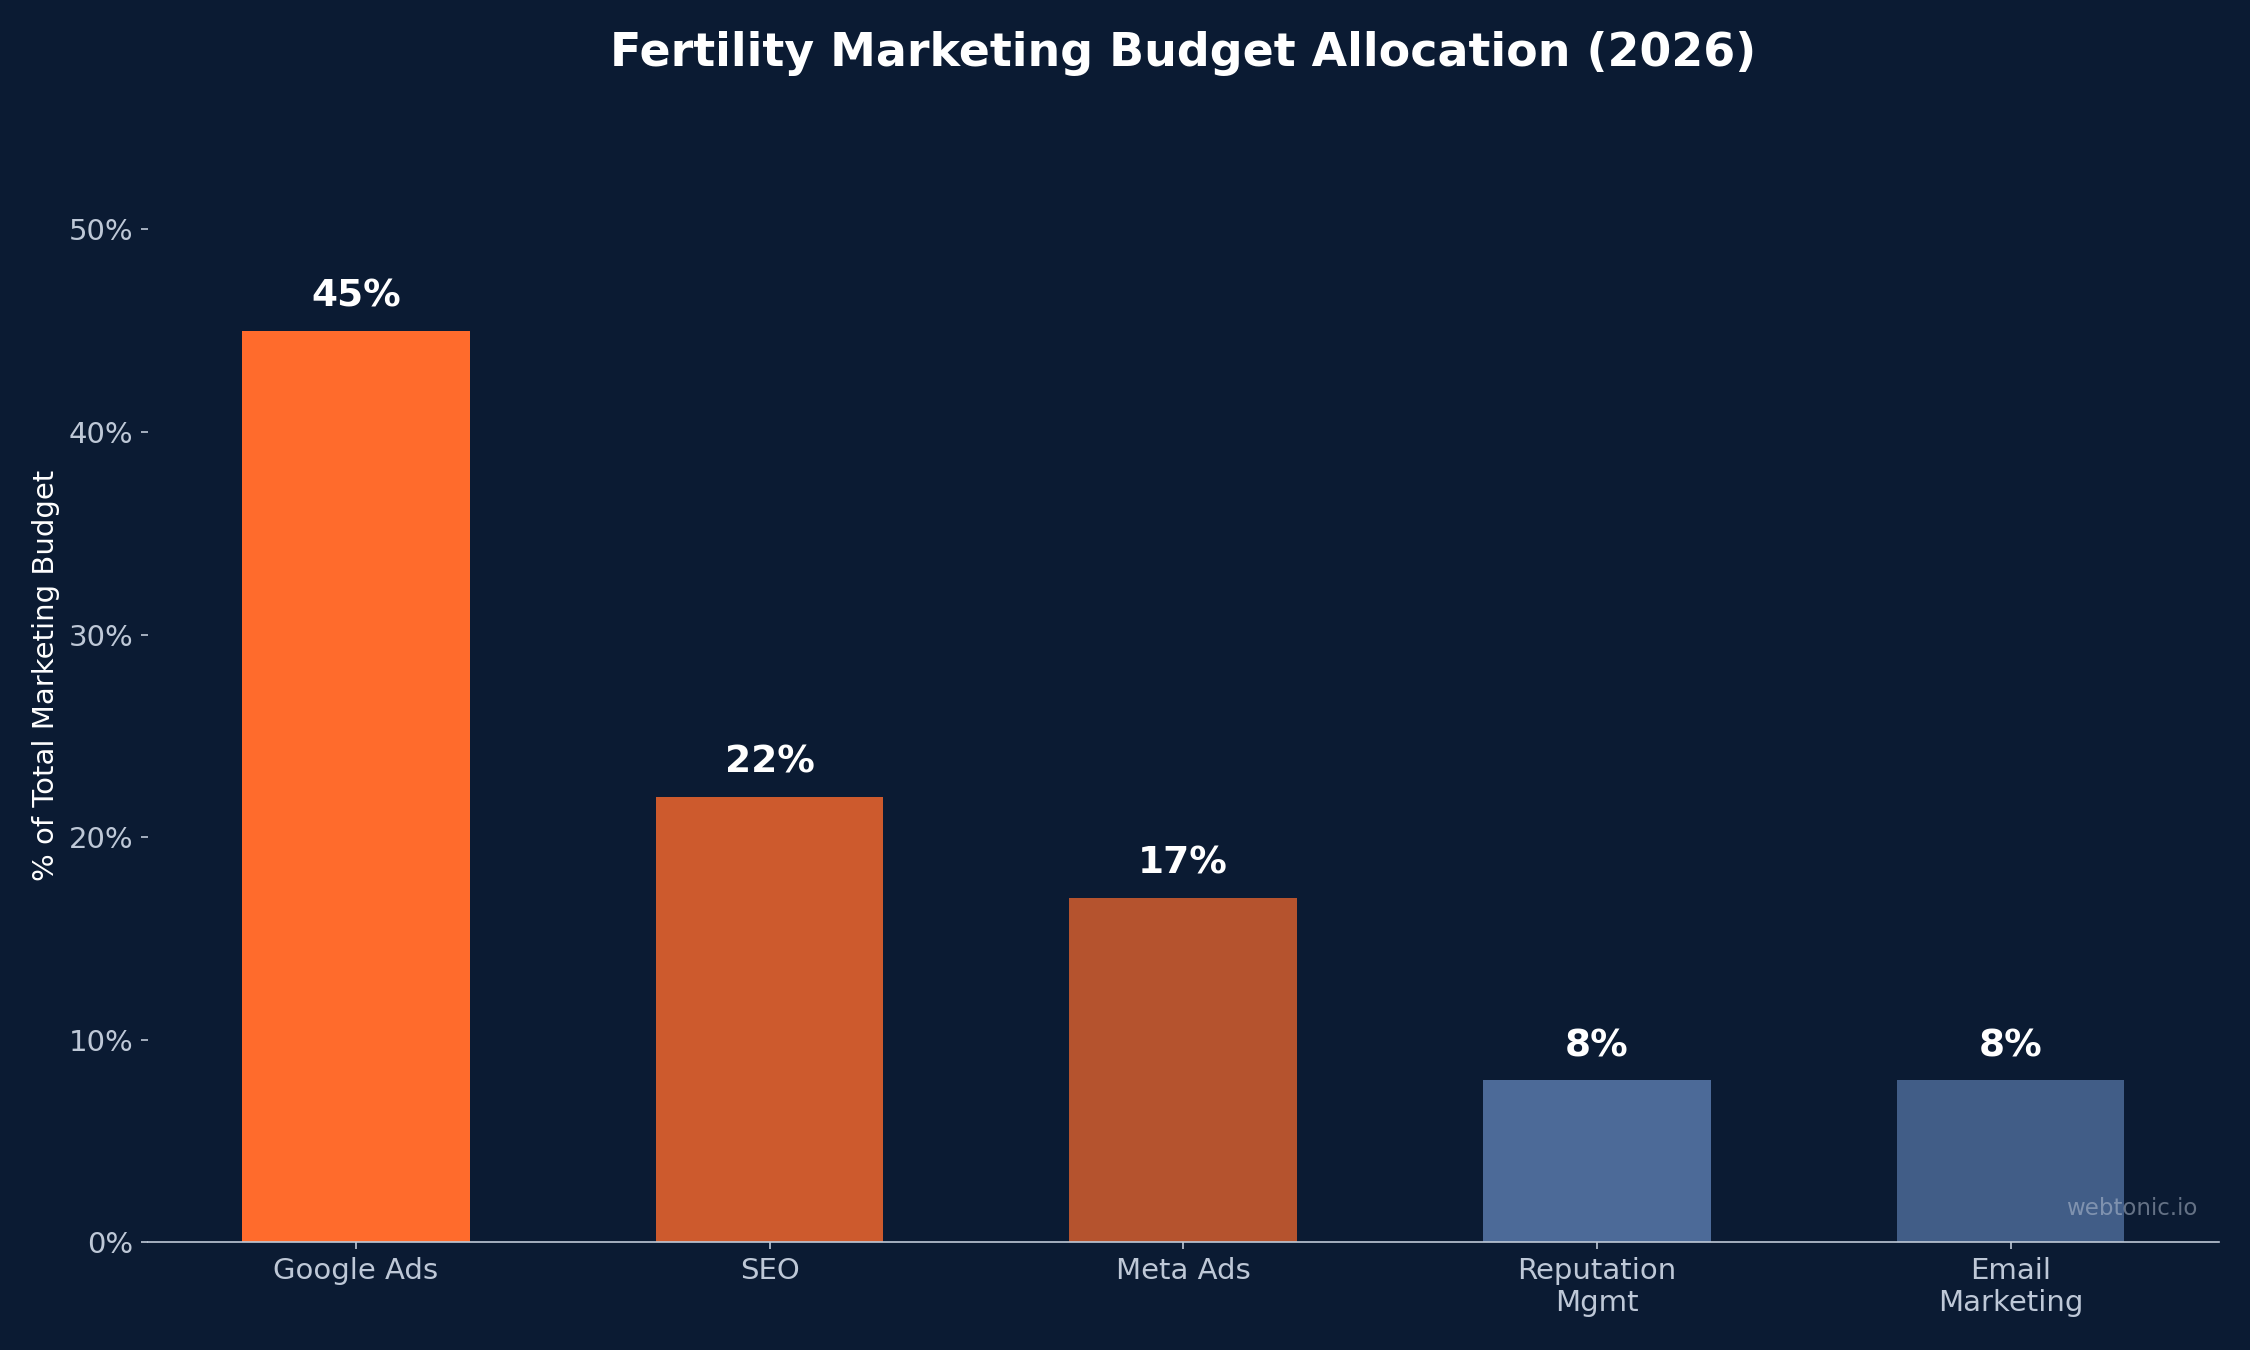
Fertility clinic dashboards reveal clear patterns in where marketing budgets deliver the highest return. Tandem Medical's 2026 playbook provides benchmark allocations for mid-size competitive-metro clinics.
- Recommended budget: $8,000–$20,000/month for a mid-size clinic with 3–6 reproductive endocrinologists (Tandem Medical).
- Google Ads: 40–50% of budget — the highest-intent channel with $112 average CPA (Benchmarketing 2026).
- SEO: 20–25% — compounds over time; clinics with 12+ months of sustained SEO investment see organic traffic outperform paid in consultation volume.
- Meta Ads: 15–20% — generates 45% of IVF digital conversions by volume at a 2.8× ROAS, primarily reaching patients earlier in the decision journey (ICG).
- Reputation management: 5–10% — 83% of patients require 4+ star ratings before choosing a fertility clinic, making review monitoring a dashboard essential (Benchmarketing).
Clinical Reporting and Compliance Dashboards
Fertility clinics face unique reporting obligations beyond marketing — SART (Society for Assisted Reproductive Technology) reporting, CARTR, and ANZARD require structured data submission. Modern platforms unify these clinical reports with marketing data.
| Report Type | Frequency | Key Metrics | Platform Examples |
|---|---|---|---|
| SART Prospective | Ongoing | Cycle outcomes by protocol, patient demographics | FertilityPro, eIVF |
| SART Annual | Yearly | Success rates, patient counts, pregnancy outcomes | FertilityPro, eIVF |
| Marketing ROI | Weekly/Monthly | CPA, ROAS, CPL by channel, funnel conversion rates | Freshpaint, Vitrify, Irresist |
| Lab KPIs | Continuous | Embryo quality, fertilization rates, lab throughput | Vitrify, MedART |
Best Practices for Fertility Clinic Dashboard Implementation
- Start with the consult-to-treatment funnel — the 30–40% drop-off rate between consultation and first cycle is the single highest-leverage metric to dashboard. Tracking this weekly reveals whether operational changes (faster follow-up, clearer financial communication) are actually reducing churn.
- Integrate call data into marketing dashboards — only 9% of healthcare organizations do this despite phone calls driving the majority of fertility consultations. Call tracking data should feed into the same dashboard view as web conversions for a complete picture.
- Set automated alert thresholds — configure dashboards to flag when Google Ads CPA exceeds $160 (43% above the $112 benchmark), Meta ROAS drops below 1.8× (35% below the 2.8× benchmark), or weekly lead volume drops more than 25% week-over-week.
- Report on cost-per-qualified-lead, not just CPL — a Delhi IVF chain reduced costs by 44% in 90 days by shifting dashboards from raw CPL to qualified-lead-first tracking that filtered unqualified inquiries before they entered ROI calculations (ICG).
- Build separate views for marketing and clinical leadership — marketing teams need channel-level CPA and ROAS; clinical directors need cycle volume, conversion rates, and protocol effectiveness. Both perspectives should share the same underlying patient data.
- Use weekly review cadence at minimum — monthly reporting misses actionable trends. Healthcare organizations moving to weekly or daily reporting cycles grew 34% year-over-year in real-time dashboard adoption (Macbach 2026).
Data Integration Challenges for Fertility Dashboards
Connecting marketing data to clinical outcomes remains the biggest technical hurdle for fertility clinic dashboards. These are the integration challenges that most commonly derail dashboard accuracy.
- EMR system fragmentation — many fertility clinics use specialized EMR systems (eIVF, FertilityPro) that do not natively export marketing-relevant data. Building integrations requires custom API development or middleware, typically at $15,000–$50,000 implementation cost.
- HIPAA data isolation — patient health information cannot flow freely between marketing and clinical systems. Dashboards must use de-identified aggregate data for marketing KPIs while maintaining patient-level detail on the clinical side behind proper access controls.
- Multi-location data consolidation — fertility clinic networks with multiple offices need dashboards that roll up location-level data while allowing drill-down. This is where platforms like Vitrify differentiate by offering per-branch performance comparison within a single dashboard view.
- Offline conversion lag — the gap between a marketing-generated lead and an actual treatment start can be 3–6 months. Dashboards that only report on immediate conversions miss the true ROI of campaigns that filled the consultation pipeline months earlier.
- Channel deduplication — without proper deduplication, fertility clinics commonly double-count 20–30% of conversions when they sum Google, Meta, and organic reports. Dashboard platforms like Freshpaint Insights address this with cross-channel deduplication logic.
Frequently Asked Questions
What KPIs should a fertility clinic dashboard track?
At minimum, track new patient volume, IVF conversion rate (consultations to treatment starts), patient satisfaction score, and treatment compliance rate. On the marketing side, monitor CPA, ROAS, and cost per qualified lead by channel, with benchmarks like $112 CPA for Google Ads and 2.8× ROAS for Meta Ads.
Why do 30–40% of IVF patients drop off before starting treatment?
Five operational blind spots drive consult-to-treatment drop-off: delayed follow-up after initial consultation, unclear financial communication about cycle costs, missing emotional support resources, poor schedule coordination, and gaps in post-cycle outreach. Real-time funnel dashboards can flag each of these drop-off points.
How much should a fertility clinic spend on dashboards and reporting tools?
Most fertility clinics start with Stage 1 digital-only reporting at $5,000–$20,000 per year. Multi-touch dashboards with CRM integration run $50,000–$150,000 annually. Full omnichannel attribution with EMR integration costs $150,000–$500,000 per year but delivers 75–85% spend-to-outcome visibility.
What is the ROI of real-time marketing dashboards for IVF clinics?
Top-performing clinics using unified dashboards achieve 8.2× ROAS from combined Google Ads and SEO strategies. LIV Fertility Center grew from 35 to 120 qualified leads per month after implementing comprehensive funnel tracking with real-time dashboards, representing a 243% increase in lead volume.
Sources
Freshpaint — State of Healthcare Marketing 2026
Meddilink — 5 Blind Spots Causing IVF Patient Drop-Off
Fertility Bridge — 4 KPIs That Affect IVF Volume
Benchmarketing — Fertility Clinics Benchmarks 2026
Tandem Medical — IVF Marketing 2026 Playbook
Improvado — Healthcare Marketing Attribution Guide 2026
ICG — IVF Google Ads vs Meta Ads Data
Authority Specialist — IVF Clinic SEO Benchmarks 2026
Macbach — Healthcare Marketing Benchmarks 2026