



Table of contents

WordPress powers 33% of the measurable web and its WooCommerce plugin drives 4.15 million live e-commerce stores — more than any competing platform by raw count. Below are the most important WordPress and WooCommerce statistics for online retailers and digital marketers in 2026.
Key Takeaways
- 4,151,703 live WooCommerce stores are active globally as of mid-2026, though the count has declined 8% year-over-year (Store Leads).
- WooCommerce holds 20–39% of the global e-commerce market depending on measurement scope — from 23% of the top 1M sites to 39% of all detected stores (Colorlib).
- WordPress powers 33.21% of all measurable web origins, down from ~36% at peak, but still 7× larger than Shopify at 4.74% (GravityKit).
- $30–35 billion in annual GMV flows through WooCommerce stores worldwide, with a median store revenue of $63,000 (Peligent).
- 344 million+ total downloads and 6.3 million active WordPress installs make WooCommerce the most-downloaded e-commerce plugin ever (Colorlib).
- 72% of WooCommerce orders are now placed on mobile devices, though desktop AOV remains 2.3× higher (Metorik).
WooCommerce Store Count and Growth Trends
WooCommerce remains the most widely installed e-commerce platform by store count — 4,151,703 live stores as of mid-2026 (Store Leads). However, the growth trajectory has reversed: stores declined 8% year-over-year and -1.7% quarter-over-quarter in Q2 2026. This represents a notable shift from the expansion phase, with net migration data showing approximately 2,895 stores leaving WooCommerce every 9 days — primarily moving to Shopify and custom-built solutions (EcommerceViews).
The broader WordPress ecosystem tells a more nuanced story. ShopRank's June 2026 data identifies 4,883,525 WordPress e-commerce stores total, with WooCommerce commanding 97.6% share of that segment. Over the past 12 months, 565,402 new WordPress stores were launched — averaging 47,117 per month — indicating that while churn is rising, new store creation remains substantial (ShopRank).
| Period | Live WooCommerce Stores | QoQ Change |
|---|---|---|
| 2025 Q1 | 4,601,177 | — |
| 2025 Q2 | 4,602,082 | +0.02% |
| 2025 Q3 | 4,503,868 | -2.1% |
| 2025 Q4 | 4,467,000 | -0.8% |
| 2026 Q1 | 4,076,168 | -8.8% |
| 2026 Q2 | 4,224,869 | +3.6% |
| 2026 Q3 (to date) | 4,151,703 | -1.7% |
WordPress and WooCommerce Market Share
The market share picture for WooCommerce depends heavily on how you measure. In the broadest view, WooCommerce powers 39% of all detected e-commerce sites (Colorlib). Among the top one million e-commerce sites, that share drops to 23% — behind Shopify's 27%. WordPress itself (the content management system) commands 33.21% of all measurable web origins in the April 2026 HTTP Archive crawl, though this represents a -0.93 percentage-point year-over-year decline (GravityKit).
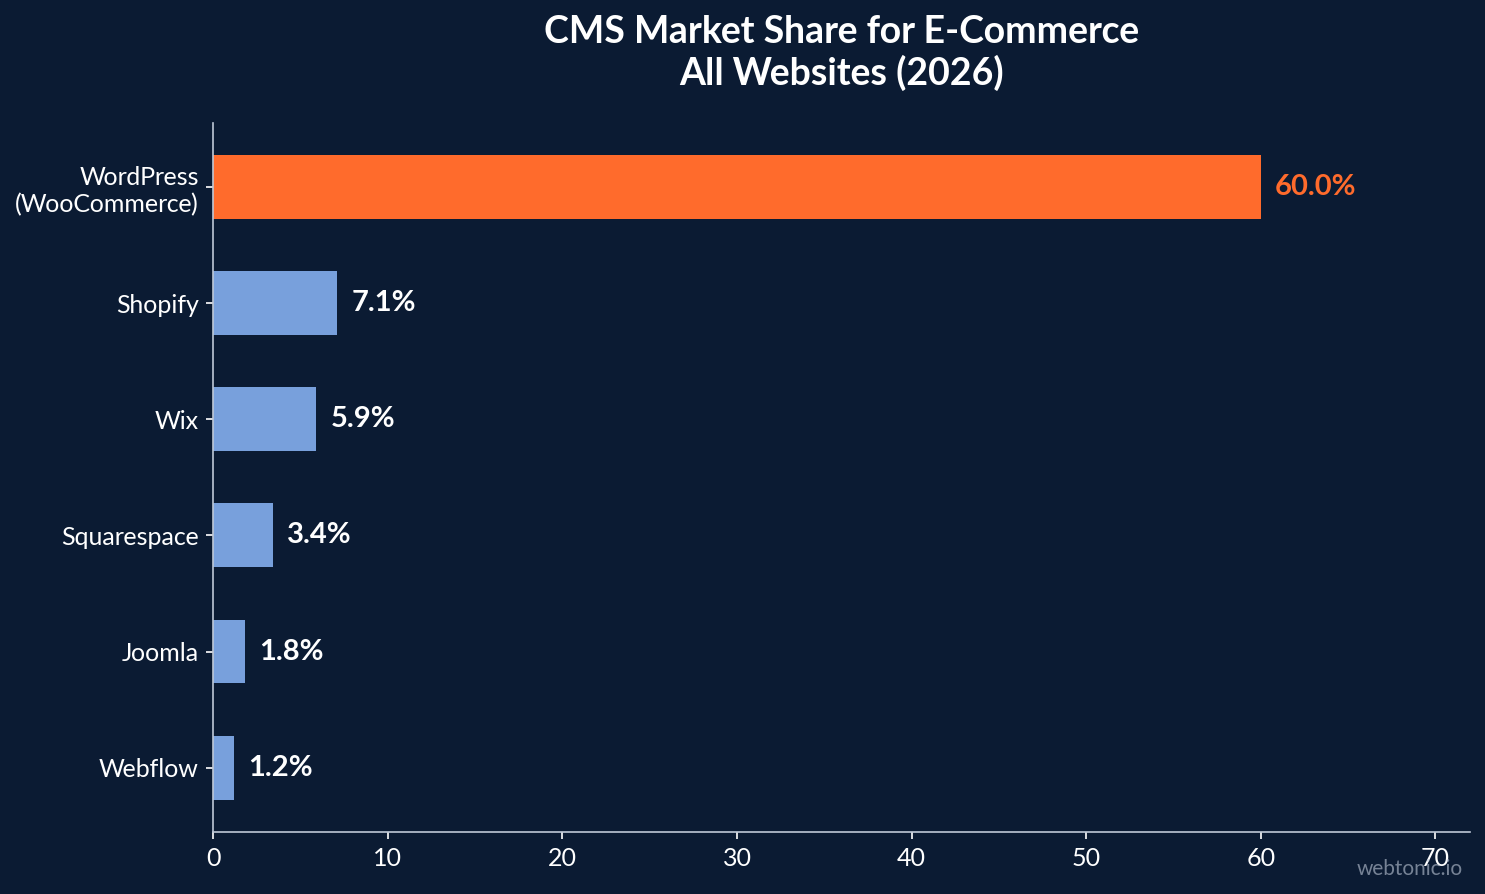
StoreCensus places WordPress (WooCommerce) at 60% CMS market share — down from 62% a year earlier — while Shopify rose to 7.1% and Wix jumped to 5.9% (StoreCensus). The migration pattern is clear: WooCommerce's year-over-year store count declined -3.2%, while Shopify grew +8.2% — reflecting a broader market shift from self-hosted flexibility toward managed SaaS simplicity (EcommerceViews).
Older platforms continue to lose ground as well. Joomla dropped from 2.2% to 1.8% and Adobe Commerce (Magento) slipped from 1.2% to 1.0%. Meanwhile, headless CMS architectures and composable commerce solutions are gaining traction among enterprise retailers who need the flexibility of custom frontends while leveraging established backend infrastructure. Webflow — an increasingly popular option for design-led brands — grew to 1.2% market share, doubling its footprint in two years.
Revenue, Conversion, and Performance Metrics
WooCommerce stores collectively process $30–35 billion in annual GMV, with median annual revenue per store of $63,000 (Peligent). The top 10% of stores generate $500,000+ annually, and 12,600+ stores earn $100K+ per year. Average transaction value sits at $67.50, with monthly transactions averaging 1,450 per store.
Metorik's 2026 Insights Report — built from 65 million orders and $6.6 billion in revenue across 6,000+ stores — provides the most granular conversion data. The average WooCommerce order value is $105, though this drops 18% on weekends. 72% of orders are placed on mobile, but desktop AOV remains 2.3× higher — a gap that underscores the importance of mobile checkout optimization for growth-focused retailers.
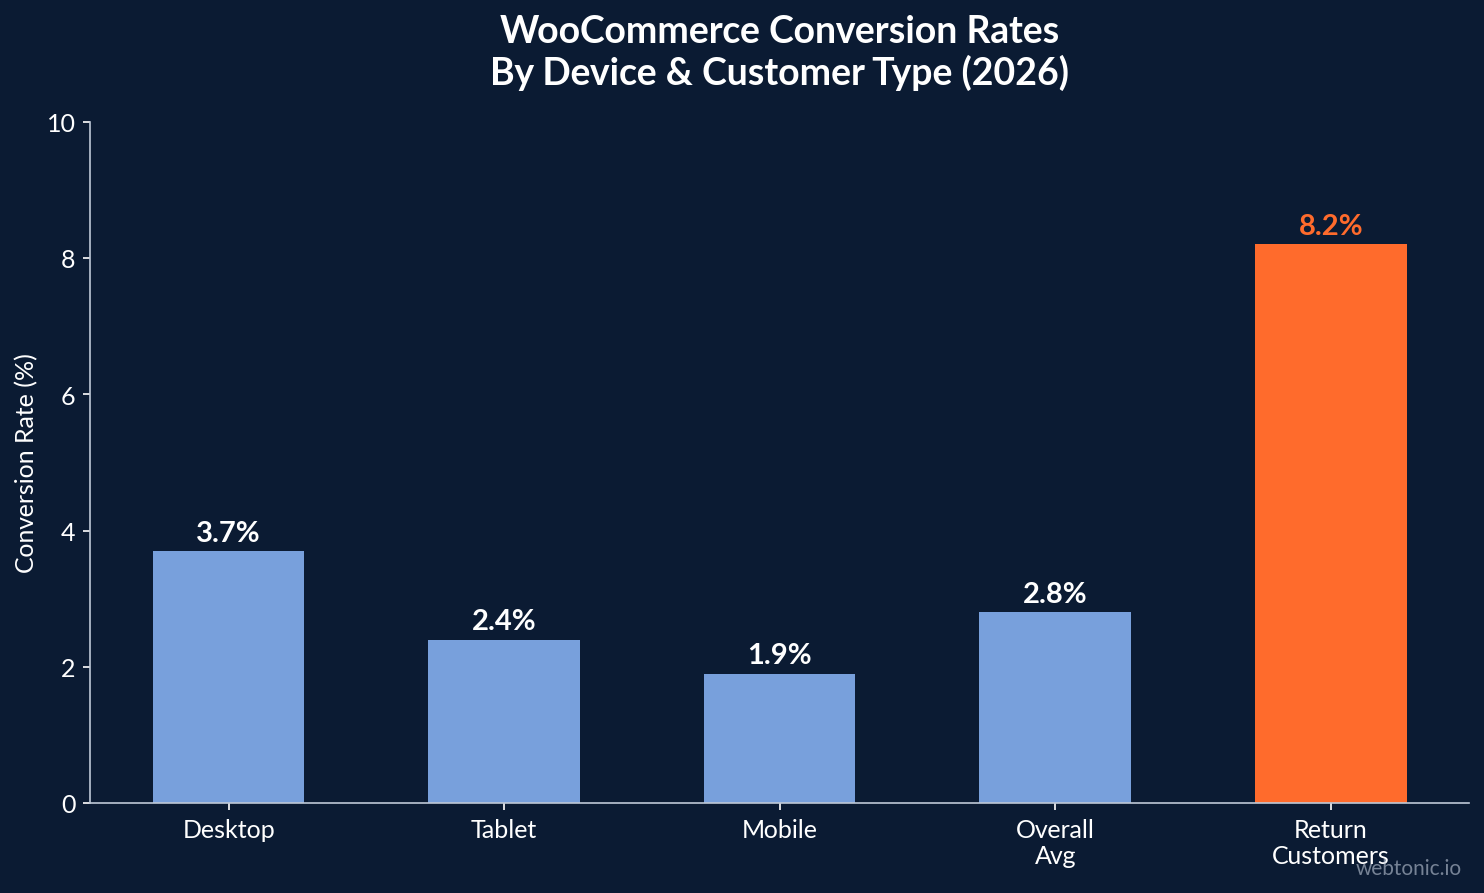
Conversion rates by device tell a critical story: desktop converts at 3.7%, tablets at 2.4%, and mobile at just 1.9% — with an overall average of 2.8%. Top-performing stores achieve 5.5%+ conversion rates, while return customers convert at 8.2% (Peligent). Refund rates have nearly halved since 2023, dropping from 2.4% to 1.4% in 2025 (Metorik).
| Metric | Value | Source |
|---|---|---|
| Average conversion rate | 2.8% | Peligent |
| Desktop conversion rate | 3.7% | Peligent |
| Mobile conversion rate | 1.9% | Peligent |
| Return customer CVR | 8.2% | Peligent |
| Average order value | $105 | Metorik |
| Median revenue/store | $63,000/yr | Peligent |
| Annual GMV (all stores) | $30–35B | WooCommerce |
| Refund rate | 1.4% | Metorik |
Plugin Ecosystem and Theme Landscape
The average WooCommerce store runs 58 active plugins — a number that has remained remarkably stable since 2023 (Metorik). Larger stores (over $1M revenue) average 66 plugins, reflecting greater operational complexity. The WooCommerce Marketplace offers 800+ official extensions, with an additional 6,000+ third-party extensions available through WordPress.org (Colorlib).
The most popular WooCommerce plugin is Stripe Gateway (40% of stores), followed by Yoast SEO (49% of all WordPress plugins). For payment gateways, PayPal leads at 48%, with MasterCard at 14.7% and Stripe Connect at 13.7% (ShopRank).
The theme landscape has shifted dramatically. WooCommerce's own Storefront theme has fallen to just 0.8% market share — now at the bottom of the top 10. Page builders dominate: Elementor (9.3%), Flatsome (7.4%), and Woodmart (4.5%) lead the market. This signals that store owners prioritize visual customization and drag-and-drop design over WordPress's default offerings, which matters for creative performance and page speed optimization.
WooCommerce Geographic Distribution
WooCommerce's global footprint spans 150+ countries, with the United States accounting for 28% of all stores, followed by the United Kingdom (6%), India (5%), Germany (4%), and Brazil (3%) (Colorlib). The platform's open-source nature and $0 licensing cost make it particularly popular in emerging markets and among budget-conscious entrepreneurs where managed SaaS subscription fees are a barrier to entry.
Social media adoption among WooCommerce merchants shows strong engagement patterns: Instagram is used by 39.4% of stores, Facebook by 35.8%, and YouTube by 13.5% (Store Leads). From a contact data perspective, 57% of stores provide a phone number and 55% have a visible email on their websites — signals of operational maturity that impact customer trust and analytics tracking quality. The combination of global reach and low entry costs continues to attract entrepreneurs worldwide, even as the higher-revenue segment increasingly favors hosted alternatives.
| Country | WooCommerce Store Share | Key Vertical |
|---|---|---|
| United States | 28% | General merchandise |
| United Kingdom | 6% | Apparel, home goods |
| India | 5% | Electronics, fashion |
| Germany | 4% | Industrial, auto parts |
| Brazil | 3% | Health, beauty |
WooCommerce Order Patterns and Mobile Commerce
Metorik's deep analysis of 65 million WooCommerce orders reveals several patterns that are critical for store optimization. Free shipping has become the overwhelming default, with 74% of orders including free delivery — up from 65% in 2023. Stores still charging for shipping on the majority of orders are increasingly in the minority and likely losing conversions as consumer expectations have shifted permanently (Metorik).
A surprising geographic pattern emerged from the data: customers located 1,000–5,000 km away spend roughly 2× more than local buyers. This distance-spending correlation suggests that long-distance purchasers are higher-intent shoppers who have specifically sought out the product, rather than casual browsers. For WooCommerce merchants running Google Ads campaigns, this data argues against overly narrow geographic targeting.
The top product categories on WooCommerce mirror broader e-commerce trends: Home & Garden leads at 11.3%, followed by Apparel (8.6%) and Health & Beauty (7.7%). Food & Beverage stores are the most plugin-heavy industry at 66 average plugins, driven by perishable shipping requirements, delivery scheduling tools, and regulatory compliance demands (Store Leads).
Platform Comparison: WooCommerce vs. Shopify
| Metric | WooCommerce | Shopify |
|---|---|---|
| Live stores (2026) | 4.15M | 2.9M |
| Hosting model | Self-hosted (WordPress) | Fully hosted SaaS |
| Top 1M sites share | 23% | 27% |
| All-sites share | 39% | 10.3% |
| YoY growth | -3.2% | +8.2% |
| Licensing cost | $0 (open-source) | $39–$399/mo |
| Avg plugins/apps | 58 plugins | 8–12 apps |
| Migration trend | Net outflow | 3.1:1 net inflow |
Best Practices for WordPress E-Commerce
- Optimize mobile checkout. With 72% of orders on mobile but conversion rates at just 1.9% (versus 3.7% on desktop), mobile UX improvements deliver outsized revenue impact.
- Consolidate your plugin stack. The average store runs 58 plugins — each adding weight. Audit quarterly and replace single-purpose plugins with multi-feature alternatives to improve page speed and reduce security risk.
- Invest in return customer programs. At 8.2% conversion rate, return customers convert at nearly 3× the overall average. Email retention and remarketing campaigns targeting existing buyers offer the highest marginal ROI.
- Ship free where possible. 74% of WooCommerce orders now include free shipping (up from 65% in 2023). Stores still charging for shipping on most orders are increasingly in the minority and may be losing conversions.
- Monitor the migration trend. WooCommerce's -3.2% YoY decline contrasts with Shopify's +8.2% growth. Evaluate whether self-hosting overhead justifies the flexibility advantage as managed platforms close the customization gap.
- Upgrade your theme. With Storefront at just 0.8% market share, modern alternatives like Flatsome and Woodmart offer better performance, conversion-optimized layouts, and stronger visual customization for paid traffic landing pages.
- Leverage the distance-spending pattern. Data shows buyers located 1,000–5,000 km away spend roughly 2× more than local customers. Consider expanding geographic targeting in paid campaigns and investing in reliable long-distance shipping infrastructure to capture these higher-value orders.
- Track cart abandonment closely. Across the e-commerce industry, cart abandonment averages 69–70%. WooCommerce stores can reduce this through checkout optimization, abandoned cart email sequences, and accelerated payment options like Apple Pay and Google Pay through Stripe integration.
Related reading
- E-Commerce Webflow Statistics: Market Share, Speed & Conversion Data (2026)
- E-Commerce Landing Page Statistics: 80+ Conversion Benchmarks (2026)
- E-Commerce Shopify Statistics: Store Count, Market Share & Growth Data (2026)
- Custom Web Development services at Web Tonic
FAQ
How many WooCommerce stores are there in 2026?
There are approximately 4,151,703 live WooCommerce stores as of mid-2026, according to Store Leads' weekly DNS verification. This represents an 8% year-over-year decline from 2025 levels, driven by merchant migration toward managed SaaS platforms like Shopify. BuiltWith's broader detection identifies 4.17 million live stores, while ShopRank tracks 4,883,525 total WordPress e-commerce stores with WooCommerce powering 97.6% of them. Despite the decline, WooCommerce remains the single largest e-commerce platform by raw store count globally.
What is WooCommerce's market share?
WooCommerce's market share ranges from 23% of the top one million e-commerce sites to 39% of all detected online stores, depending on measurement scope. WordPress itself holds 33.21% of all measurable web origins but has declined about 1 percentage point year-over-year as Shopify and Wix gain share.
What is the average conversion rate for WooCommerce stores?
The average WooCommerce conversion rate is 2.8% overall, with desktop at 3.7%, tablets at 2.4%, and mobile at 1.9%. Top-performing stores achieve 5.5%+ conversion rates, and return customers convert at 8.2% — nearly 3× the overall average.
How much revenue does WooCommerce generate?
WooCommerce stores process approximately $30–35 billion in annual GMV collectively. The median annual revenue per store is $63,000, with the top 10% generating over $500,000 annually. The average WooCommerce order value is $105, according to Metorik's analysis of 65 million orders.
How many plugins does the average WooCommerce store use?
The average WooCommerce store runs 58 active plugins, a number that has remained stable since 2023. Larger stores (over $1M revenue) average 66 plugins, reflecting greater operational complexity across payment gateways, shipping integrations, marketing tools, and compliance requirements. The most popular plugin is Stripe Gateway (40% adoption), and the most popular WordPress plugin overall is Yoast SEO (49%). Annual extension spend ranges from $500–$5,000 depending on store size and complexity.
Sources
storeleads.app/reports/woocommerce
colorlib.com/wp/woocommerce-statistics
peligent.com/blog/woocommerce-statistics
metorik.com — 2026 WooCommerce Insights
ecommerceviews.com — Platform Landscape 2026
gravitykit.com — WordPress Market Share 2026
storecensus.com — CMS Adoption Trends 2026
shoprank.com/technologies/wordpress


