Table of contents
Technical SEO is the invisible infrastructure that determines whether your e-commerce store gets crawled, indexed, and ranked — and the data is clear: only 39% of e-commerce sites pass all three Core Web Vitals simultaneously, and every 100 milliseconds of additional load time reduces conversions by approximately 3.5%. Here are the numbers every online retailer needs to know in 2026.
Key Takeaways
- Only 39% of e-commerce sites pass all three Core Web Vitals (LCP, INP, CLS) simultaneously on mobile, per HTTP Archive data.
- Every 100ms of additional load time costs approximately 3.5% in conversions, according to Shopify's enterprise data study.
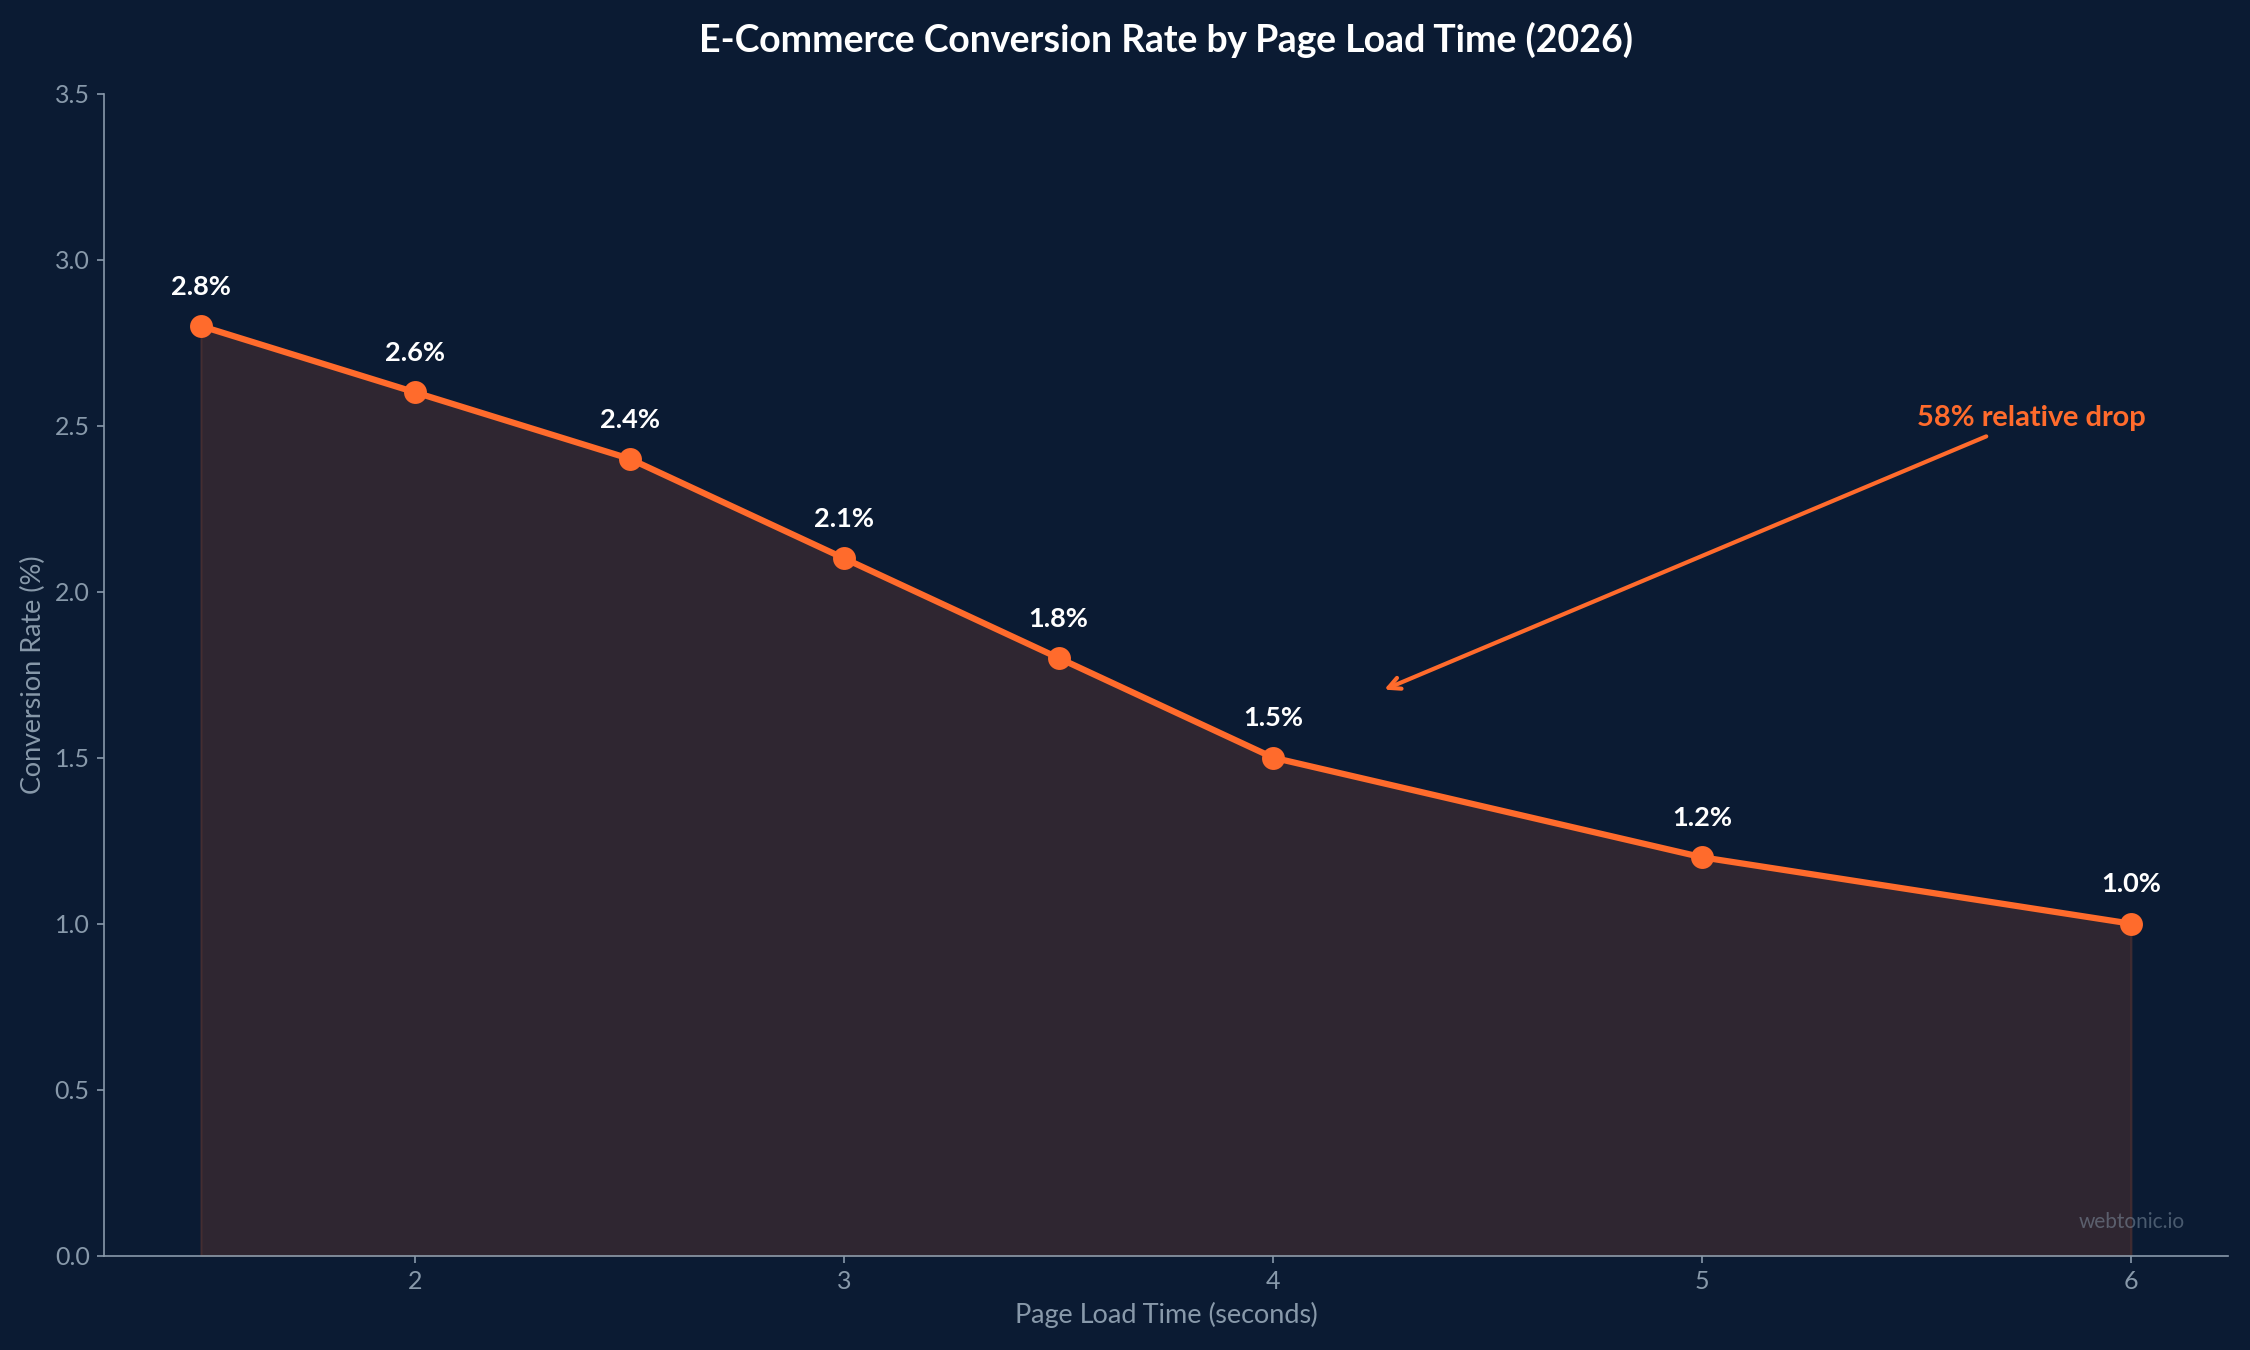
- Stores loading under 2.5 seconds average a 2.4% conversion rate versus 1.0% for stores loading in 5–6 seconds — a 58% relative drop.
- 40–60% of Shopify stores suffer from significant indexation bloat due to unoptimized faceted navigation.
- Products with complete schema markup are 3× more likely to appear in AI-generated recommendations and see 15–30% CTR lifts from rich results.
- Organic search drives 35–55% of total e-commerce revenue, making technical SEO investment directly tied to bottom-line growth.
- Mobile devices account for 65–75% of all e-commerce search traffic but only 51% of revenue, revealing a massive conversion gap.
E-Commerce Technical SEO Benchmarks at a Glance
| Metric | E-Commerce Average | Google "Good" Threshold | Source |
|---|---|---|---|
| LCP (mobile) | 2.26s median (Shopify) | ≤ 2.5s | Noibu |
| INP (mobile) | ~200ms median | ≤ 200ms | Noibu |
| CLS (mobile) | Varies widely | ≤ 0.1 | Web Vitals Tools |
| All 3 CWV Pass Rate | 39% (ecommerce) | All three "Good" | HTTP Archive |
| Mobile Traffic Share | 65–75% | N/A | AuthoritySpecialist |
| Organic Revenue Share | 35–55% | N/A | AuthoritySpecialist |
| Indexation Bloat Rate | 40–60% (Shopify) | < 5% non-indexable | AuthoritySpecialist |
Site Speed and Conversion Rate Impact
The relationship between site speed and e-commerce conversions is one of the most well-documented correlations in digital marketing. Shopify's enterprise data study found that for every 100 milliseconds slower a store loads, conversion tends to be about 3.5% lower. Interaction responsiveness matters equally: for every 32 milliseconds slower a store responds to user interactions, conversion drops by approximately 1.5%.
A RevenueFlows study of 50 Shopify stores quantified this directly: stores loading under 2.5 seconds averaged a 2.4% conversion rate, while stores loading in 5–6 seconds averaged just 1.0% — a 58% relative drop from a 3-second difference in load time. This gap translates directly to revenue: a store doing $1 million annually at 1.0% conversion could capture an additional $1.4 million by reaching the 2.4% tier.
Mobile performance is particularly critical. According to Markana Media, mobile users now represent 73% of e-commerce traffic, and mobile performance is consistently 40–60% worse than desktop on every speed metric. This creates a paradox: the majority of traffic comes from the slowest device category, making mobile optimization the highest-leverage technical SEO investment for online retailers.
Core Web Vitals Pass Rates for E-Commerce
Despite years of Google's emphasis on Core Web Vitals, e-commerce sites continue to lag. According to Noibu's 2026 Site Health Benchmark, only 39% of e-commerce sites pass all three Core Web Vitals simultaneously on mobile. This is below the web-wide average of approximately 49.1% (JustAnalytics, May 2026 CrUX data).
| CWV Metric | Mobile Pass Rate (Web-wide) | Desktop Pass Rate (Web-wide) | E-Commerce Context |
|---|---|---|---|
| LCP | 63.7% | 78.4% | Product image-heavy pages struggle most |
| INP | 71.2% | 89.1% | Filter/facet interactions cause delays |
| CLS | 78.9% | 82.3% | Dynamic pricing/badges shift layout |
| All Three | 51.3% | 67.8% | E-commerce: ~39% mobile |
Shopify stores perform slightly above average: approximately 45% pass all three CWV, with individual pass rates of 60% for LCP, 70% for INP, and 75% for CLS. Sites with LCP under 2.5 seconds see an average of 27% more organic traffic than slower sites, while each additional second of load time reduces conversions by 7% and increases bounce rate by 11%.

Crawl Budget and Indexation Challenges
Large e-commerce catalogs face unique crawl budget challenges that smaller sites never encounter. According to Go Fish Digital, enterprise e-commerce sites must track four key crawl metrics: crawl-to-index alignment, recrawl latency for revenue pages, crawl share by template type, and wasted crawl rate — the percentage of crawl budget spent on non-canonical, noindex, redirected, or soft-404 pages.
The problem is widespread: 40–60% of Shopify stores suffer from significant indexation bloat due to unoptimized faceted navigation, according to AuthoritySpecialist's analysis. When non-indexable pages are reduced below 5% of total inventory, crawl coverage improves dramatically, directly affecting inventory refresh velocity, seasonal ranking recovery, and category page stability.
For stores with more than 5,000 indexed pages, crawl budget management becomes a measurable revenue driver. Category pages — not individual product pages — tend to drive the majority of organic revenue, yet many stores waste crawl budget on low-value parameter variations and filtered views that search engines should never see.
Structured Data and Schema Markup Impact
Product schema markup has evolved from an SEO nice-to-have to a critical requirement for e-commerce visibility. According to ResultFirst, products with complete schema are 3× more likely to appear in AI-generated product recommendations, and rich results can lift click-through rates by 15% to 30%.
The Shopti.ai Schema Coverage Benchmark reveals a stark correlation: stores with 80%+ schema coverage (all critical fields present on most products) see 2.1× more AI shopping referral traffic than stores with only 40% coverage. As AI-powered shopping assistants like Google Shopping AI, Perplexity Shopping, and ChatGPT product recommendations grow, this gap will widen further.
| Schema Element | Adoption Rate | Impact on Visibility |
|---|---|---|
| Product (basic) | ~70% of top stores | Eligibility for rich results |
| AggregateRating | ~55% of stores with reviews | Star ratings in SERPs (+15–30% CTR) |
| Offer (price + availability) | ~65% of top stores | Price display, free listing eligibility |
| BreadcrumbList | 34% (unoptimized catalogs) | Navigation-enhanced SERPs |
| FAQPage | ~25% of product pages | Featured snippet qualification |
Required fields for triggering Google product rich results include price, priceCurrency, availability, and URL. Recommended additions — priceValidUntil, itemCondition, shippingDetails, and hasMerchantReturnPolicy — further increase the probability of enhanced SERP features and merchant listing eligibility.
Mobile-First Indexing and the E-Commerce Revenue Gap
Google's mobile-first indexing means the mobile version of your store is the primary version crawled and ranked. According to Eightx's 2026 vertical analysis, mobile accounts for approximately 73% of US retail site traffic but only 51% of revenue. Contentsquare data puts mobile conversion at 1.9% versus desktop's 3.6% — a 22-percentage-point traffic-to-revenue gap that represents the single biggest under-priced operating problem in DTC e-commerce.
This gap varies dramatically by vertical: apparel captures 62% of revenue on mobile, while electronics captures only 35%. The implication for technical SEO is clear — mobile page speed, layout stability, and interaction responsiveness directly determine what share of your traffic converts to revenue. Stores that close even half of the mobile conversion gap can increase total revenue by 15–25% without acquiring a single additional visitor.
Technical SEO Best Practices for E-Commerce in 2026
- Target sub-2.5s LCP on mobile — stores meeting this threshold average 27% more organic traffic and 58% higher conversion rates than slower competitors.
- Audit and eliminate indexation bloat — reduce non-indexable pages below 5% of your catalog to unlock dramatically better crawl coverage for revenue-generating pages.
- Implement complete Product schema on every product page — include price, availability, reviews, and return policy fields. Stores with 80%+ coverage see 2.1× more AI referral traffic.
- Optimize INP by reducing JavaScript execution — filter and facet interactions are the most common INP offenders on e-commerce sites. Target below 200ms.
- Prioritize category pages in your SEO strategy — these pages drive the majority of organic revenue, yet they are often under-invested relative to individual product pages.
- Address the mobile conversion gap — with 73% of traffic on mobile but only 51% of revenue, mobile UX optimization offers the highest ROI of any technical investment.
- Monitor wasted crawl rate monthly — use Google Search Console's crawl stats report to identify and eliminate crawl waste from parameter URLs, filtered views, and soft-404 pages.
CWV Performance by E-Commerce Platform
| Platform | Median LCP | All-3 CWV Pass Rate | Notable Strength |
|---|---|---|---|
| Shopify | 2.26s | ~45% | Strong CLS scores, hosted CDN |
| WooCommerce | 3.1s | ~35% | Full customization, plugin flexibility |
| Magento/Adobe | 2.8s (est.) | ~38% | Enterprise-grade catalog handling |
| BigCommerce | 2.5s (est.) | ~42% | Built-in SEO features |
Shopify leads in CWV pass rates among major e-commerce platforms, largely due to its hosted CDN infrastructure and theme optimization requirements. However, even Shopify's 45% all-three pass rate means more than half of stores are failing at least one Core Web Vital — typically LCP, where product image optimization is the primary bottleneck. WooCommerce sites fare worst at approximately 35% pass rate and a 3.1-second median LCP, largely due to the plugin ecosystem's variable code quality and the reliance on shared hosting environments that lack dedicated CDN infrastructure.
Technical SEO ROI for Online Retailers
The return on technical SEO investment is substantial and measurable. A cost comparison reveals that technical SEO improvements deliver compounding returns: a one-time site speed optimization that moves LCP from 4 seconds to 2.5 seconds can unlock 27% more organic traffic permanently, with zero ongoing media spend.
Framework-driven technical SEO implementations typically drive a 25–40% increase in organic visibility for enterprise catalogs, according to AuthoritySpecialist's cross-store analysis. The investment payback period is typically 3–6 months for speed optimizations and 6–12 months for comprehensive crawl budget and schema implementations.
For stores currently failing Core Web Vitals, the immediate opportunity is clear: moving from the 39% cohort (failing at least one CWV) to the passing cohort correlates with 15–35% higher conversion rates and measurably better crawl coverage from Googlebot. Combined with the mobile revenue gap — where fixing mobile UX alone can add 15–25% to total revenue — technical SEO offers the highest risk-adjusted ROI of any digital marketing channel for established e-commerce stores.
Organic Search Traffic Trends for E-Commerce
Organic search remains the single largest revenue driver for most e-commerce businesses, but the landscape is shifting. According to AuthoritySpecialist's 2026 benchmarks from 35 online retailers, organic search consistently accounts for 35–55% of total revenue-generating traffic. However, ALM Corp's analysis using Similarweb clickstream data found that organic SERP click share dropped 11–23 percentage points across e-commerce verticals between January 2025 and January 2026.
This decline is driven primarily by the expansion of AI-generated answers and Google Shopping integrations in search results, which reduce the number of clicks flowing to organic listings. Graphite separately reported that US organic search traffic fell 2.5% year-over-year across approximately 4,000 tracked sites. For e-commerce stores, this means technical SEO excellence is no longer just about ranking — it is about ensuring your pages qualify for the new SERP features (rich results, AI shopping answers, merchant listings) that are absorbing traditional organic clicks.
Category and collection pages — not individual product pages — tend to drive the majority of organic revenue for most stores. This makes category page optimization (internal linking, schema markup, unique content, crawl priority) the highest-impact technical SEO workstream for mid-size and enterprise e-commerce operations.
Frequently Asked Questions
How much does site speed affect e-commerce conversion rates?
According to Shopify's enterprise data, every 100 milliseconds of additional load time reduces conversions by approximately 3.5%. A RevenueFlows study of 50 stores found a 58% relative drop in conversion rate between stores loading in 2.5 seconds versus 5–6 seconds, translating to potentially millions in lost annual revenue for mid-size retailers.
What percentage of e-commerce sites pass Core Web Vitals?
Only 39% of e-commerce sites pass all three Core Web Vitals (LCP, INP, CLS) on mobile, according to HTTP Archive data analyzed by Noibu. Shopify stores perform slightly better at approximately 45%. The web-wide average for all site types is 51.3% on mobile and 67.8% on desktop.
Does schema markup actually help e-commerce SEO?
Yes. Products with complete schema are 3× more likely to appear in AI-generated recommendations, and rich results deliver a 15–30% CTR lift. Stores with 80%+ schema coverage see 2.1× more AI shopping referral traffic than stores with only 40% coverage, making schema a direct competitive advantage in the AI search era. The required schema fields — price, priceCurrency, availability, and URL — take minutes to implement on most e-commerce platforms, yet fewer than 70% of top stores include all four. Adding recommended fields like shippingDetails and hasMerchantReturnPolicy further increases merchant listing eligibility in Google Shopping surfaces.
How does crawl budget affect large e-commerce stores?
For stores with over 5,000 indexed pages, crawl budget management becomes a measurable revenue driver. When non-indexable pages (parameter URLs, filtered views, soft-404s) are reduced below 5% of inventory, crawl coverage for revenue pages improves dramatically. An estimated 40–60% of Shopify stores suffer from indexation bloat due to unoptimized faceted navigation.
What is the mobile revenue gap in e-commerce?
Mobile devices account for approximately 73% of e-commerce traffic but only 51% of revenue. Mobile conversion rates average 1.9% versus 3.6% on desktop. This 22-point gap represents the single largest under-priced optimization opportunity in DTC e-commerce — closing even half of it can increase total revenue by 15–25% without additional traffic acquisition.
Sources
shopify.com — Store Speed and Conversion 2026
noibu.com — Ecommerce Site Health Benchmark 2026
revenueflows.ai — Shopify Page Speed Study 2026
searchlab.nl — Technical SEO Statistics 2026
justanalytics.app — Core Web Vitals Statistics 2026
gofishdigital.com — Crawl Budget for Enterprise E-Commerce
markanamedia.com — E-Commerce Site Speed SEO
blog.shopti.ai — Schema Coverage Benchmark 2026
resultfirst.com — Product Schema for E-Commerce
authorityspecialist.com — Ecommerce SEO Benchmarks 2026
eightx.co — Mobile Revenue Share by Vertical 2026