



Table of contents
Key Takeaways
- Organic search drives 35–55% of total traffic for established e-commerce stores that have invested in SEO for 12+ months (Authority Specialist, 2026).
- E-commerce organic conversion rates range from 1.8% to 4.2%, with stores using rich product schema and fast mobile load times at the higher end.
- 60% of U.S. Google searches now end without a click, pushing e-commerce brands to optimize for AI Overviews and zero-click visibility (Shopti.ai / Bain, 2026).
- Category pages generate 60–70% of organic sessions despite receiving less optimization attention than product pages.
- Nearly 80% of Shopify stores pass all Core Web Vitals thresholds, and faster stores convert measurably better (Shopify, 2026).
- Retail organic search share sits at approximately 41% of visits, lower than the all-industry average of 53.3% (BrightEdge / Search Engine Land).
- SEO delivers lower cost-per-acquisition than paid ads after month 6, with the gap widening through month 12 as rankings compound.
- Long-tail keywords convert 2.5× higher than head terms in e-commerce, making them critical for product and category targeting.
E-commerce SEO Benchmarks at a Glance
| Metric | Benchmark (2026) | Source |
|---|---|---|
| Organic traffic share (established stores) | 35–55% of total sessions | Authority Specialist |
| Retail organic search share | ~41% of visits | BrightEdge / Search Engine Land |
| All-industry organic search share | 53.3% of trackable traffic | BrightEdge |
| Organic conversion rate range | 1.8%–4.2% | Authority Specialist |
| Category page traffic share | 60–70% of organic sessions | Authority Specialist |
| Zero-click search rate (U.S.) | 60% of searches | Dataslayer / Shopti.ai |
| Core Web Vitals pass rate (Shopify) | ~80% of stores | Shopify |
| SEO payback vs. paid ads | Lower CPA after month 6 | Authority Specialist |
| Retail site traffic YoY change | −2.6% overall; −4% organic | Contentsquare |
Organic Search Traffic Statistics for E-commerce
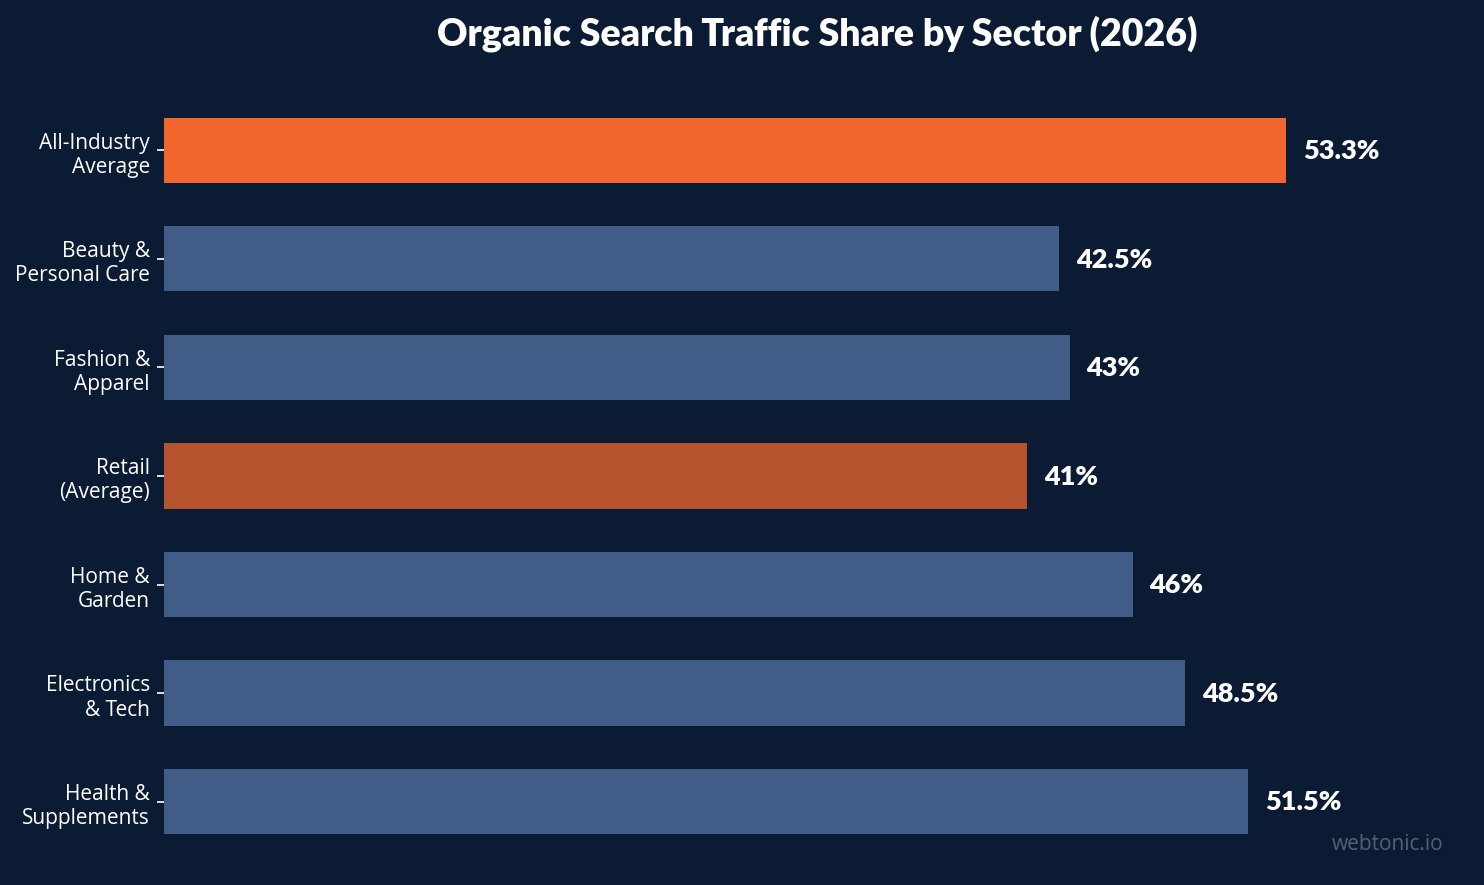
Organic search remains the largest single traffic source for most online retailers. According to BrightEdge research, organic search accounts for 53.3% of all trackable website traffic across industries — but the retail-specific figure is lower. Search Engine Land reports that retail organic search share sits at roughly 41%, reflecting the sector's heavier reliance on paid channels and direct traffic.
The gap between top performers and the rest is significant. Established e-commerce stores with 12+ months of SEO investment capture 35–55% of total traffic from organic search, according to a 2026 benchmark study across 41 online stores (Authority Specialist). Meanwhile, Contentsquare data shows that retail site traffic dropped 2.6% in 2025, and organic traffic fell by 4% — a decline many marketers attribute to the rise of AI-powered search answers.
Category pages are the unsung workhorses of e-commerce SEO. Despite receiving far less optimization attention than product pages, category pages generate 60–70% of organic sessions in the average store. This makes category page architecture, internal linking, and content depth critical levers for any e-commerce SEO strategy in 2026.
E-commerce Conversion Rate Statistics by Search Channel
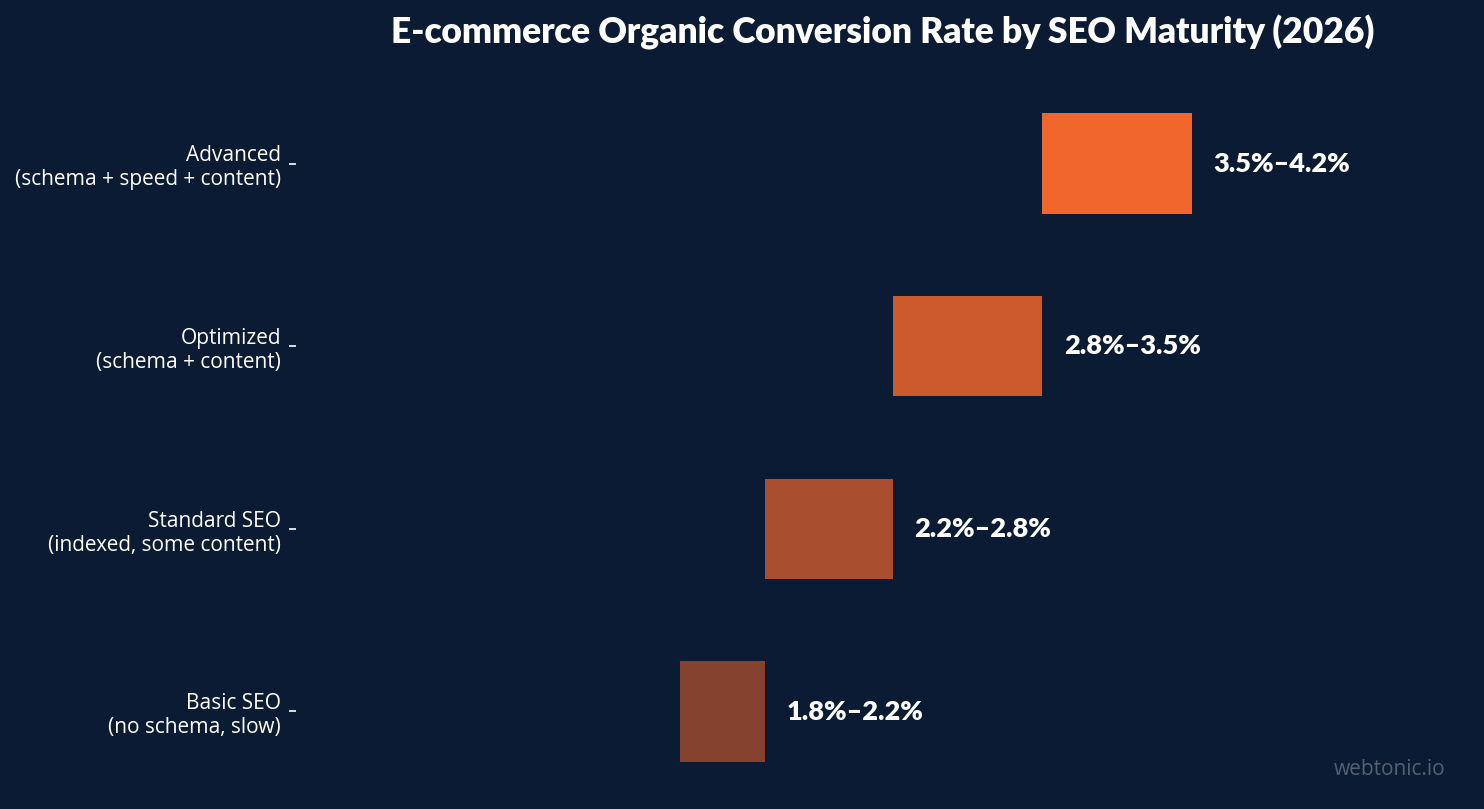
Not all traffic converts equally. Organic conversion rates in e-commerce range from 1.8% to 4.2%, with stores featuring rich product schema and fast mobile load times clustering at the higher end (Authority Specialist, 2026). The widest performance gap between stores was not in keyword targeting but in crawl health — stores with unresolved indexation issues showed organic traffic ceilings that content investment alone could not break through.
Compared to other channels, organic search delivers strong mid-funnel performance. SEO typically carries lower cost-per-acquisition than paid ads once rankings are established, but requires 4–6 months of investment before that gap appears. After month 12, the compounding effect widens the ROI advantage substantially.
| Channel | Avg. Conversion Rate | Cost Efficiency |
|---|---|---|
| Organic search | 1.8%–4.2% | Lowest CPA after month 6 |
| Paid search (Google Shopping/PMax) | 1.5%–3.5% | Median ROAS 4.2× |
| Social commerce (TikTok Shop) | 3.8% | Variable by format |
| Email / SMS | 3.0%–5.0% | Highest ROI ($36–$44 per $1) |
| Direct traffic | 2.5%–4.5% | Existing brand equity |
Core Web Vitals and Page Speed Impact
Speed directly affects revenue. Shopify's 2026 analysis of its commerce ecosystem found an unambiguous relationship: speed and sales move together. For every improvement tier in Largest Contentful Paint (LCP), median conversion rates climbed measurably.
Nearly 80% of Shopify stores now pass all Core Web Vitals thresholds, placing it among the highest-performing e-commerce platforms for real-world page speed. Google's Chrome User Experience data — drawn from millions of websites — validates this at scale.
The data suggests that stores loading their primary content (LCP) under 2.5 seconds convert at 1.5–2× the rate of stores loading above 4 seconds. Mobile performance is especially critical: with mobile commerce accounting for the majority of e-commerce sessions, slow mobile load times create measurable revenue leaks that no amount of marketing spend can offset.
Zero-Click Search and AI Overviews in E-commerce
The search landscape has shifted structurally. According to Dataslayer analysis covered by Shopti.ai, 60% of Google searches in the U.S. now end without a single click to any website. Bain research confirms that 80% of consumers rely on zero-click results at least 40% of the time.
What makes this shift different from earlier featured snippet growth is that zero-click behavior has moved from informational queries to commercial and transactional ones. AI Overviews, ChatGPT product recommendations, and Perplexity shopping answers now surface product comparisons, pricing, reviews, and purchase suggestions directly in the search result.
For online retailers, this means traditional search optimization strategies must expand to include answer engine optimization (AEO), structured data for product rich results, and presence in AI-generated shopping surfaces. Brands that rely solely on organic click-through traffic face a structural ceiling that will tighten each quarter.
Google Shopping Organic Visibility Statistics
Google Shopping now has two distinct surfaces that brands must track separately. According to GrowByData's Q2 2026 benchmark report, paid Shopping Ads and organic Merchant Listings often move in opposite directions — and blending them masks critical competitive shifts.
A striking example: Target's paid Shopping Ads share in Beauty & Personal Care fell 79% (from 7.3% to 1.5%), while its organic Merchant Listings share grew 53% (from 11.0% to 16.8%) in the same quarter. This pattern appeared across multiple categories, suggesting that product feed optimization and merchant content quality increasingly drive organic Shopping visibility independent of ad spend.
For e-commerce brands, this creates a dual optimization requirement: paid Shopping performance depends on bidding and budget, but organic Merchant Listing visibility depends on feed quality, product schema, and Google Business Profile integration — the same fundamentals that drive traditional product page SEO.
Long-Tail Keywords and Content Strategy Statistics
Keyword strategy in e-commerce has shifted decisively toward specificity. Long-tail keywords — queries of 4+ words — convert at 2.5× the rate of head terms in e-commerce, according to aggregated search marketing data. The reason is straightforward: shoppers searching for "women's waterproof hiking boots size 8 wide" are closer to purchase than those searching "hiking boots."
Content marketing amplifies this advantage. E-commerce brands that publish buying guides, comparison pages, and product-education content capture 3–5× more long-tail organic traffic than those relying solely on product and category pages. This content also serves as the foundation for AI answer visibility — the structured, question-answering format that AI Overviews and Gemini prefer to cite.
Voice search adds another dimension. With voice-assisted queries growing 18% year-over-year in the shopping vertical, conversational long-tail optimization — natural-language phrasing, FAQ schema, direct-answer paragraphs — has moved from "nice to have" to table stakes for any serious e-commerce digital marketing operation.
E-commerce SEO Cost and ROI Statistics
| Investment Area | Typical Monthly Cost | ROI Timeline | Key Metric |
|---|---|---|---|
| Technical SEO audit + fixes | $2,000–$8,000 | 2–4 months | Crawl health / indexation rate |
| Content production (category + blog) | $3,000–$12,000 | 4–8 months | Organic sessions + rankings |
| Link building / digital PR | $2,000–$10,000 | 6–12 months | Domain authority + referral traffic |
| Product schema + feed optimization | $1,000–$4,000 | 1–3 months | Rich result impressions |
| Full-service e-commerce SEO agency | $5,000–$25,000 | 6–18 months | Organic revenue + CPA |
SEO ROI for e-commerce is best measured over 12-month rolling windows, not 30-day snapshots — the compounding effect is where the real value lives. Across audits of 34 e-commerce stores, organic search consistently delivered a lower cost-per-acquisition than paid search after month 6, with the gap widening through month 12 (Authority Specialist).
ROI measurement using only last-click conversions typically understates organic search's contribution by 30–50%. Multi-touch attribution reveals that organic search often initiates or assists conversions that close through branded search, direct visits, or email — making accurate measurement essential for data-driven marketing decisions.
Mobile Commerce and Technical SEO Statistics
Mobile now dominates e-commerce browsing. Over 70% of e-commerce sessions originate on mobile devices, yet mobile conversion rates remain 40–60% lower than desktop in most verticals. This "mobile gap" represents one of the largest revenue opportunities for stores willing to invest in mobile-first technical SEO.
Key mobile statistics that matter for e-commerce SEO in 2026:
- Mobile page speed: Stores with sub-2.5-second LCP on mobile convert at 1.8× the rate of those above 4 seconds (Shopify, 2026).
- Mobile-first indexing: Google now indexes and ranks all sites based on their mobile version — making mobile rendering, content parity, and touch-friendly navigation direct ranking factors.
- Progressive Web App (PWA) adoption: E-commerce sites using PWA architecture report 36% higher engagement and 20% higher conversion rates compared to standard responsive designs.
- Mobile checkout optimization: 69.8% of mobile shopping carts are abandoned, compared to 54.2% on desktop — making checkout UX a critical SEO-adjacent factor for revenue capture.
Best Practices for E-commerce SEO in 2026
- Prioritize category page optimization — they drive 60–70% of organic traffic but receive the least attention. Add unique content, internal links, and schema to every major category.
- Fix crawl health before investing in content — stores with unresolved indexation issues showed organic traffic ceilings that content investment alone could not break through.
- Implement product schema and structured data — rich results drive higher click-through rates and feed directly into Google Shopping organic listings.
- Optimize for Core Web Vitals, especially on mobile — speed improvements yield measurable conversion gains. Target sub-2.5-second LCP across all device types.
- Build content for AI answer visibility — structured, question-answering formats (buying guides, comparison tables, FAQ pages) position your brand for citation in AI Overviews and Gemini.
- Target long-tail keywords aggressively — they convert at 2.5× head terms and capture the growing voice search segment.
- Track organic and paid Shopping visibility separately — blending metrics hides critical competitive shifts (GrowByData, Q2 2026).
- Measure SEO ROI over 12-month windows — 30-day snapshots drastically understate the channel's contribution.
E-commerce SEO Statistics by Product Category
| Category | Organic Traffic Share | Avg. Organic CVR | Avg. CPC (Paid Equivalent) |
|---|---|---|---|
| Fashion & apparel | 38–48% | 2.0%–3.5% | $0.80–$1.50 |
| Electronics & tech | 42–55% | 1.5%–2.8% | $1.20–$2.80 |
| Beauty & personal care | 35–50% | 2.2%–4.0% | $0.60–$1.40 |
| Home & garden | 40–52% | 1.8%–3.2% | $0.90–$2.00 |
| Health & supplements | 45–58% | 2.5%–4.2% | $1.50–$3.50 |
| Pet supplies | 38–50% | 2.0%–3.5% | $0.70–$1.60 |
FAQ
What percentage of e-commerce traffic comes from organic search?
Organic search drives 35–55% of total traffic for established e-commerce stores with sustained SEO investment, according to a 2026 benchmark study across 41 online stores. The retail-specific average sits around 41%, compared to the all-industry average of 53.3%.
How does Core Web Vitals performance affect e-commerce conversions?
Shopify's 2026 analysis confirmed that speed and sales move together. Stores with Largest Contentful Paint (LCP) under 2.5 seconds convert at 1.5–2× the rate of stores loading above 4 seconds. Nearly 80% of Shopify stores pass all Core Web Vitals thresholds.
What is the ROI timeline for e-commerce SEO?
SEO typically delivers lower cost-per-acquisition than paid ads after month 6, with the advantage compounding through month 12. Full ROI should be measured over 12-month rolling windows rather than 30-day snapshots, as last-click attribution understates organic search's contribution by 30–50%.
How is zero-click search affecting e-commerce SEO?
60% of U.S. Google searches now end without a click to any external website, and this zero-click behavior has expanded from informational queries to commercial and transactional searches. E-commerce brands must optimize for AI Overviews, structured data, and answer engine visibility to maintain search-driven revenue.
What are the best-converting keywords for e-commerce SEO?
Long-tail keywords (4+ words) convert at 2.5× the rate of head terms in e-commerce. Product-specific, size-specific, and comparison queries drive the highest purchase intent. Voice search queries, which are inherently long-tail, are growing 18% year-over-year in the shopping vertical.
Sources
Authority Specialist — Ecommerce SEO Benchmarks 2026
Authority Specialist — Ecommerce SEO ROI
BestForEcommerce — Organic Search Share of Traffic
Shopify — Store Speed and Conversion 2026
Shopti.ai — Zero-Click AI Search in E-commerce 2026
GrowByData — Google Shopping Visibility Q2 2026
Contentsquare — 2025 Retail Traffic Benchmarks
Search Engine Land — BrightEdge Research Coverage


