Table of contents
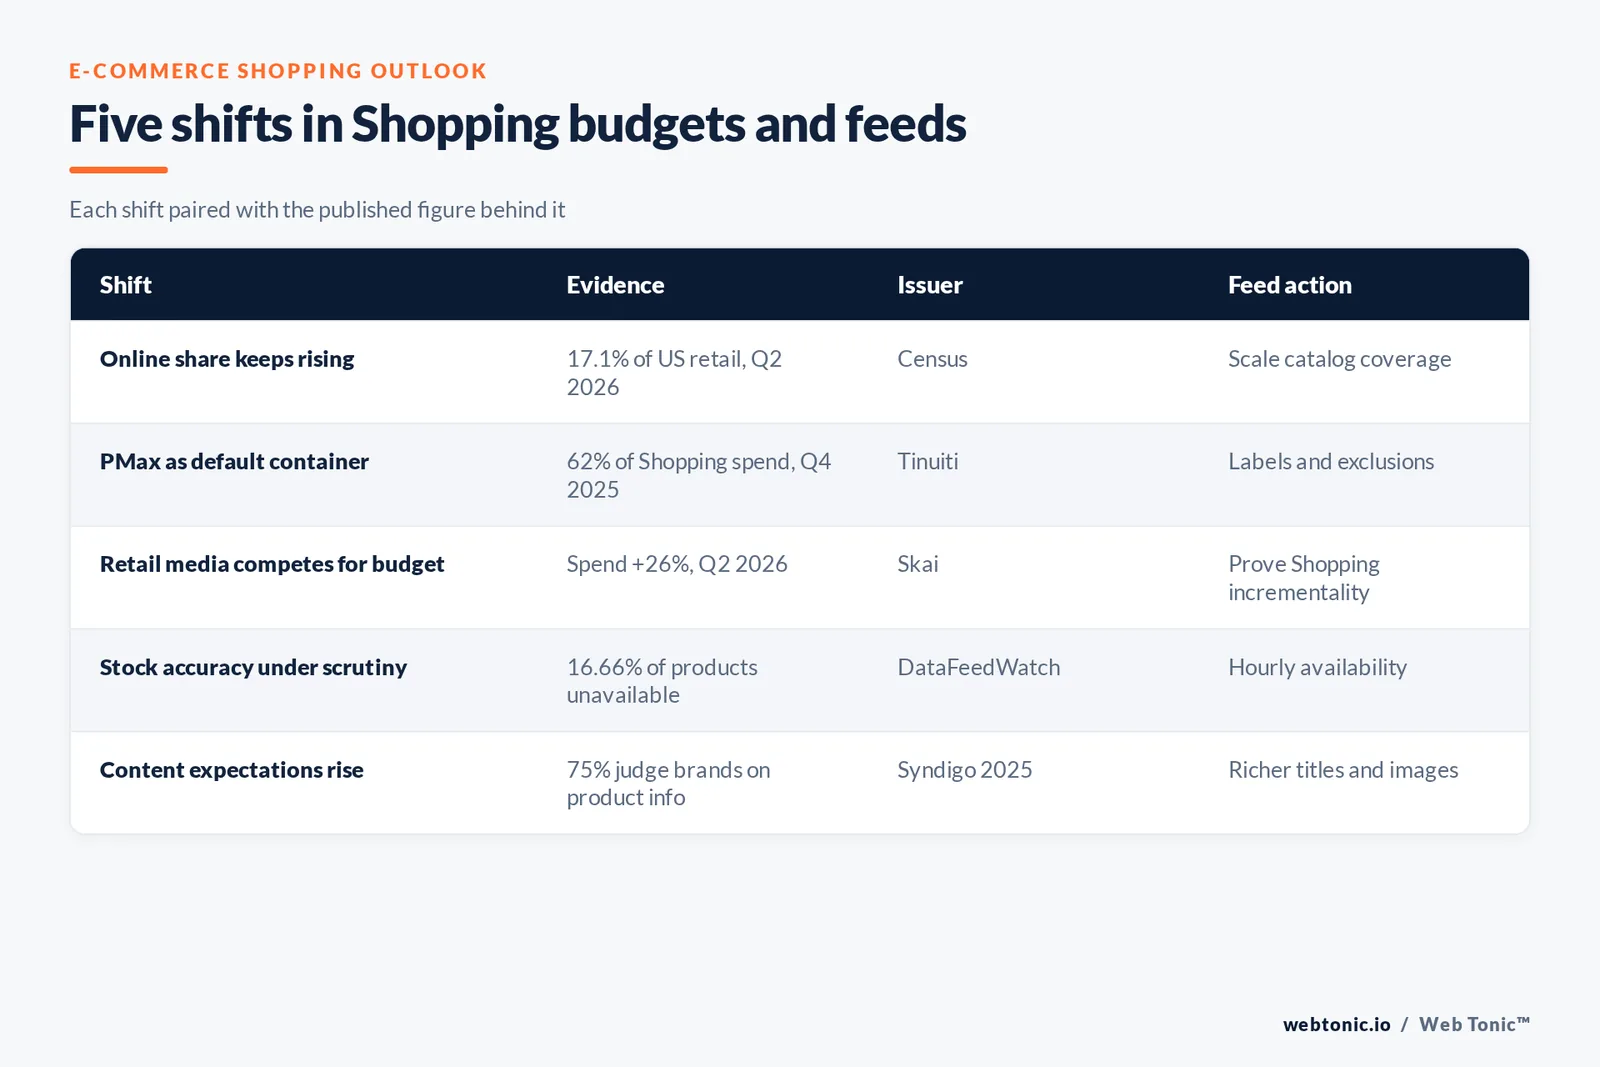
E-commerce reached 17.1% of US retail sales in Q2 2026 and US online sales grew 12.2% year on year, while Performance Max took 62% of Google Shopping spend among brands running both campaign types in Q4 2025. This page tracks which way Shopping budgets are moving for online stores and what that means for feed management over the next year.
Key Takeaways
- US e-commerce hit USD 340.2 billion in Q2 2026, 17.1% of retail (Census).
- Online sales grew 12.2% year on year versus 6.7% for all retail.
- Holiday 2025 online spend reached USD 257.8 billion, up 6.8% (Adobe).
- 56.4% of holiday online spend came through smartphones.
- Google search spend rose 13% in Q4 2025 for Tinuiti advertisers.
- Skai measured paid search spend up 17% and retail media up 26% in Q2 2026.
- Amazon's US Google Shopping impression share: 0% in Q2 2026 (Tinuiti).
- PMax took 62% of Shopping spend in Q4 2025.
- 16.66% of catalog products were out of stock in a 15,000-store study.
- 92% of online retailers use paid search to sell products.
- 75% of shoppers think less of a brand with poor product information (Syndigo 2025).
The demand base: e-commerce share keeps rising
The US Census Bureau's Quarterly Retail E-Commerce Sales report estimates Q2 2026 e-commerce at USD 340.2 billion seasonally adjusted, up 3.8% on the quarter and 12.2% on the year, against 6.7% growth for total retail sales of USD 1,986.5 billion. Online now accounts for 17.1% of US retail sales.
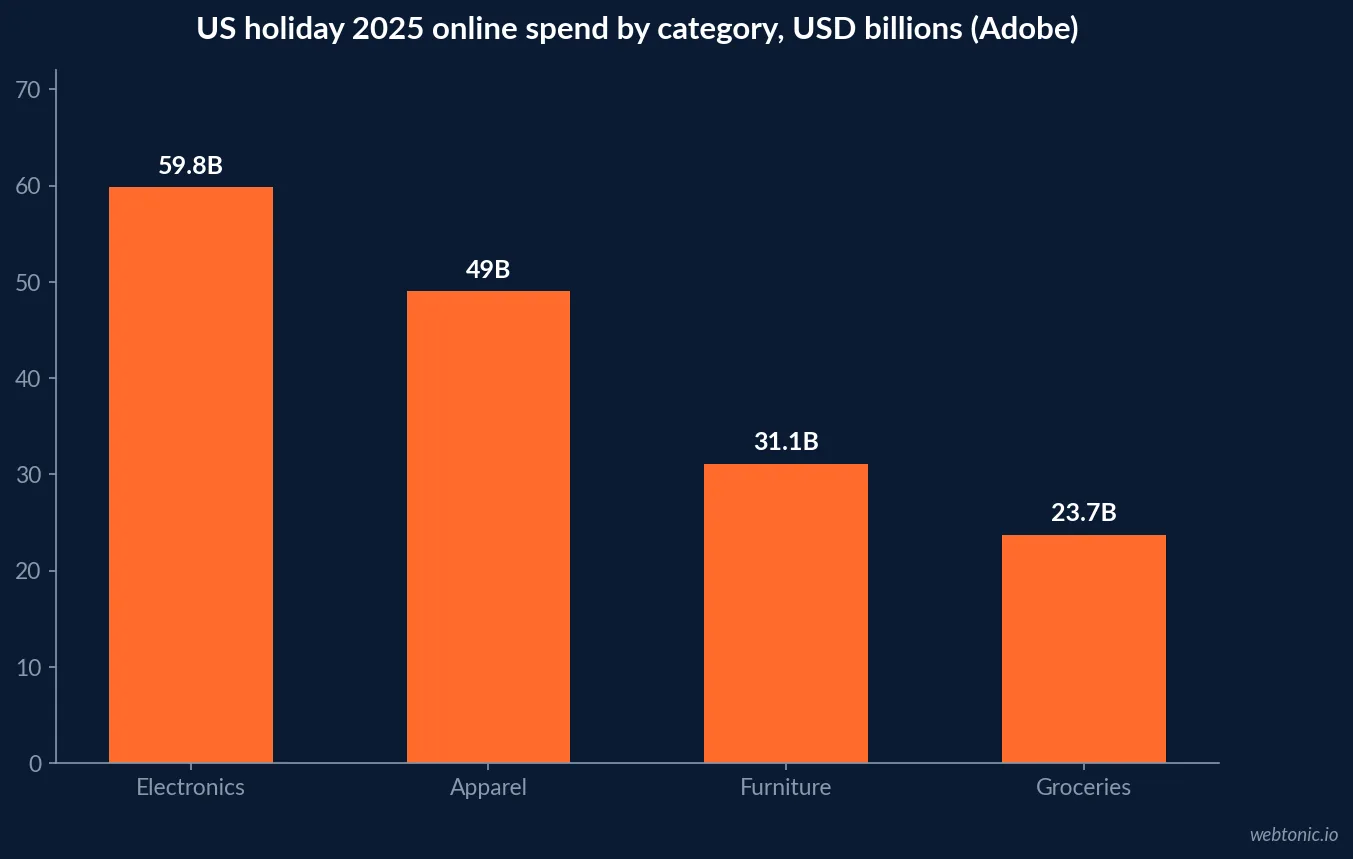
Adobe's 2025 holiday season report puts online spend from November 1 to December 31 at a record USD 257.8 billion, up 6.8%, with 56.4% of online spend on smartphones. Electronics (USD 59.8 billion), apparel (USD 49.0 billion) and furniture (USD 31.1 billion) drove 54% of it - three of the most feed-intensive categories on Google Shopping.
Adobe also recorded traffic to US retail sites from generative AI tools up 693.4% year on year over the season, while noting the base of users remains modest. That matters for feed managers because AI assistants and Google's AI shopping surfaces read the same structured product data a Shopping ad does: the feed is becoming the storefront for discovery that never touches a results page. The growth is a trend worth preparing for, not yet a budget line to shift money into.
| Demand indicator | Value | Issuer and period |
|---|---|---|
| US e-commerce sales (seasonally adjusted) | USD 340.2B | Census, Q2 2026 |
| E-commerce share of total retail | 17.1% | Census, Q2 2026 |
| E-commerce growth, year on year | +12.2% | Census, Q2 2026 |
| Total retail growth, year on year | +6.7% | Census, Q2 2026 |
| Holiday online spend | USD 257.8B (+6.8%) | Adobe, Nov-Dec 2025 |
| Share of holiday spend on smartphones | 56.4% | Adobe, Nov-Dec 2025 |
Where Shopping budgets moved in the last four quarters
Tinuiti's Q4 2025 Digital Ads Benchmark Report shows Google search ad spend up 13% year on year for its advertisers, from 10% growth a quarter earlier, with clicks up 13% - the strongest click growth since early 2021 - and Shopping CPC down 1%. Its Q1 2026 edition headlines Google paid search clicks up 14%.
Skai's Q2 2026 release reads the same channel differently for its client base: paid search spend up 17% but clicks roughly flat as CPCs rose, while retail media spend grew 26%. In Q1 2026 Skai measured retail media spend up 27% with clicks up 38%. Online stores are funding Google Shopping and marketplace ads at the same time, which puts pressure on every Shopping budget to show incremental return.
| Quarterly signal | Value | Vendor and quarter |
|---|---|---|
| Google search ad spend growth | +13% | Tinuiti, Q4 2025 |
| Google search click growth | +13% | Tinuiti, Q4 2025 |
| Google Shopping CPC change | -1% | Tinuiti, Q4 2025 |
| Google paid search click growth | +14% | Tinuiti, Q1 2026 |
| Retail media spend growth | +27% | Skai, Q1 2026 |
| Paid search spend growth | +17% | Skai, Q2 2026 |
| Retail media spend growth | +26% | Skai, Q2 2026 |
The Amazon gap in Google Shopping
Tinuiti reports Amazon stopped running nearly all US Google Shopping ads in July 2025, and that no single advertiser has come close to filling its former position; Target was prominent during Q4 holidays and Walmart's impression share was strong in December. Its Q2 2026 page gives Amazon's US Google Shopping impression share against the median retailer as 0%. Meanwhile Amazon Sponsored Products clicks ran 22% higher year on year in Q4 2025.
For mid-sized online stores that is a structural change: the largest competitor in many product auctions is absent, but shoppers may be searching on Amazon directly. Feeds that win the freed impressions still need competitive price and availability data.
Performance Max is now the default container
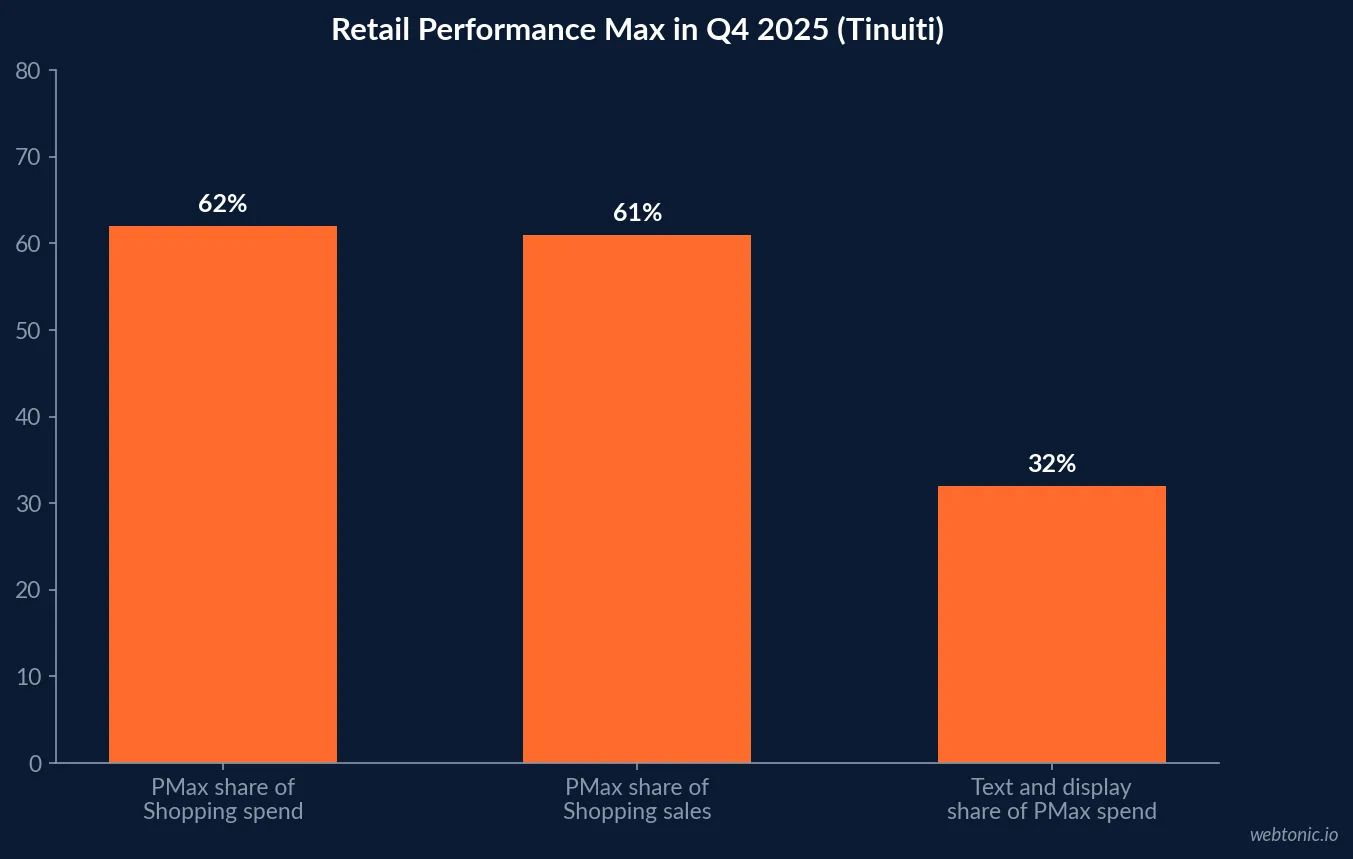
Among brands running both types, Tinuiti measured Performance Max at 62% of Google Shopping ad spend in Q4 2025 (from 69% a year earlier and a low of 53% in Q1 2025) and 61% of Shopping ad sales. Text and display took 32% of PMax spending by the end of 2025, so a growing slice of "Shopping" budget is not actually buying product listings.
The direction for feed management is clear: the same product data now feeds listings, video, display and text inside one campaign, and product-level exclusions and custom labels are the main levers left to the advertiser.
Stock accuracy is the next feed battleground
DataFeedWatch's Feed Marketing Report 2022 (15,000+ stores) found 16.66% of products in advertising catalogs unavailable for purchase. Vehicles and parts sellers had 57.46% of products out of stock and sporting goods 40.09%, while apparel had recovered to 84.56% in stock. Discounting was sector-specific too: fashion, beauty and furniture retailers discounted 37%, 33% and 32% of products.
Google's Shopping Graph holds more than 50 billion listings, with 2 billion updated every hour. As AI shopping surfaces compare offers in near real time, a daily feed refresh leaves stock and price mismatches visible for hours.
| Catalog condition (DataFeedWatch 2022) | Share of products | Feed rule to apply |
|---|---|---|
| Unavailable across all catalogs | 16.66% | Auto-exclude or mark out of stock hourly |
| Vehicles and parts out of stock | 57.46% | Supplemental availability feed |
| Sporting goods out of stock | 40.09% | Pause product groups at zero stock |
| Apparel in stock | 84.56% | Size-level variants and availability |
| Fashion products discounted | 37% | sale_price with effective dates |
| Beauty products discounted | 33% | Promotion feed alignment |
Multichannel feeds are the norm
The same DataFeedWatch data shows 92% of online retailers use paid search to promote and sell products, more than 44% advertise catalogs on both Google Shopping and Facebook, and 68% of retailers on two or more marketplaces pair Amazon with eBay. Stores with more than 200,000 SKUs promote products on 50% more channels than stores with 50,000 to 200,000 SKUs.
That is where feed management is heading: one catalog, many destinations, each with its own attribute rules. The work moves from fixing one Merchant Center feed to governing a product data source that serves every channel.
Practically, that shifts budget from media to data operations. A store feeding Google, Meta and two marketplaces maintains four sets of required attributes, four category taxonomies and four disapproval queues. The DataFeedWatch data also shows 65% of advertisers exclude some items to protect return, and 87.68% still run everything from a single data source - a setup that becomes harder to defend as channel count rises.
| Multichannel practice (DataFeedWatch 2022) | Value | Direction for 2026 feeds |
|---|---|---|
| Retailers using paid search to sell | 92% | Google remains the core feed |
| Advertise on Google Shopping and Facebook | over 44% | Two-feed minimum for most stores |
| Marketplace sellers pairing Amazon + eBay | 68% | Marketplace attributes to govern |
| Extra channels at 200,000+ SKUs | +50% | Large catalogs spread widest |
| Advertisers excluding items for ROI | 65% | Margin-based exclusion rules |
| Single data source for all channels | 87.68% | Supplemental sources are the gap |
Product content expectations are rising
Syndigo's 2025 State of Product Experience report (8,546 adults in six countries) found 75% think less of a brand if its products are not accurately and completely represented online, up from 62% in 2023. 44% abandoned a purchase when they could not find enough information and 21% returned a purchase that did not match the information available. Feed titles, descriptions and images are that information on a Shopping listing.
| Shopper response (Syndigo 2025) | Share |
|---|---|
| Think less of a brand with incomplete product info | 75% |
| Same measure in 2023 | 62% |
| Abandoned a purchase over insufficient information | 44% |
| Returned a purchase that missed expectations | 21% |
Omnichannel: local inventory joins the feed
Retailers with stores can surface in-store stock through local inventory ads and free local product listings, available in the US, Canada, the UK and dozens of other countries under Shopping ads policies plus local rules. Eligibility stays product-only: Google's Unsupported Shopping content policy excludes services and immovable property, so installation or repair add-ons sold by a store cannot be listed as Shopping products.
What to budget for in the next 12 months
- Plan for PMax as the container; keep a standard Shopping split where you need product control.
- Move availability to hourly updates for categories with high stock-out rates.
- Govern one product source for Google, Meta and marketplaces.
- Invest in content depth: titles, descriptions, extra images.
- Read vendor benchmarks by quarter, and never mix Tinuiti and Skai numbers as one market.
- Test the Amazon gap in your categories with impression-share reports.
Related e-commerce data
See our e-commerce influencer and UGC statistics, the e-commerce CTV data and our Google Ads pricing guide. For measurement across channels, our growth marketing team builds the reporting.
Frequently Asked Questions
Are e-commerce brands spending more on Google Shopping in 2026?
The vendor data points that way. Tinuiti's Q4 2025 report shows Google search ad spend up 13% year on year for its advertisers with clicks up 13%, and Skai's Q2 2026 release shows paid search spend up 17% across its platform. Both are client-base samples, so quote the quarter and the vendor rather than treating either as the market.
What happened to Google Shopping after Amazon left the auctions?
Tinuiti reports that Amazon stopped running nearly all US Google Shopping ads in July 2025, that no single retailer filled its former position, and that Target and Walmart were prominent during the Q4 holidays. Tinuiti's Q2 2026 page gives Amazon's US Google Shopping impression share against the median retailer as 0%. Shopping CPC fell 1% year on year in Q4 2025.
How much of Shopping spend runs through Performance Max?
Among brands running both campaign types, Tinuiti measured Performance Max at 62% of Google Shopping ad spend in Q4 2025, down from 69% a year earlier and up from 53% in Q1 2025. PMax produced 61% of Shopping ad sales in the same quarter.
Why does out-of-stock data matter for Shopping feeds?
Because advertising on unavailable products wastes budget and frustrates shoppers. DataFeedWatch's 2022 study of 15,000+ stores found 16.66% of catalog products unavailable, rising to 57.46% for vehicles and parts and 40.09% for sporting goods. Google's Shopping Graph refreshes 2 billion listings every hour, so stale availability is quickly exposed.
What do shoppers expect from product content?
Syndigo's 2025 State of Product Experience survey of 8,546 adults across six countries found 75% think less of a brand when its product information online is incomplete or inaccurate, and 44% abandoned a purchase because they could not find enough information. Feed titles, descriptions and images are that content on a Shopping listing.
Sources
US Census Bureau - Quarterly Retail E-Commerce Sales, Q2 2026
Adobe - 2025 holiday shopping season results
Tinuiti - Digital Ads Benchmark Report Q4 2025
Tinuiti - Digital Ads Benchmark Report Q1 2026
Tinuiti - Digital Ads Benchmark Report Q2 2026
Skai - Q2 2026 Quarterly Trends press release
Skai - Q1 2026 Quarterly Trends press release
DataFeedWatch - Feed Marketing Report 2022
Syndigo - State of Product Experience 2025
Google - Agentic checkout and AI shopping (The Keyword)
Google Merchant Center Help - Local inventory ads policies
Google Merchant Center Help - Unsupported Shopping content