



Table of contents
For online stores, connected TV has become a commerce channel: Amazon reports 77% of its ad-exposed streaming TV viewers purchase on Amazon, and Roku lets a Shopify store launch shoppable TV ads from USD 500. This page collects the 2025-2026 e-commerce CTV data and labels whose data each figure is.
Key Takeaways
- 80% of Amazon's ad-exposed streaming TV viewers browse on Amazon; 77% purchase there (Amazon data).
- Interactive streaming TV ads drove 36% more orders than non-interactive ones in Amazon's test.
- 65% of surveyed Walmart customers say CTV ads helped them discover new products.
- US viewers spend about USD 290 a year on products discovered while watching TV (MNTN Research, vendor, May 2025).
- MNTN advertisers saw conversion rates up 42% year on year in Q1 2026.
- Prime Day week 2025 brought 49% more MNTN advertisers and 23% lower cost per visit.
- The share of small spenders investing in CTV rose from 60% to 85% between 2024 and 2026 (IAB).
- Streaming held 49.0% of US TV time in July 2026 (Nielsen).
Retail media turned CTV into a sales channel
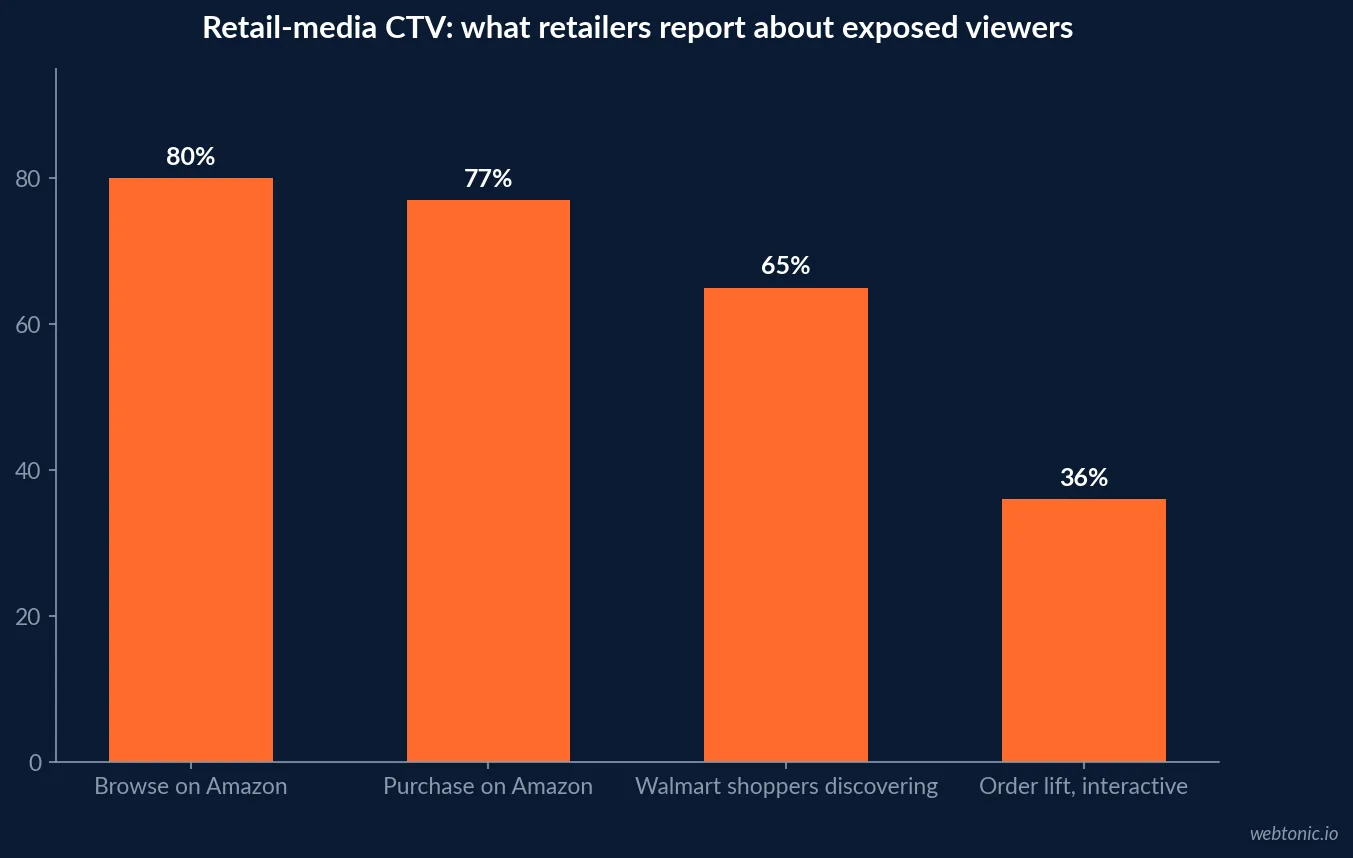
The biggest e-commerce change in CTV is who sells it. Amazon Ads reports more than 200 million monthly ad-supported streaming TV reach in the US, more than 20,000 first-party audiences built from shopping and streaming signals, and internal data showing 80% of ad-exposed streaming TV viewers browse on Amazon and 77% purchase there. It also cites a 36% lift in orders for interactive streaming TV ads over non-interactive ones.
Walmart is building the same loop through VIZIO. Its March 2026 NewFronts release says 65% of surveyed Walmart customers report CTV ads helped them discover new products, and a Cafe Bustelo campaign reached 98% incremental households beyond linear TV. These are retailer-reported figures, and they describe shoppers already inside each retailer's ecosystem.
| Retail-media CTV signal | Figure | Reported by | Caveat |
|---|---|---|---|
| Monthly ad-supported streaming reach, US | 200M+ | Amazon Ads | Unduplicated across Amazon properties |
| Ad-exposed viewers who browse on Amazon | 80% | Amazon internal data | Oct 2023-Mar 2024 |
| Ad-exposed viewers who purchase on Amazon | 77% | Amazon internal data | Not an incrementality test |
| Order lift, interactive vs standard | +36% | Amazon internal data | Dec-Jan test window |
| Walmart customers finding products via CTV ads | 65% | Walmart Connect survey | Dec 2024 survey |
| Incremental household reach beyond linear | 98% | Walmart (Cafe Bustelo) | Single campaign |
Shoppable CTV for Shopify stores
Roku's Shopify step-by-step guide (March 2026) describes installing the Roku Ads app in Shopify, syncing the catalog, building shoppable Action Ads with a call to action such as Shop Now, and tracking conversions back into Roku Ads Manager. Campaigns can launch from USD 500, and merchants without on-screen checkout can send viewers an SMS link to shop on mobile.
Roku's Blu Dot case study is the most detailed published example. The furniture brand's first test reached more than 211,000 households and delivered 8,486 page-view conversions, hitting 1,010% ROAS within four weeks; after a 10x budget increase it reported 2,308% ROAS over 11 weeks. It is a vendor case study of one brand, not a benchmark.
| Blu Dot on Roku (vendor case study) | Result | Period |
|---|---|---|
| Households reached in first test | 211,000+ | First campaign |
| Page-view conversions in first test | 8,486 | First campaign |
| ROAS in first four weeks | 1,010% | Four weeks |
| Purchase conversions per day | 9 to 50 | First test |
| ROAS after 10x budget increase | 2,308% | 11-week phase 2 |
| ROAS vs other CTV partners in annual sale | 91% higher | Annual sale |
What TV viewers already spend
MNTN Research, the performance-TV vendor's research arm, reported in May 2025 that US consumers spend about USD 290 a year on products they discovered while watching TV. It also cites NBCUniversal shoppable activations with a 171% rise in positive brand perception and 60% year-on-year growth in purchase activity, while QR codes still see only around a 0.1% scan rate.
That last figure is the honest constraint. Most e-commerce CTV sales still happen on a second device later, so attribution rather than on-screen checkout decides whether the channel looks profitable.
Seasonality in performance-TV data
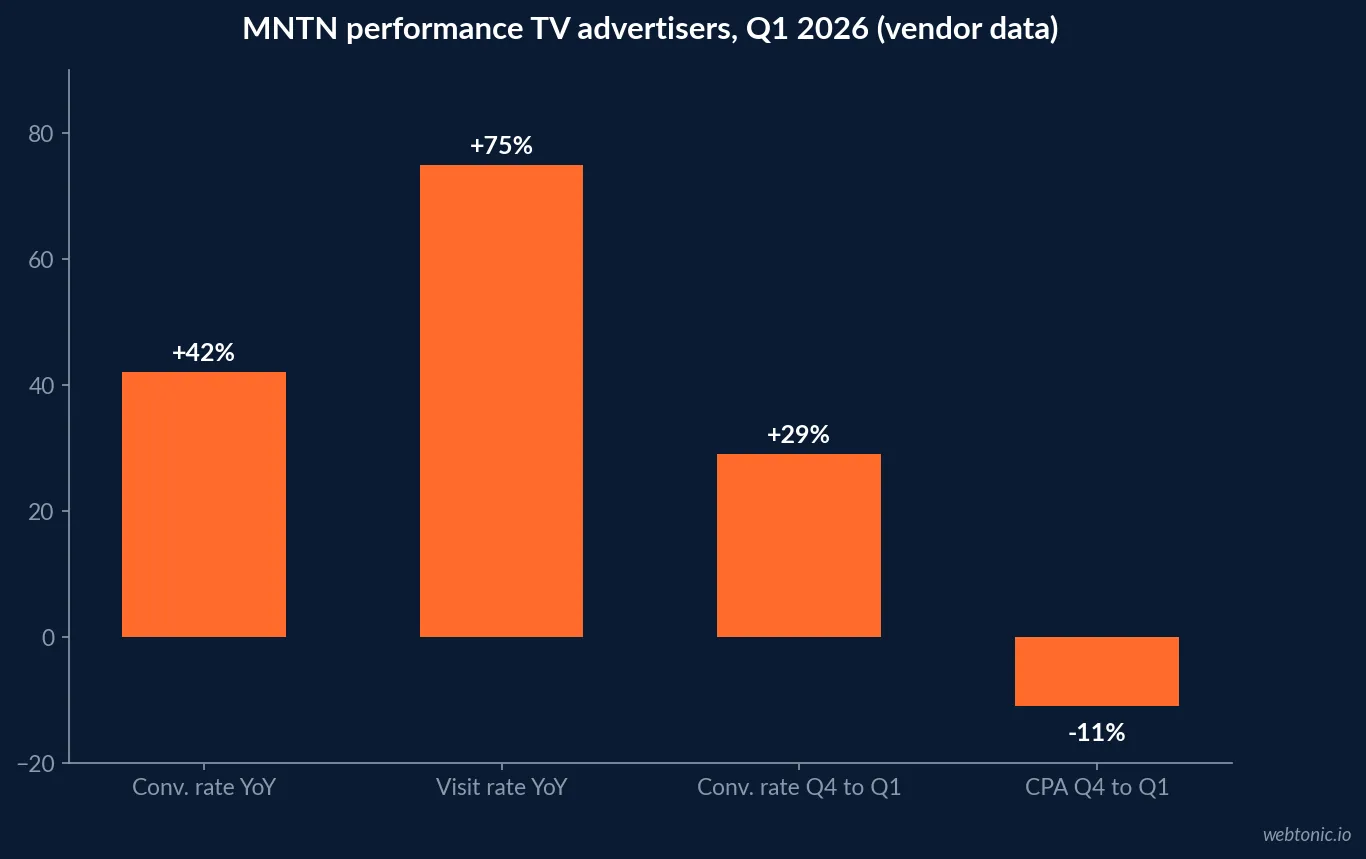
Performance-TV vendor MNTN publishes quarterly advertiser data. Its Q1 2026 retrospective found average campaign revenue up 25% from January to March, and among advertisers active in both Q1 2025 and Q1 2026, conversion rates up 42% and visit rates up 75%. Advertisers active in both Q4 2025 and Q1 2026 saw conversion rates rise 29%, visit rates 21% and CPA fall 11% from Q4 into Q1.
Event weeks move the numbers too. During Prime Day week 2025, MNTN counted 49% more advertisers year on year, visit rates up 29% and cost per visit down 23%. Over Cyber Week 2025, 39% of MNTN advertisers optimised for cost per visit and 58% ran prospecting campaigns.
| MNTN advertiser data (vendor) | Change | Comparison |
|---|---|---|
| Average conversion rate | +42% | Q1 2026 vs Q1 2025 |
| Average visit rate | +75% | Q1 2026 vs Q1 2025 |
| Average conversion rate | +29% | Q1 2026 vs Q4 2025 |
| Average cost per acquisition | -11% | Q1 2026 vs Q4 2025 |
| Cost per visit, Prime Day week | -23% | 2025 vs 2024 |
| Advertisers optimising for cost per visit, Cyber Week | 39% | 2025 |
Measured brand-building: a new-to-brand example
Amazon's Beekeeper's Naturals case study shows how an e-commerce brand read streaming TV through new-to-brand purchases rather than last-click sales. Streaming TV's contribution to new-to-brand purchases rose from 0.82% at launch to 3.86% by April 2025, a 370% increase, alongside a 4.3x increase in branded search influenced by streaming TV.
Users exposed to streaming TV, Amazon DSP display and sponsored ads together showed 233% higher purchase likelihood than those exposed to sponsored ads alone. That correlates exposure with purchase inside Amazon's data; it does not isolate streaming TV's own effect.
Entry budgets for online stores
The cost of a first test has collapsed. Roku's self-serve campaigns start at USD 500, while Amazon lists a USD 10,000 recommended minimum for self-service streaming TV and USD 50,000 for managed service. In June 2026 Walmart agreed to acquire Vibe.co, a self-serve CTV platform for small and mid-sized businesses with more than 10,000 advertisers.
The IAB's 2026 video report measures the effect: the share of small spenders investing in CTV rose from 60% in 2024 to 85% in 2026, with self-serve platforms lowering the entry barrier.
| Entry point for an online store | Minimum or scale | Commerce hook |
|---|---|---|
| Roku Ads Manager | USD 500 per campaign | Shopify catalog sync, shoppable Action Ads |
| Amazon streaming TV, self-service | USD 10,000 recommended | Amazon shopping audiences |
| Amazon streaming TV, managed | USD 50,000 | Managed by Amazon Ads |
| Vibe.co (Walmart acquisition, pending) | 10,000+ advertisers | Walmart commerce audiences |
The audience and the risk
Nielsen's July 2026 Gauge put streaming at 49.0% of US TV viewing, so the reach is there. The risk sits in the supply: Pixalate measured invalid traffic at 25% of US open programmatic CTV traffic in Q2 2026. Retail-media and direct publisher buys reduce that exposure, which is part of what their minimums pay for.
Advertisers are still leaning in. In Tatari's 2026 client survey, 77% expect TV budgets to increase and only 5% plan cuts, while 51% plan to combine linear and streaming.
How TV advertisers are planning 2026
Tatari's 2026 planning survey of its own TV clients gives the clearest read on how performance-minded advertisers now split TV. 51% will integrate linear and streaming, 36% will primarily run linear and only 9% will primarily run streaming. 57% still judge TV mainly on performance KPIs, while 23% will widen its role to brand goals.
On value, 92% point to incremental reach and 92% to measurable performance impact, with cross-channel lift at 74%. For an online store, that is the same test the new-to-brand and branded-search readings above are trying to pass. The survey reflects Tatari's client base, not all advertisers, and it records intentions rather than results, so treat it as a read on competition for inventory rather than as evidence that any given store will see a return.
| Tatari 2026 client survey | Share | Read for an online store |
|---|---|---|
| Expect TV budgets to increase | 77% | Competition for streaming inventory rises |
| Plan to cut TV budgets | 5% | Few advertisers are leaving |
| Integrate linear and streaming | 51% | Streaming-only is the minority plan |
| Name incremental reach as a key value | 92% | Measure new-to-brand, not only repeat buyers |
| Value measurable performance impact | 92% | TV is held to digital standards |
What the e-commerce CTV data does not prove
Almost every e-commerce CTV figure here is reported by the platform selling the media: Amazon, Walmart, Roku and MNTN. None is an independent, industry-wide incrementality benchmark, and ROAS cases are selected successes. They show the mechanics work and the direction is positive; they do not tell a store what its own return will be.
The fix is a holdout. Run a geographic or audience holdout on the first test, read new-to-brand and branded search alongside ROAS, and scale only on the lift you measured yourself.
How online stores should test CTV
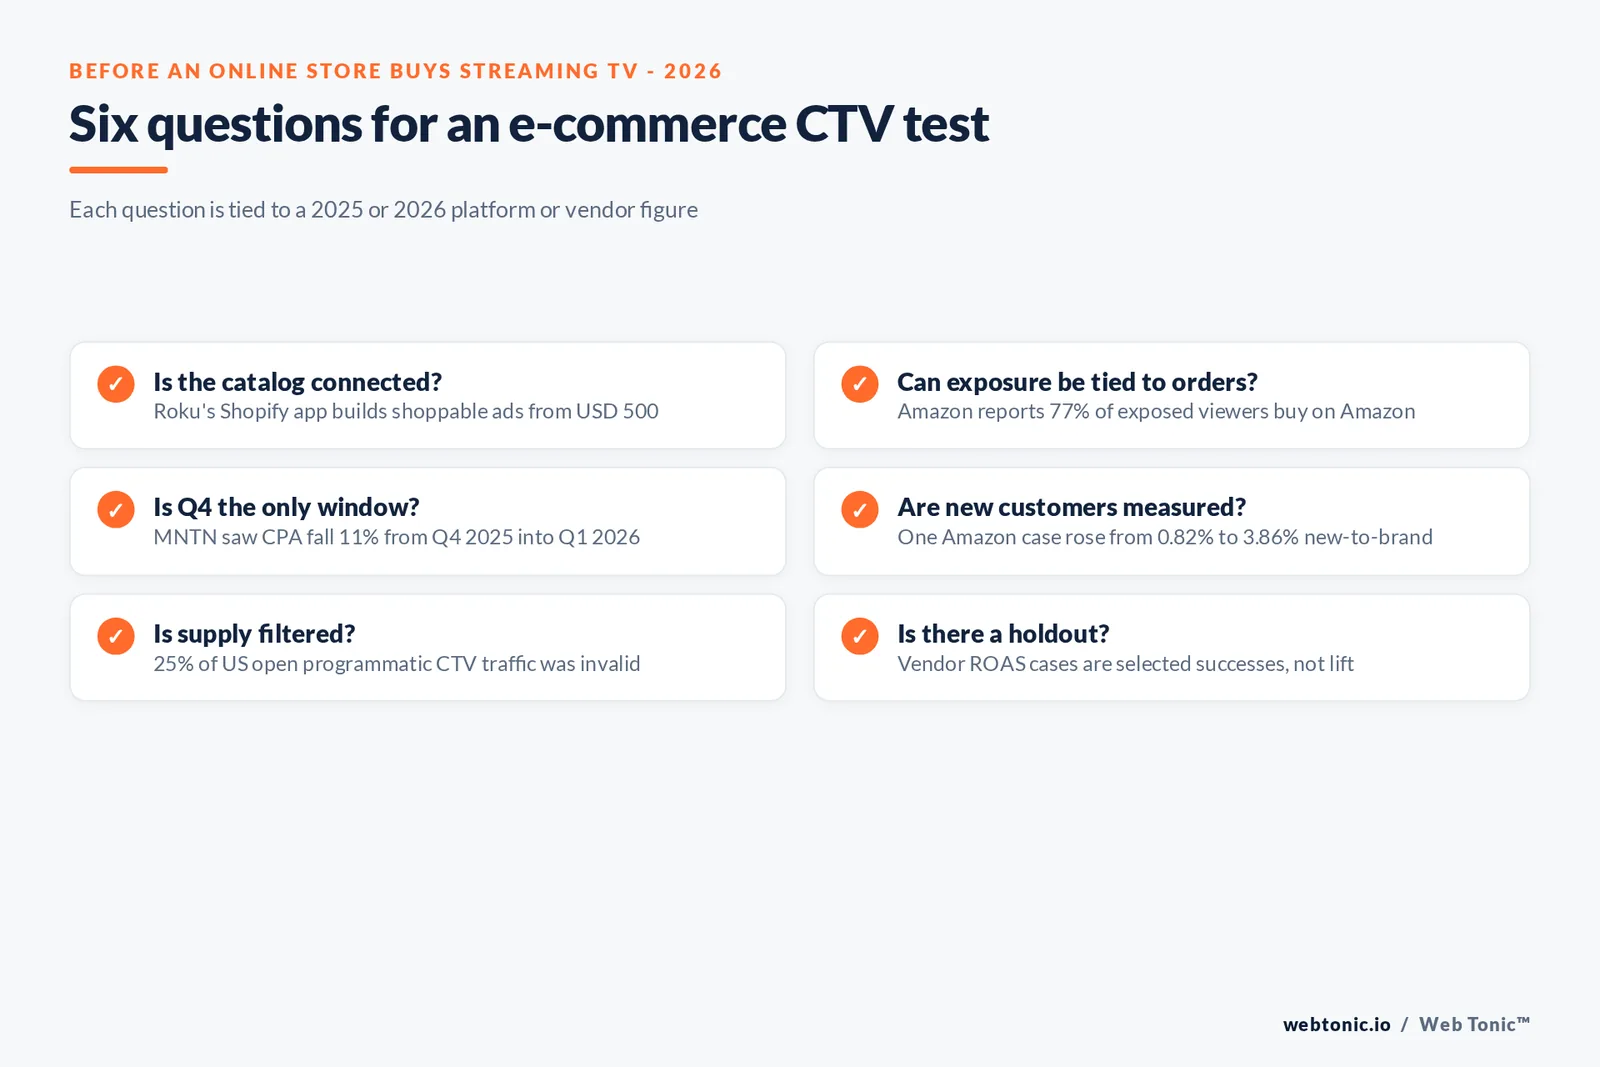
- Start with catalog-connected inventory. Shopify-to-Roku and Amazon both close the loop.
- Test outside Q4. MNTN saw CPA fall 11% from Q4 into Q1.
- Read new-to-brand, not only ROAS. One Amazon case went from 0.82% to 3.86%.
- Hold out a region. Vendor ROAS is not incrementality.
- Buy clean supply. 25% of open programmatic CTV traffic was invalid in Q2 2026.
Our growth marketing team designs holdout tests for new channels, and our performance creative team cuts shoppable TV variants from existing assets. For store-side context, see our e-commerce influencer and UGC statistics and e-commerce SMS marketing data.
Frequently Asked Questions
Does connected TV work for e-commerce brands?
There is no independent e-commerce CTV benchmark, so the evidence is vendor data and case studies. Amazon reports that 80% of its ad-exposed streaming TV viewers browse on Amazon and 77% purchase there, and MNTN's performance-TV data shows conversion rates up 42% year on year for advertisers active in both Q1 2025 and Q1 2026. Both are platform-reported figures, useful for direction but not independent proof of incrementality.
What is the minimum budget for CTV as an online store?
Roku Ads Manager campaigns start at USD 500, and Roku's Shopify integration lets a store build shoppable ads from its catalog. Amazon's streaming TV ads carry a USD 10,000 recommended minimum for self-service and USD 50,000 for managed service. These are platform entry points, not recommendations for a full test.
Can viewers buy directly from a CTV ad?
Increasingly, yes. Roku's Shopify integration supports shoppable Action Ads with an on-screen call to action, and merchants without on-screen checkout can send viewers an SMS link. MNTN's research notes QR codes still see around a 0.1% scan rate, so direct response on screen is still the exception rather than the norm.
When should e-commerce brands run CTV?
Performance-TV data suggests not only in Q4. MNTN advertisers active in both Q4 2025 and Q1 2026 saw average conversion rates rise 29% and cost per acquisition fall 11% from Q4 to Q1. During Prime Day week 2025, MNTN saw visit rates up 29% and cost per visit down 23% year on year.
What should an online store ask a CTV vendor for?
Ask for closed-loop sales attribution, household reach and frequency, and invalid-traffic filtering. Pixalate put invalid traffic at 25% of US open programmatic CTV traffic in Q2 2026, and retail-media CTV from Amazon and Walmart sells on its ability to tie exposure to purchases.
Sources
Amazon Ads - Streaming TV ads
Amazon Ads - Gigi and Beekeeper's Naturals streaming TV case study
Roku Advertising - Shopify and Roku step-by-step guide
Roku Advertising - Blu Dot case study
Walmart - Walmart and VIZIO scale content to commerce at NewFronts (2026)
Walmart - Walmart to acquire Vibe.co (2026)
MNTN Research - Q1 2026 retrospective
MNTN Research - Prime Day 2025 consumer snapshot
MNTN Research - Black Friday Cyber Monday 2025 on CTV
MNTN Research - Viewers spend USD 290 a year on products seen on TV
Nielsen - July 2026 The Gauge report
IAB - 2026 Digital Video Ad Spend and Strategy Full Report
Pixalate - Q2 2026 Ad Fraud Benchmarks Report for North America
Tatari - TV can no longer be overlooked in media plans for 2026


