



Table of contents
E-commerce demand generation is a budget-allocation problem across channels, not a single ad account's performance. With US retail e-commerce sales at an estimated USD 340.2 billion in Q2 2026 (US Census Bureau) and public DTC marketing spend averaging 13.3% of revenue across a wide 2.2%-31.1% range, the real planning question is how much goes to demand creation, how much to demand capture, and how much to the owned channels that carry no media cost per contact.
Key Takeaways
- US retail e-commerce sales reached an estimated USD 340.2 billion in Q2 2026, up 3.8% quarter over quarter (US Census Bureau).
- E-commerce was 16.4% of total US retail sales in Q2 2026.
- Average marketing spend across 12 public DTC/CPG 10-Ks runs 13.3% of revenue (Eightx analysis).
- That spend ranges from 2.2% to 31.1% of revenue depending on category and stage.
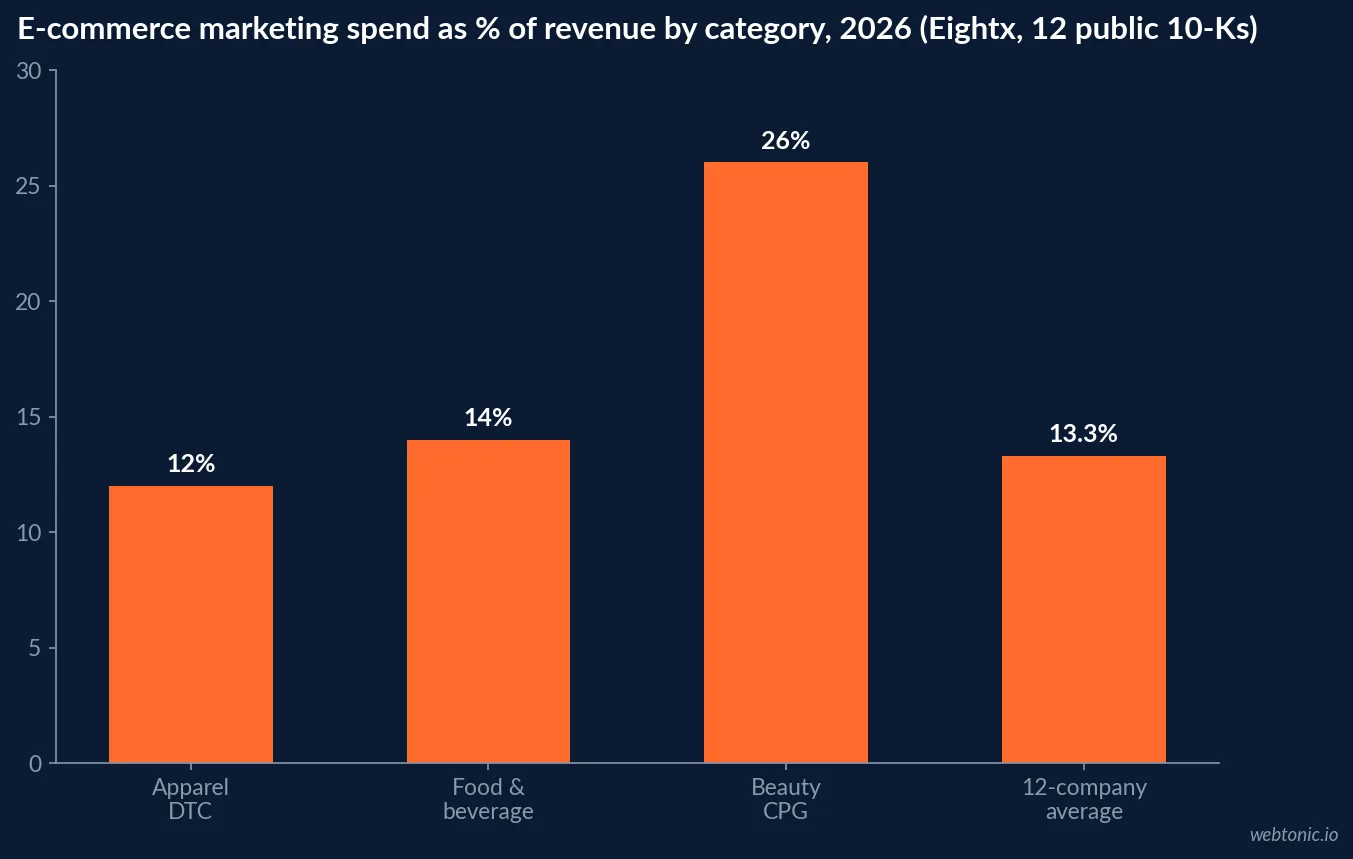
- Beauty CPG brands run near 26% of revenue on marketing; apparel DTC near 12%; food and beverage near 14%.
- The CMO Survey 2026's cross-industry benchmark sits at 9.0% of revenue - a floor, not a ceiling, for a growth-stage e-commerce brand.
- Overall marketing spend growth slowed to just 1.7% year over year (The CMO Survey 2026).
- Klaviyo's 2026 benchmarks are drawn from over 183,000 e-commerce customers.
- Shopify's own 2026 guidance names email and SMS the "highest-ROI owned channel" for e-commerce brands.
- Shopify merchants cleared more than USD 100 billion in GMV in Q1 2026 alone, on 34% revenue growth.
- High-growth firms across categories spend roughly 12% of revenue on marketing versus 5% for no-growth firms (Hinge 2026).
- The 95-5 rule (Ehrenberg-Bass Institute / LinkedIn B2B Institute) - a cross-industry benchmark - puts only 5% of a category in-market to buy at once.
| Category context (2026) | Figure | Source |
|---|---|---|
| US retail e-commerce sales, Q2 2026 | USD 340.2 billion, +3.8% QoQ | US Census Bureau |
| E-commerce share of total US retail sales, Q2 2026 | 16.4% | US Census Bureau |
| Average public DTC/CPG marketing spend | 13.3% of revenue | Eightx, 12-company 10-K analysis |
| Range across categories | 2.2%-31.1% of revenue | Eightx, 12-company 10-K analysis |
| Shopify merchant base | 2M+ active merchants, ~USD 300B annualized GMV | Shopify / Online Store News |
The category is still growing - so is the case for a real budget
The US Census Bureau's Quarterly Retail E-Commerce Sales report estimated US retail e-commerce sales at USD 340.2 billion in the second quarter of 2026, up 3.8% from the first quarter, with e-commerce accounting for 16.4% of total US retail sales in that quarter. That is measured category growth, not a projection, and it is the backdrop against which any single brand's demand-generation percentage should be read: a flat share of revenue still buys a growing absolute media budget inside an expanding category.
Against that growth, Shopify's own Q1 2026 financial results show merchants clearing more than USD 100 billion in GMV in a single quarter, with revenue growth of 34% - the scale that makes Shopify's own channel guidance a reasonable proxy for the category, not just for its own platform.
What e-commerce brands actually spend, by category
Eightx's analysis of 12 public DTC and CPG 10-K filings found average marketing spend at 13.3% of revenue, with a wide range from 2.2% to 31.1% depending on category and growth stage: beauty CPG brands run near 26% of revenue, apparel DTC near 12%, and food and beverage near 14%.
The spread is the finding. A brand should not import a single-vertical percentage wholesale; the relevant comparison is the closest category match plus the brand's own gross margin, since a 26% marketing spend only works at beauty-category gross margins.
| Category | Approx. marketing spend as % of revenue (2026) | Source |
|---|---|---|
| Beauty CPG | ~26% | Eightx, 12-company 10-K analysis |
| Food and beverage | ~14% | Eightx, 12-company 10-K analysis |
| Apparel DTC | ~12% | Eightx, 12-company 10-K analysis |
| 12-company blended average | 13.3% | Eightx, 12-company 10-K analysis |
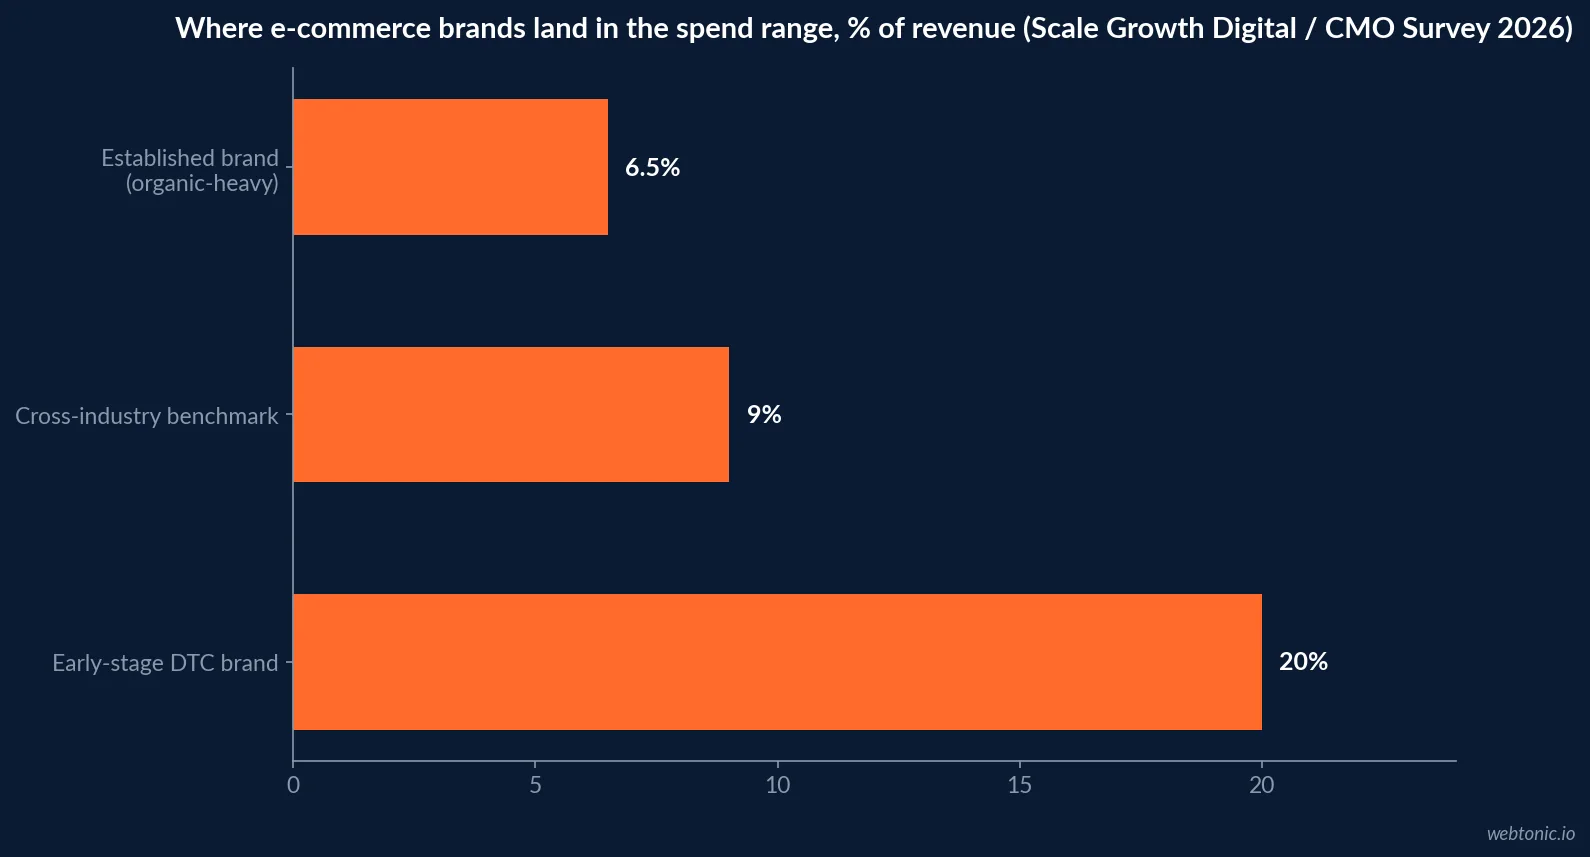
| Established brand, strong organic traffic | 5%-8% | Scale Growth Digital |
| Early-stage DTC / growth mode | 15%-25% | Scale Growth Digital |
| Cross-industry benchmark, all sectors | 9.0% | The CMO Survey 2026 |
Demand creation vs. demand capture: where the budget actually goes
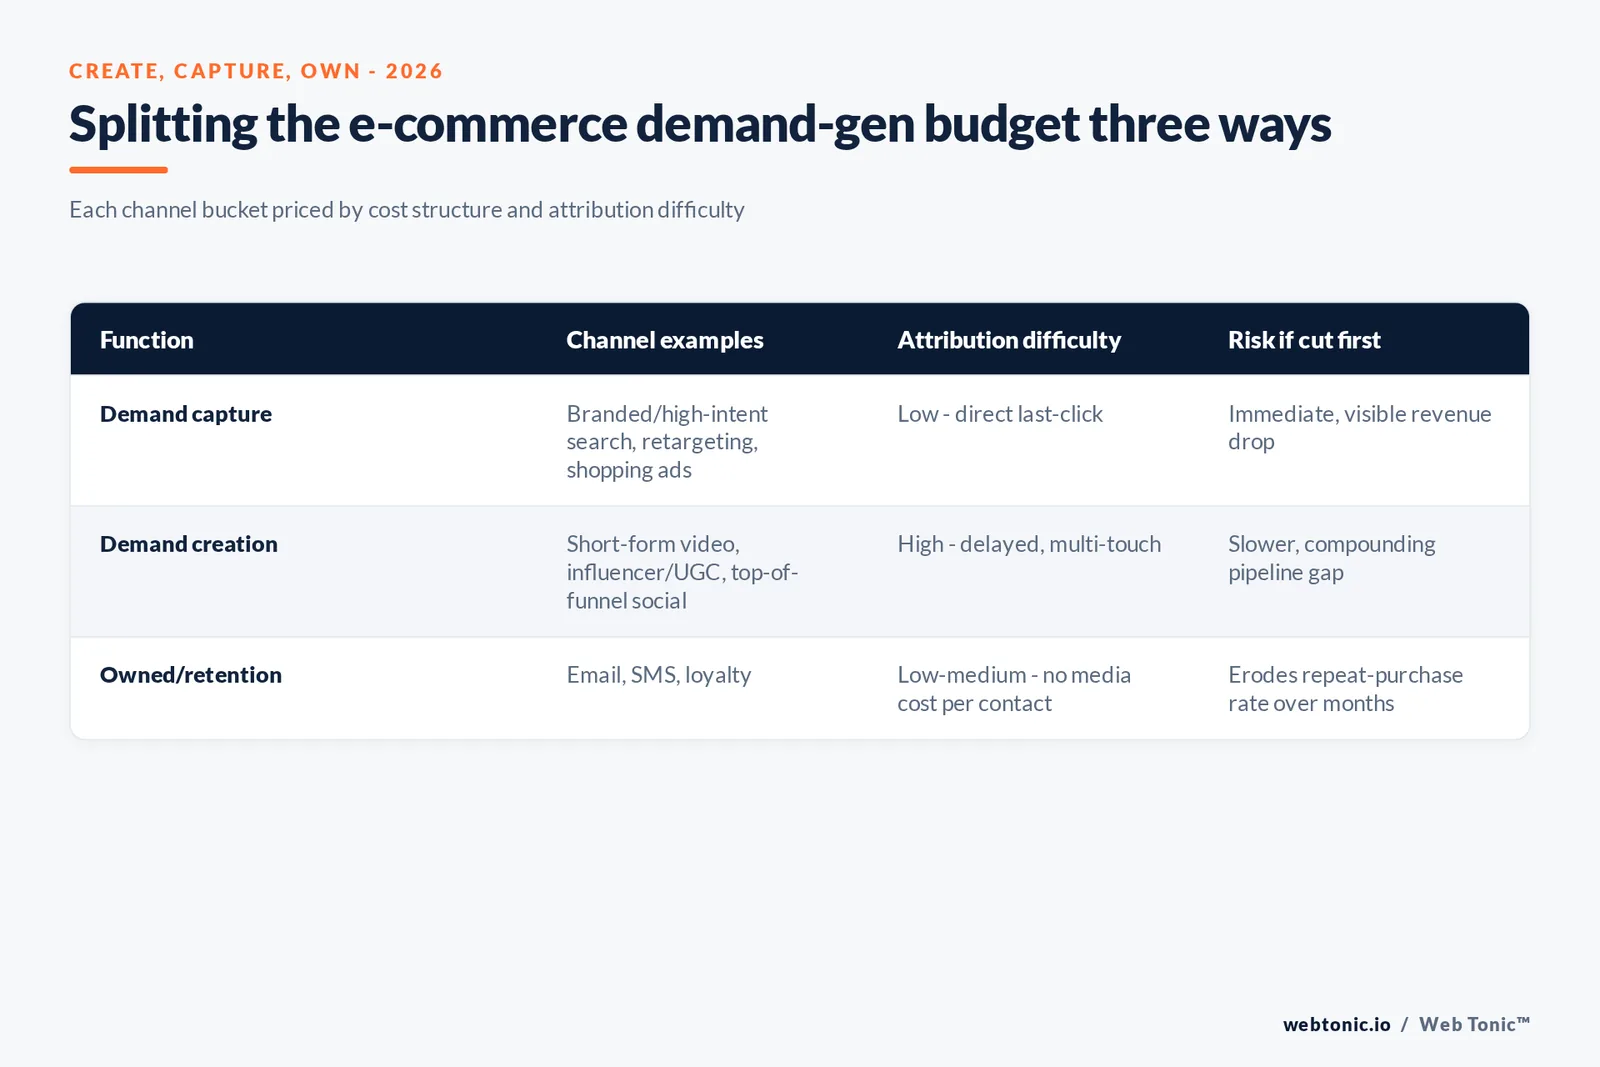
Demand capture spend meets people already searching - branded and high-intent non-branded paid search, retargeting, and comparison-shopping placements. Demand creation spend makes someone want the product before they were looking - short-form video, influencer and UGC content, and top-of-funnel paid social. The CMO Survey 2026 found overall marketing spend growth slowing to just 1.7% year over year, the smallest increase since 2021 - a climate in which capture spend, being easier to attribute directly to a sale, tends to get protected first, while creation budgets absorb the cuts.
The 95-5 rule, credited to Professor John Dawes of the Ehrenberg-Bass Institute and popularized by the LinkedIn B2B Institute, is a cross-industry B2B finding, not an e-commerce-specific one, but the underlying logic still applies to retail buying cycles: only a small share of a category is ready to buy in any given week, and a budget spent entirely on capture leaves the much larger not-yet-ready audience to a competitor's creation spend instead.
| Demand-gen function | Channel examples | Attribution difficulty | Budget risk if cut first |
|---|---|---|---|
| Demand capture | Branded/high-intent paid search, retargeting, shopping ads | Low - direct last-click credit | Immediate revenue drop, visible fast |
| Demand creation | Short-form video, influencer/UGC, top-of-funnel paid social | High - delayed, multi-touch | Slower, compounding pipeline shortfall |
| Owned/retention | Email, SMS, loyalty | Low-medium - platform-reported but not media-bought | Erodes repeat-purchase rate over months |
The owned channel that carries no media cost per contact
Klaviyo's 2026 Omnichannel Benchmark Report, drawn from data across more than 110,000 brands, and its dedicated 2026 email marketing benchmarks, drawn from over 183,000 Klaviyo customers, treat email and SMS as the highest-return owned channel precisely because the marginal cost of reaching an existing subscriber is a platform fee, not a media buy. Shopify's own 2026 ecommerce marketing guide names "email and SMS marketing" as the brand's "highest-ROI owned channel", ahead of paid search and paid social in its own recommended channel list - even though paid channels still typically carry the largest share of total demand-generation media dollars, since owned-channel reach is capped by list size in a way paid reach is not.
| Channel | Cost structure | Where it fits the funnel |
|---|---|---|
| Email/SMS (owned) | Platform fee, no per-contact media cost | Retention + repeat-purchase demand capture |
| Paid search (branded) | Cost per click on high-intent terms | Bottom-funnel demand capture |
| Paid social, prospecting | Cost per impression/click, broad targeting | Top/mid-funnel demand creation |
| Influencer/UGC content | Flat fee or commission, reused across paid and organic | Demand creation, feeds paid social creative |
| SEO/organic content | Largely fixed production cost, compounds over time | Category-wide demand creation, long horizon |
How to set the number without copying a bigger brand's percentage
Anchor the budget to the closest category match in the 2.2%-31.1% range, adjust for the brand's own gross margin and repeat-purchase rate rather than importing another category's figure wholesale, and protect a minimum share for demand creation even when capture spend is easier to defend in a budget review - the 1.7% overall spend growth The CMO Survey reported means most brands are not getting more budget to work with, only a harder allocation decision. Our growth marketing practice models that category-adjusted split, and our conversion rate data is a useful next check once the channel mix is set. For the GBP side of an e-commerce brand's local or showroom presence, see our separate e-commerce Google Business Profile data.
Frequently Asked Questions
What percentage of revenue should an e-commerce brand budget for demand generation?
Published 2026 figures cluster widely by business stage, so treat this as a range, not a target. Eightx's analysis of 12 public DTC and CPG 10-K filings puts average marketing spend at 13.3% of revenue, ranging from 2.2% up to 31.1% depending on category and growth stage - beauty CPG brands run near 26%, apparel DTC near 12%, food and beverage near 14%. Earlier-stage or growth-mode DTC brands commonly budget 15% to 25% of revenue, while established brands with strong organic and repeat traffic can run closer to 5% to 8%. The CMO Survey 2026's cross-industry benchmark of 9.0% of revenue is a reasonable floor for a mature retailer, not a ceiling for a brand still building demand.
What's the difference between demand creation and demand capture in e-commerce?
Demand capture is spend against people already searching for the product or brand - branded and high-intent non-branded paid search, retargeting, and comparison-shopping placements. Demand creation is spend that makes someone want the product before they were looking for it - social video, influencer and UGC content, and top-of-funnel paid social. Most e-commerce budgets skew toward capture because it is easier to attribute; the CMO Survey's finding that overall marketing spend growth has slowed to 1.7% is one reason brands increasingly protect capture budgets first and treat creation spend as the discretionary line that gets cut.
How much of the e-commerce demand generation mix is email and SMS versus paid channels?
Klaviyo's 2026 benchmark data, drawn from over 183,000 of its e-commerce customers, treats email and SMS as the highest-return owned channel precisely because it does not carry a media-buying cost per contact the way paid search or paid social does - the cost is the platform fee and the content, not the impression. That is why Shopify's own 2026 ecommerce marketing guide lists email and SMS as the 'highest-ROI owned channel' ahead of paid search and paid social, even though paid channels typically still carry the largest share of the total demand-generation media budget by dollars spent.
Is the overall e-commerce market still growing enough to justify higher demand-gen budgets?
Yes, on the US Census Bureau's own numbers: US retail e-commerce sales reached an estimated USD 340.2 billion in the second quarter of 2026, up 3.8% from the first quarter, and e-commerce accounted for 16.4% of total US retail sales in that quarter. That is real, measured category growth, which is the backdrop against which any individual brand's marketing-spend percentage should be judged - a flat percentage of revenue still buys a rising absolute media budget in a growing category.
Should a smaller e-commerce brand imitate the marketing-spend percentage of a large public DTC company?
No, and the 2.2%-to-31.1% range in the public 10-K data is the reason why - it reflects category, growth stage and gross margin, not a universal target. A beauty or supplement brand with high gross margins can sustain a 20%-plus demand-generation budget that would be unsustainable for a lower-margin home goods or electronics retailer. The more useful exercise than copying a percentage is reverse-engineering the implied customer acquisition cost against the brand's own margin and repeat-purchase rate.
Sources
US Census Bureau - Quarterly Retail E-Commerce Sales Report
Eightx - Average e-commerce marketing % of revenue by vertical, 2026
Shopify - Q1 2026 Financial Results (Merchants Clear USD 100 Billion in GMV)
Shopify - Ecommerce Marketing Guide for Online Stores, 2026
Klaviyo - 2026 Omnichannel Benchmark Report
Klaviyo - 2026 Email Marketing Benchmarks by Industry
The CMO Survey - Highlights and Insights Report 2026
LinkedIn B2B Institute - Why you should follow the 95-5 rule
Hinge Marketing - 2026 High Growth Study


