



Table of contents

Average dental practices retain 70% of patients; the top 10% retain 94%. That 24-point gap, reported in Henry Schein One's 2026 Catalyst Index, is the single clearest lifecycle number in dentistry, and it moves alongside case acceptance and no-show rate rather than in isolation. This page uses the trade's own recall and utilization data, not SaaS net revenue retention, to size what a lifecycle marketing program is actually working against.
Key Takeaways
- Average patient retention is 70%; top-decile practices hold 94% (Henry Schein One, 2026).
- Case acceptance runs 42% average versus 75% at the top decile.
- Average new-patient appointment lead time is 25 days versus 4.5 days at the top.
- Average no-show rate is 4%; top-decile practices hold it under 1%.
- 46% of the U.S. population visited a dentist in 2023, per the ADA Health Policy Institute.
- That is up from 45% in 2022, the prior year's ADA figure.
- 68% of adults report a dental visit in the past year against 82% for a medical visit (CareQuest, 2026).
- Only 40% of adults 19 to 64 saw a dentist in 2022, versus 51% of seniors and 52% of children.
- A 5-point retention gain can lift profit up to 95%, per Bain's long-standing (2006) finding.
- New-customer acquisition runs 5 to 25 times the cost of retention (Harvard Business Review, 2014).
- Average new-patient volume is 30 a month; top-decile practices see 81.
- 61% of healthcare practices report improved patient communication after automating in 2025 (Weave).
- 39% report fewer no-shows after the same automation (Weave, 2026 Pulse Survey).
- 60% of practices cite HIPAA and data-privacy concerns as their top automation risk.
- Weave's base patient-communication plan starts at USD 199 a month.
- A recall-and-reactivation bundle adds USD 149 a month on top of that base.
- 21% of dentists nationally is the ceiling case-acceptance gap the data implies against 75%.
- 30% of Medicaid beneficiaries visited a dentist in Ohio versus 65% of privately insured patients in Connecticut, showing how much geography still moves the baseline.
The benchmark that frames everything else
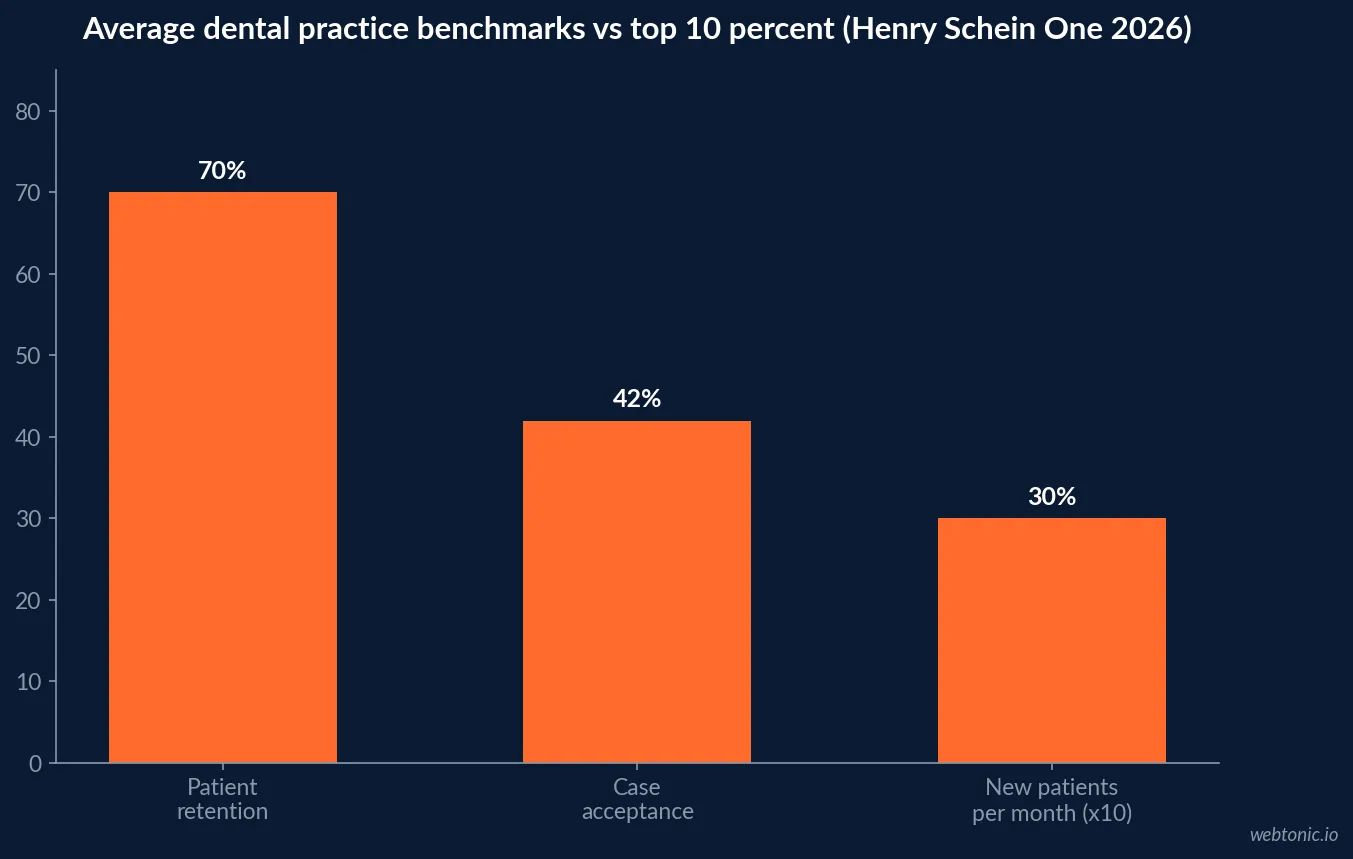
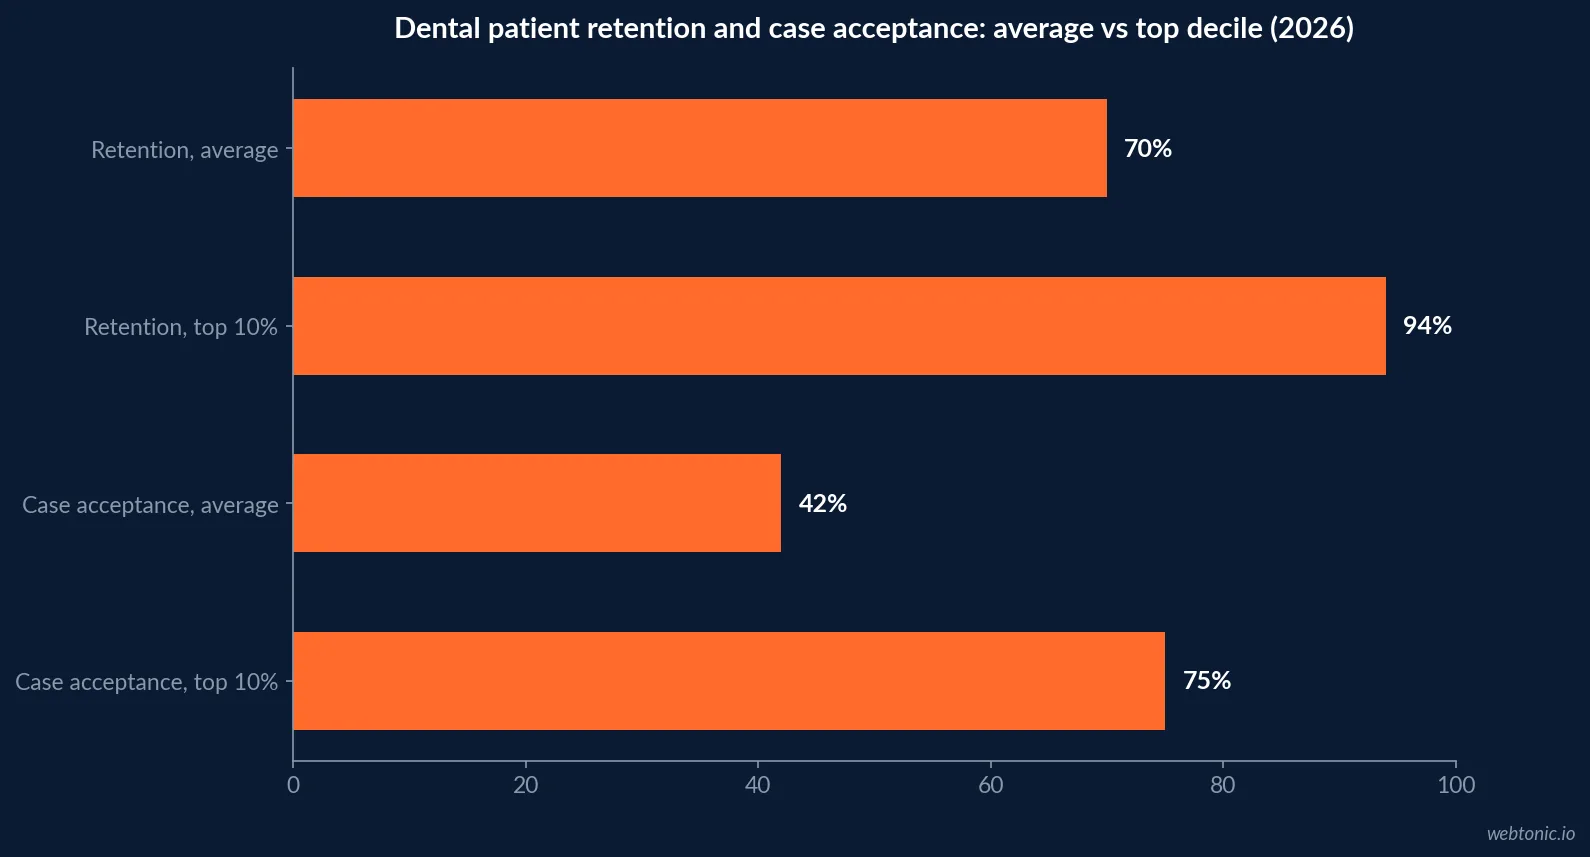
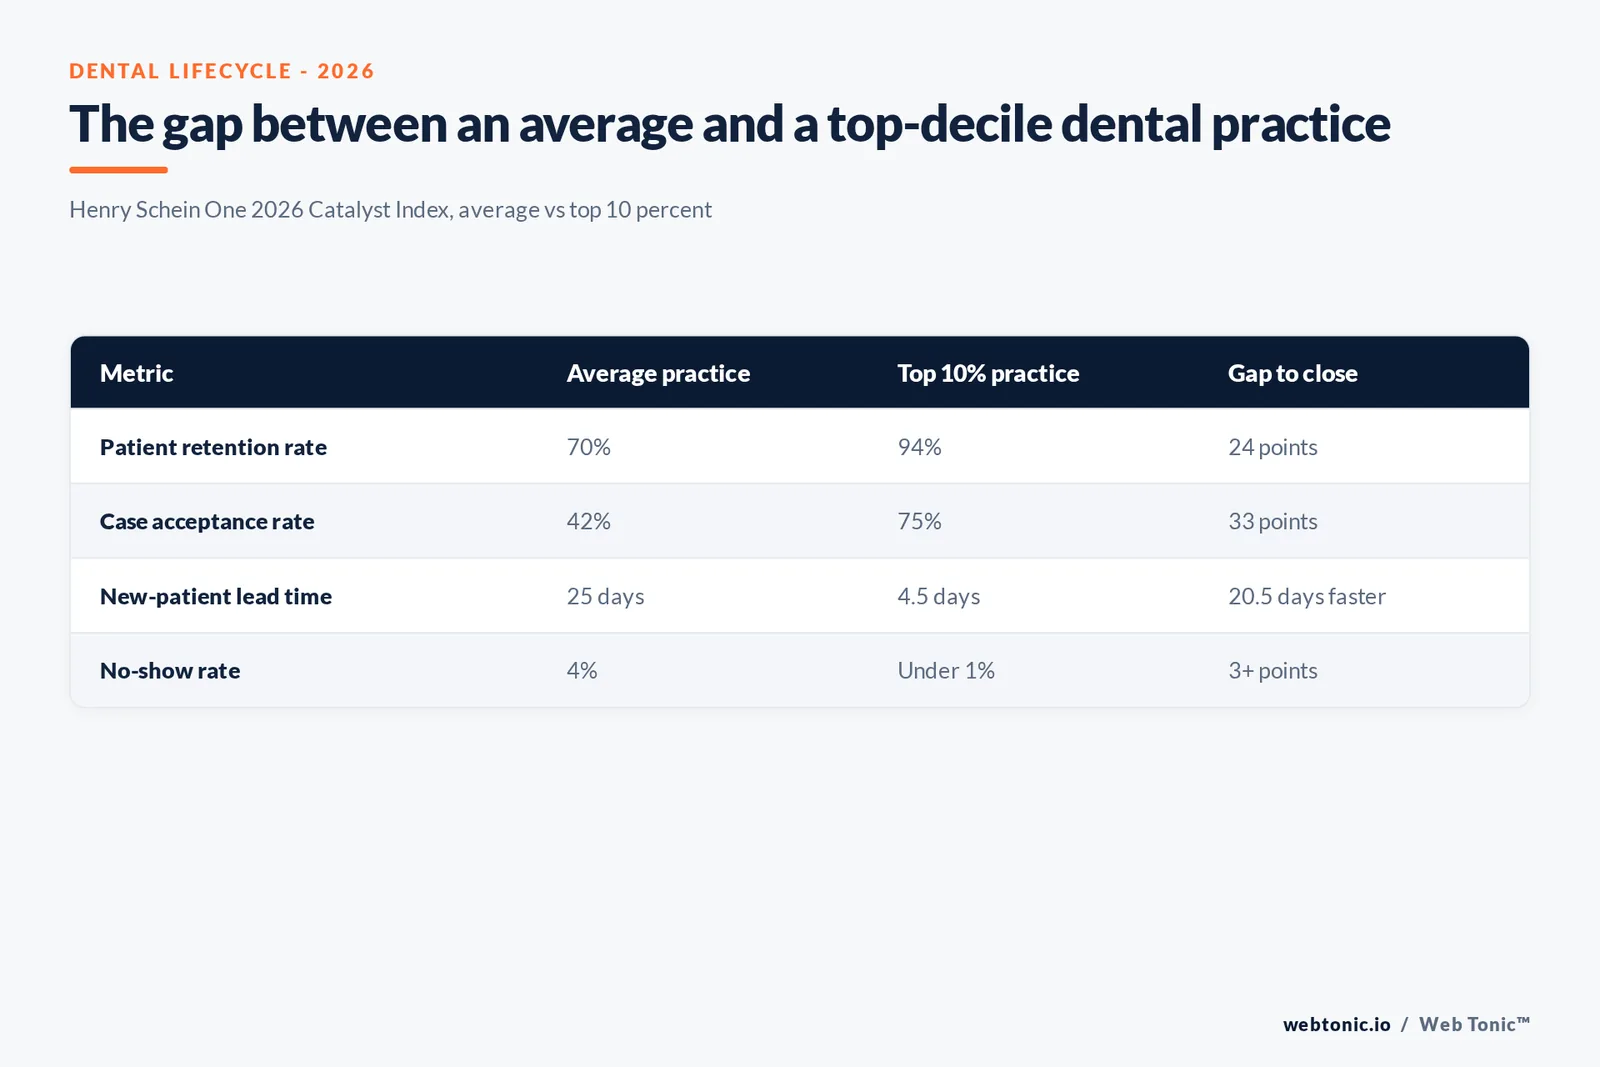
Henry Schein One's 2026 Catalyst Index benchmarks solo and small-group dental practices on five operating metrics. Average patient retention sits at 70%; the top 10% of practices hold 94%. The same top-decile group also converts treatment plans at 75% versus a 42% average, and gets new patients into a chair in 4.5 days versus a 25-day average lead time.
The pattern across all four metrics is the same: top-decile practices are not spending more on new-patient acquisition, they are executing consistently on the patients already in the schedule.
| Metric (2026) | Average practice | Top 10% practice | Source |
|---|---|---|---|
| Patient retention rate | 70% | 94% | Henry Schein One Catalyst Index |
| Case acceptance rate | 42% | 75% | Henry Schein One Catalyst Index |
| New-patient appointment lead time | 25 days | 4.5 days | Henry Schein One Catalyst Index |
| No-show rate | 4% | Under 1% | Henry Schein One Catalyst Index |
| New patients per month | 30 | 81 | Henry Schein One Catalyst Index |
How many patients are even in the recall pool
Retention only compounds if enough patients are visiting in the first place. The ADA Health Policy Institute's national trends report found 46% of the U.S. population visited a dentist in 2023, recovering to pre-pandemic levels and up from 45% in 2022. Utilization is uneven by age: only 40% of adults 19 to 64 saw a dentist in 2022, against 51% of seniors and 52% of children.
CareQuest's 2026 State of Oral Health Equity report finds 68% of adults report a dental visit in the past year, compared with 82% who report a medical visit - a 14-point gap that a recall program is directly built to close.
| Utilization fact | Figure | Year | Source |
|---|---|---|---|
| U.S. population visiting a dentist | 46% | 2023 | ADA Health Policy Institute |
| Prior-year utilization | 45% | 2022 | ADA Health Policy Institute |
| Adults 19-64 who saw a dentist | 40% | 2022 | ADA Health Policy Institute |
| Seniors who saw a dentist | 51% | 2022 | ADA Health Policy Institute |
| Adults reporting any dental visit | 68% | past year, 2026 | CareQuest Institute |
| Adults reporting any medical visit | 82% | past year, 2026 | CareQuest Institute |
Where Medicaid and geography widen the gap
The ADA's Medicaid-specific analysis shows how much state policy moves the recall baseline before marketing even touches it: among Medicaid beneficiaries who visited a dentist, 30% did so in Ohio compared with 65% among privately insured patients in Connecticut. A recall program built for one payer mix will not transfer cleanly to another state or plan type, so the honest benchmark to plan against is the practice's own prior year, not a national average.
Why the old retention math still matters, carefully labelled
Two widely cited figures predate dentistry entirely and should be read as a floor, not a practice-specific number. Bain & Company's long-standing finding, restated in a 2006 Bain insight, holds that a 5-percentage-point gain in retention can lift profit by as much as 95%. Harvard Business Review's 2014 article on customer value puts new-customer acquisition at 5 to 25 times the cost of retaining an existing one. Both numbers correlate with why the Henry Schein One gap between average and top-decile practices is worth closing before chasing new-patient volume - neither one proves dental-specific causation.
What automated recall is already changing
Weave's 2026 Pulse Survey of healthcare practices found that among respondents who operationalized automation in 2025, 61% report improved patient communication and responsiveness, 41% report improved team productivity, and 39% say automation reduced no-shows and last-minute cancellations - a figure that aligns directionally with the gap between the 4% average and sub-1% top-decile no-show rate above. The same survey found 60% of respondents cite HIPAA and data-privacy concerns as their top risk factor in adopting automated patient communication, which is the trade-off a recall program has to manage alongside the upside.
| Automation outcome (2025 activity, reported 2026) | Share of practices | Source |
|---|---|---|
| Report improved patient communication | 61% | Weave 2026 Pulse Survey |
| Report improved team productivity | 41% | Weave 2026 Pulse Survey |
| Report fewer no-shows and cancellations | 39% | Weave 2026 Pulse Survey |
| Cite HIPAA/privacy as the top adoption risk | 60% | Weave 2026 Pulse Survey |
| Cite AI producing low-quality work as a risk | 51% | Weave 2026 Pulse Survey |
What a recall program costs before it saves anything
Recall tooling is not free, and its cost belongs in the same lifecycle conversation as the retention number it is meant to move. Weave's own pricing page lists a base patient-communication plan starting at USD 199 a month, and Weave's plan builder prices a dedicated Coordinate bundle - covering online scheduling, recall and reactivation, and appointment confirmations - at an additional USD 149 a month on top of the base. Neither figure is a quote from Web Tonic; both are the vendor's own published rate.
| Recall tooling line item | Published monthly cost | What it covers | Source |
|---|---|---|---|
| Base patient-communication plan | USD 199 | Calling, texting, core platform | Weave pricing page |
| Coordinate bundle (add-on) | USD 149 | Recall, reactivation, confirmations | Weave plan builder |
A second benchmark agrees on the size of the gap
Dental Intelligence's own year-over-year benchmark report, drawn from its practice-management data set, shows the same pattern by a different metric. In 2024, the average practice's new-patient re-appointment rate - the share of new patients also booked for a future hygiene visit - sat at 48%, against 69% for the top 10% of practices and as low as 21% for the bottom 10%. Hygiene re-appointment, the recall metric closest to retention, ran 81% average versus 94% top decile in the same 2024 data.
| Benchmark (Dental Intelligence, 2024) | Bottom 10% | Average | Top 10% |
|---|---|---|---|
| New-patient re-appointment rate | 21% | 48% | 69% |
| Hygiene re-appointment rate | 61% | 81% | 94% |
| Treatment dollar case acceptance | 22% | 39% | 58% |
| Patient growth rate | -10.7% | 1.8% | 19.2% |
Two independently published 2026 and 2024 benchmark sets - Henry Schein One's Catalyst Index and Dental Intelligence's annual report - land on the same conclusion from different data sets: the spread between an average practice and a top-decile one is roughly 20 to 30 points on every recall-adjacent metric, and it shows up before a practice spends anything extra on new-patient acquisition.
What a fuller patient-engagement view tracks
Vendors building specifically for the dental recall workflow, such as Intiveo, describe their 2026 benchmark work as covering the full patient journey - recall, referrals, reviews, waitlist recovery, forms and chat - rather than a single confirmation-rate number. That broader framing matters for a lifecycle page specifically because no single metric in the tables above, taken alone, explains the retention gap; it is a chain of touch points, and a program that only automates recall reminders without also covering rebooking and reviews leaves most of the chain unmanaged.
Reading the gap without overclaiming
None of the figures above prove that recall automation alone produces the top-decile numbers - the Catalyst Index reports correlation across metrics that also depend on staffing, scheduling discipline and case-presentation training. What the data does support is a sequencing decision: a practice sitting near the 70% average, with 25-day lead times and a 4% no-show rate, has more unclaimed value in its existing patient list than in a new acquisition channel, alongside whatever it is already spending to source new patients.
Our growth marketing practice builds recall and reactivation sequences against a practice's own numbers rather than the national average, and our retention statistics roundup covers the cross-industry version of the same 5-to-25-times acquisition cost multiplier cited above.
Building the case for a recall budget
The sequence that follows from this data: pull the practice's own retention and case-acceptance numbers, compare them to the 70%/42% average and 94%/75% top-decile bands, price the gap in chair-time terms, then size a recall tool against that gap rather than against a vendor's sales deck. A practice already above the 70% average should weight new spend toward acquisition; one below it has cheaper gains waiting in its own patient list.
See our email marketing statistics page for the channel-level benchmarks behind a recall sequence, or talk to us about building one against your own numbers.
Frequently Asked Questions
Is dental patient retention closer to 70% or 94%?
Both, depending on the practice. Henry Schein One's 2026 Catalyst Index puts average patient retention at 70% across solo and small-group dental practices, with the top 10% of practices reaching 94%. The 24-point gap tracks almost exactly with the gap in case acceptance (42% average versus 75% top decile), which suggests the same operational discipline drives both numbers.
How often are patients actually visiting the dentist?
Less than half. The ADA Health Policy Institute's national trends report found 46% of the U.S. population visited a dentist in 2023, up from 45% in 2022. CareQuest's 2026 State of Oral Health Equity survey puts a full-year figure at 68% for adults who report any dental visit, against 82% who report a medical visit in the same period, so oral health still trails general health for recall follow-through.
What does a re-engaged patient recall program actually move?
Appointment lead time and no-show rate, mostly. Average practices book new patients 25 days out; the top decile books them in 4.5 days. Average no-show rate sits at 4%; top-decile practices hold it under 1%. Neither number moves from a single recall postcard - both track back to whether the front desk runs a standing recall and confirmation workflow.
Does the classic retention-versus-acquisition math still apply to a dental practice?
Directionally, yes, but the source is old and should be labelled as such. Bain & Company's long-standing finding - a 5-percentage-point gain in retention can lift profit by up to 95% - dates to Bain's original loyalty research and was restated in a 2006 Bain insight. Harvard Business Review's 2014 article on customer value puts new-customer acquisition at 5 to 25 times the cost of keeping an existing one. Neither is dental-specific, so treat them as a directional floor, not a practice benchmark.
Should a dental marketing budget favor new patients or recall of existing ones?
The Henry Schein One gap argues for recall first. A practice with 70% retention and a full recall workflow can close roughly a third of the gap to the top decile's 94% before it needs to spend anything on new-patient acquisition, because a recalled existing patient books faster (top decile: 4.5-day lead time) and shows up more reliably (top decile: under 1% no-shows) than a new lead sourced from paid channels.
Sources
Henry Schein One - 2026 Catalyst Index dental practice benchmarks
ADA Health Policy Institute - National Trends in Dental Care Use, 2026
CareQuest Institute - State of Oral Health Equity in America 2026, Key Findings
Bain & Company - Retaining customers is the real challenge
Harvard Business Review - The Value of Keeping the Right Customers, 2014
Weave - 2026 Pulse Survey press release
Weave - Pricing page
Weave - Plan builder
Dental Intelligence - 2024 Annual Dentistry Benchmarks
Intiveo - 2026 Dental Patient Engagement Report


