Table of contents

Apple Ads search results converted 65.82% of taps into downloads in 2025 at an 8.08% tap-through rate, while the average US App Store product page converted 8.56% of visitors - two different funnel stages that dental marketers routinely confuse. No study publishes dental-app CVR or CTR, so every benchmark below is cross-industry and labelled, then paired with the health-app rules a patient app has to follow.
Key Takeaways
- Apple Ads search results tap-through rate: 8.08% in 2025, down from 9.07% in 2024 (MobileAction).
- Search results tap-to-download conversion: 65.82% in 2025 against 66.70% in 2024.
- MobileAction's all-time search results conversion average is 63.95%.
- Browse placements convert far lower: 18.66% on the Today tab, 17.99% on product page ads.
- Custom product page ads: 1.72% TTR and 47.57% CR in 2025.
- Organic US page conversion averaged 8.56% on the App Store and 16.15% on Google Play (AppTweak).
- Apps using custom product pages converted taps at 58.7% versus 55.5% on the default page.
- Medical is a premium auction: USD 4.45 CPT and USD 8.90 CPA in SplitMetrics' 2025 data.
- 45% of Americans had a dental visit in 2022 (ADA HPI).
Two conversion rates, two funnel stages
App store "CVR" means different things depending on who reports it. MobileAction defines Apple Ads conversion as downloads divided by taps. AppTweak defines organic conversion as installs divided by product page views, and reports a separate install rate of 3.8% from App Store search or browse impressions. Apple itself, on its search results ads help page, describes more than a 60 percent average conversion rate for ads at the top of search results. A dental practice benchmarking its patient app has to pick the stage first.
| Funnel stage | Definition | Benchmark | Source (cross-industry) |
|---|---|---|---|
| Impression to install | Installs / search or browse impressions | 3.8% (US App Store, 2025) | AppTweak |
| Product page to install | Installs / page views | 8.56% App Store, 16.15% Google Play | AppTweak |
| Ad impression to tap | Taps / impressions | 8.08% search results ads, 2025 | MobileAction |
| Ad tap to download | Downloads / taps | 65.82% search results ads, 2025 | MobileAction |
| Ad tap to download, Apple's claim | Top-of-results ads | More than 60% | Apple Ads |
Search results ads: CTR and CVR year over year
MobileAction's 2026 Apple Ads benchmark report shows tap-through rate slipping to 8.08% in 2025 from 9.07% in 2024 while conversion held near two-thirds of taps. Its TTR breakdown places 2025 closer to the 2021-2022 range but still above the 2020 average of 7.80%. Cost per acquisition improved to USD 2.51 from USD 2.76.
| Apple Ads search results metric | 2024 | 2025 | Change |
|---|---|---|---|
| Tap-through rate | 9.07% | 8.08% | -0.99 points |
| Conversion rate (downloads / taps) | 66.70% | 65.82% | -0.88 points |
| Cost per acquisition | USD 2.76 | USD 2.51 | -USD 0.25 |
| Q4 cost per tap | Not compared | USD 1.88 | Highest quarter of 2025 |
| All-time conversion average | 63.95% | 63.95% | Long-run baseline |
CTR and CVR by ad placement
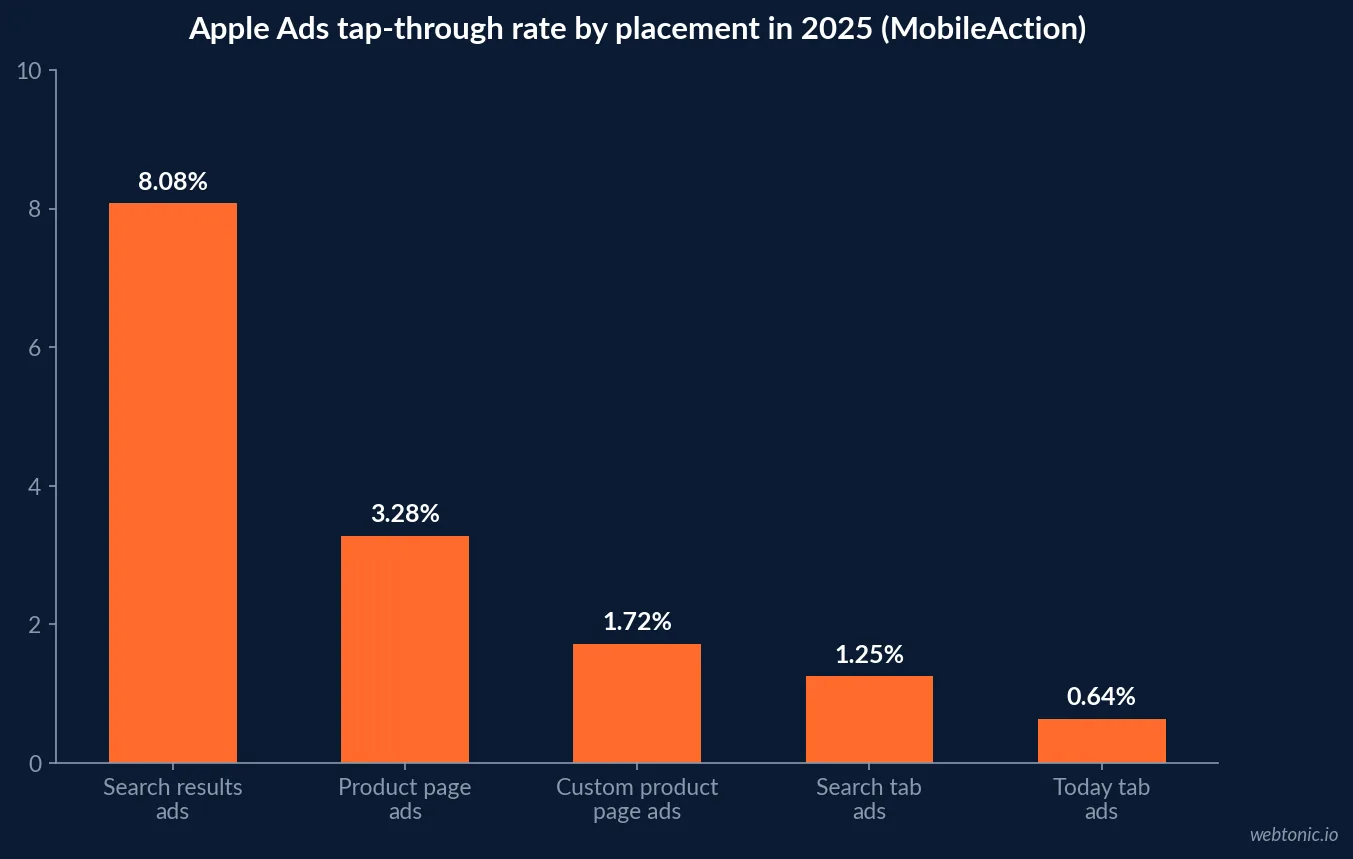
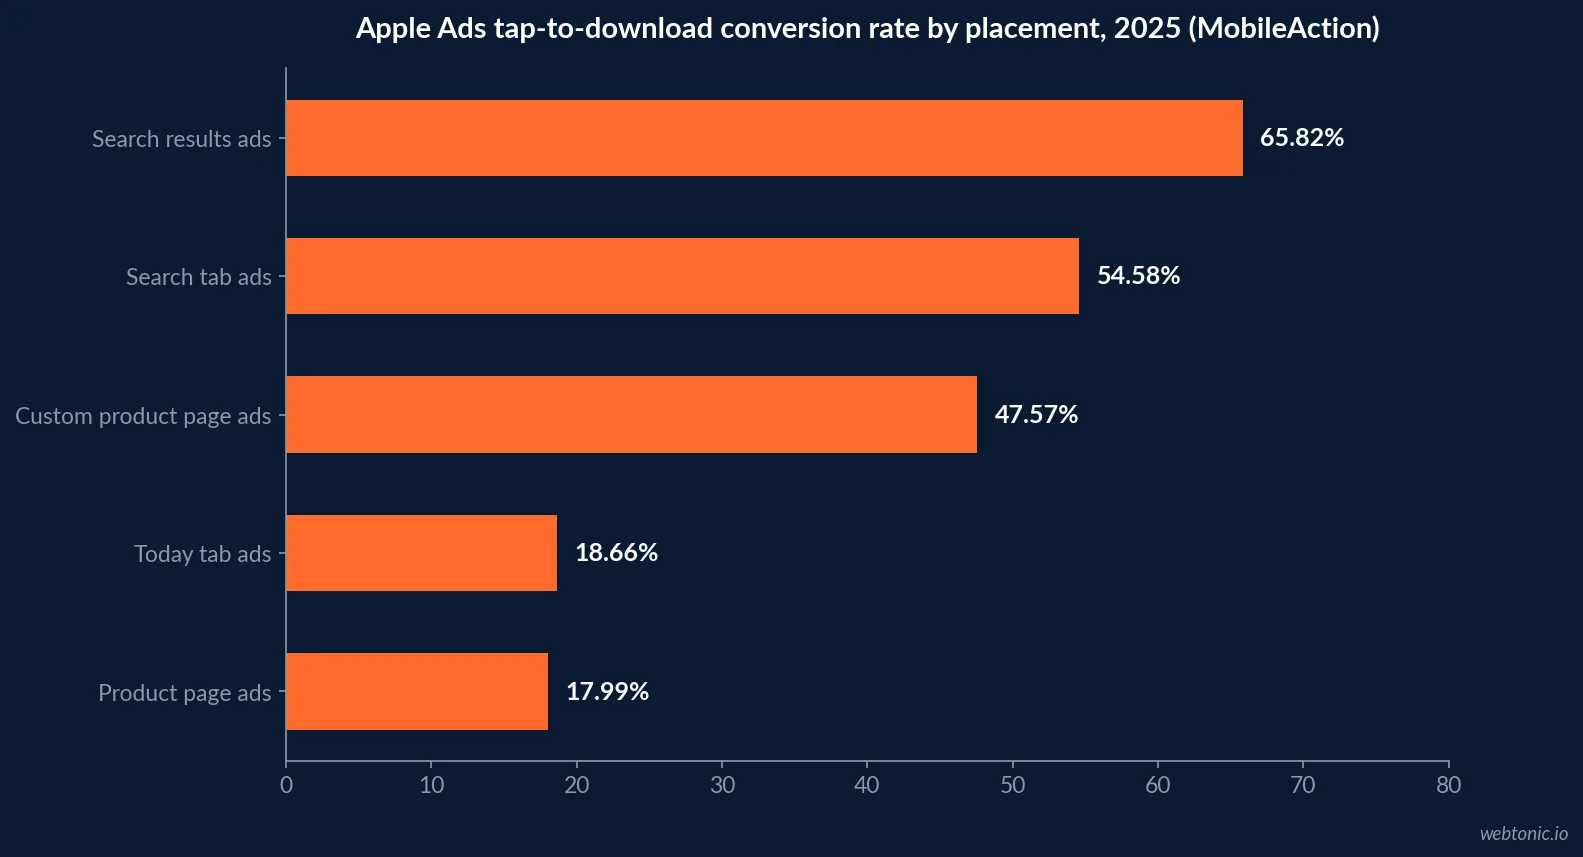
Placement changes both rates dramatically. MobileAction's 2025 data puts Search tab ads at 1.25% TTR and 54.58% CR, Today tab ads at 0.64% and 18.66%, and product page ads at 3.28% and 17.99%. Custom product page ad variations scaled from 6.56 billion to 15.80 billion impressions, at 1.72% TTR and 47.57% CR.
| Placement (2025) | Tap-through rate | Conversion rate | Cost per acquisition |
|---|---|---|---|
| Search results | 8.08% | 65.82% | USD 2.51 |
| Search tab | 1.25% | 54.58% | USD 1.81 |
| Custom product page variations | 1.72% | 47.57% | USD 3.07 |
| Today tab | 0.64% | 18.66% | Not stated |
| Product page ads | 3.28% | 17.99% | Not stated |
Category spread: where a dental app would sit
Apple's category definitions place medical record-keeping and patient health reference in Medical, and wellness routines in Health and Fitness. MobileAction's category tables do not report Medical, but SplitMetrics' 2025 Apple Ads benchmarks list Medical among the most expensive categories, at a USD 4.45 cost per tap and USD 8.90 cost per acquisition, against averages of USD 2.25 and USD 3.76 across its dataset. For contrast, MobileAction's 2025 category conversion rates ran from 72.51% in Games to 50.40% in Photo and Video.
| Category (Apple Ads, 2025) | Metric | Value | Publisher |
|---|---|---|---|
| Medical | Cost per tap | USD 4.45 | SplitMetrics |
| Medical | Cost per acquisition | USD 8.90 | SplitMetrics |
| All categories | Cost per acquisition | USD 3.76 | SplitMetrics |
| Business | Conversion rate | 67.22% | MobileAction |
| Education | Conversion rate | 61.63% | MobileAction |
| Photo and Video | Conversion rate | 50.40% | MobileAction |
Custom product pages lift tap conversion modestly
AppTweak's 2026 trends report found apps using custom product pages in Apple Ads converted taps at 58.7% against 55.5% on the default page, yet 61% of apps ran none in 2025. For a dental group, separate pages for "book a cleaning", "Invisalign check-ins" and "pay my bill" match the reason a patient tapped.
Health-app rules that shape the listing
Apple's App Review Guidelines state in 1.4.1 that medical apps that could provide inaccurate data or be used for diagnosing or treating patients may be reviewed with greater scrutiny. Google's Health Content and Services policy requires every developer to complete the Health apps declaration in Play Console and post a privacy policy. For a US practice, the HIPAA Privacy Rule, 45 CFR 164 Subpart E governs protected health information, and the FTC endorsement guides, 16 CFR Part 255 govern testimonials and reviews used in marketing.
| Rule | Issuer | What it means for a dental app listing |
|---|---|---|
| Guideline 1.4.1 | Apple | Greater review scrutiny for apps that could diagnose or treat |
| Health apps declaration | Google Play | Mandatory Play Console form plus privacy policy |
| 45 CFR 164 Subpart E | HHS via eCFR | Uses and disclosures of protected health information |
| 16 CFR Part 255 | FTC via eCFR | Disclose material connections behind endorsements |
Dental demand the app can tap into
The ADA Health Policy Institute reports that in 2022 45% of the US population had a dental visit in the past 12 months, including 52% of children and seniors and 40% of working-age adults. That is the realistic installed base for a practice app: existing patients, reached through appointment reminders and front-desk prompts, not strangers searching the App Store for "dentist".
That distinction changes which benchmark applies. A patient who taps a link in a reminder text lands on the product page already knowing the practice, so page-view conversion should sit well above AppTweak's 8.56% App Store average; if it does not, the listing - screenshots, rating, privacy label - is losing people the practice had already won. Apple Ads benchmarks, by contrast, describe strangers arriving from a keyword. A practice that never buys store ads can ignore the 8.08% tap-through and 65.82% conversion figures except as context. The metric that belongs in the practice's own dashboard is simpler: the share of active patients who have the app installed and use it to book or pay, a figure only the practice's scheduling system can supply. For patient acquisition, compare the dental connected TV data and dental influencer and UGC figures.
How to benchmark a dental patient app
- Pick the stage: page-view CVR for organic, tap CR for Apple Ads.
- Compare against the store you are on - 8.56% App Store, 16.15% Google Play.
- Split traffic by source: links from patient emails convert differently from store search.
- Run Apple product page tests (up to three treatments, 90 days) only if traffic allows.
- Keep patient data out of screenshots, reviews and promotional text.
What moves product page conversion
Store benchmarks describe outcomes; the levers are the listing assets. AppTweak's 2026 report found 54% of top US apps refreshed App Store screenshots twice or more in 2025, making screenshots the most-updated element, and around 95% of featured App Store apps carry a rating of 4.0 or higher - 65% sit at 4.6 or higher. For a dental patient app the equivalent levers are concrete: screenshots that show online booking and reminders in the first two frames, a subtitle that names the practice and city, and a steady flow of ratings from patients who just finished an appointment.
Apple's product page optimization lets a practice test up to three treatments of icon, screenshots and previews against the original page, for up to 90 days, with Apple estimating the traffic needed for 90% confidence. A single-location practice will rarely have the traffic to finish a test; a dental service organisation with a shared app across dozens of offices might.
| Listing lever | 2025 data point | Publisher | Dental application |
|---|---|---|---|
| Screenshots | 54% of top apps updated 2x or more | AppTweak | Lead with booking and reminders |
| Ratings | About 95% of featured apps at 4.0+ | AppTweak | Ask after completed visits |
| High ratings | 65% of featured apps at 4.6+ | AppTweak | Reply to every review |
| Custom product pages | 58.7% vs 55.5% tap conversion | AppTweak | One page per treatment line |
| Native A/B test | Up to 3 treatments, 90 days | Apple | Realistic only at group scale |
Device mix behind the benchmarks
Statcounter puts iOS at 60.68% of US mobile web traffic in August 2026, which is why most Apple-side benchmarks above matter more to a US practice than their Android equivalents. Google Play still reached a higher average page conversion in AppTweak's data, 16.15%, so a practice that publishes on both stores should read each store against its own benchmark rather than blend them into one number.
Methodology and limits
Apple Ads figures come from MobileAction's and SplitMetrics' own 2025 campaign datasets, both vendors, both cross-industry. Organic conversion comes from AppTweak's 2025 category benchmarks. Rules are quoted from Apple, Google and eCFR pages opened in September 2026. We found no published dental-app CVR or CTR and did not estimate one. Broader context: app store optimization statistics.
Frequently Asked Questions
What is a good conversion rate for a dental app's App Store page?
No source publishes a dental benchmark. The closest cross-industry numbers are AppTweak's 2025 averages of 8.56% on the US App Store and 16.15% on US Google Play for page view to install. A practice app aimed at existing patients who arrive from a link in an appointment email should beat those averages, because the visitor already intends to install.
What click-through rate do App Store ads get?
Apple calls it tap-through rate. MobileAction measured 8.08% for search results ads in 2025, down from 9.07% in 2024, with much lower rates on browse placements: 1.25% on the Search tab, 0.64% on the Today tab and 3.28% on product page ads. These are cross-industry figures from MobileAction's client data.
Why is Apple Ads conversion so much higher than organic conversion?
They measure different stages. Apple Ads conversion is downloads divided by taps on an ad - 65.82% for search results ads in 2025 per MobileAction - so the user has already chosen the app once. Organic conversion is installs divided by product page views. Mixing the two makes a healthy listing look broken, or a weak one look strong.
Does HIPAA apply to a dental patient app?
If the app creates, receives or transmits protected health information for a covered dental practice, the HIPAA Privacy Rule at 45 CFR Part 164 Subpart E governs uses and disclosures, and the app vendor usually works under a business associate agreement. App store screenshots and reviews must never expose patient details.
Can a dental app show patient testimonials in its store listing?
Yes, within the FTC's endorsement guides at 16 CFR Part 255, which require disclosure of material connections - for example a discount given for a review - and within Apple's guideline 1.4.1, which applies greater scrutiny to medical apps that could provide inaccurate data or be used for diagnosing or treating patients.
Sources
MobileAction - Apple Ads 2026 benchmark report
SplitMetrics - Apple Ads cost benchmarks
AppTweak - average conversion rate by category
AppTweak - ASO trends report 2026
Apple Ads - search results help
Apple - App Review Guidelines
Google Play - Health Content and Services
eCFR - 45 CFR 164 Subpart E
eCFR - 16 CFR Part 255
ADA HPI - dental care market