Table of contents

Key Takeaways
- 67% of organizations now use dashboards for strategic decision-making, up from 55% just two years ago, yet countertop fabrication shops lag significantly behind this adoption curve.
- 92% of marketers use automation for data analysis and reporting, making manual spreadsheet-based tracking increasingly obsolete across all industries including home services.
- 55% of marketing teams rely on real-time dashboards for campaign monitoring and budget allocation, reducing reaction time from days to hours.
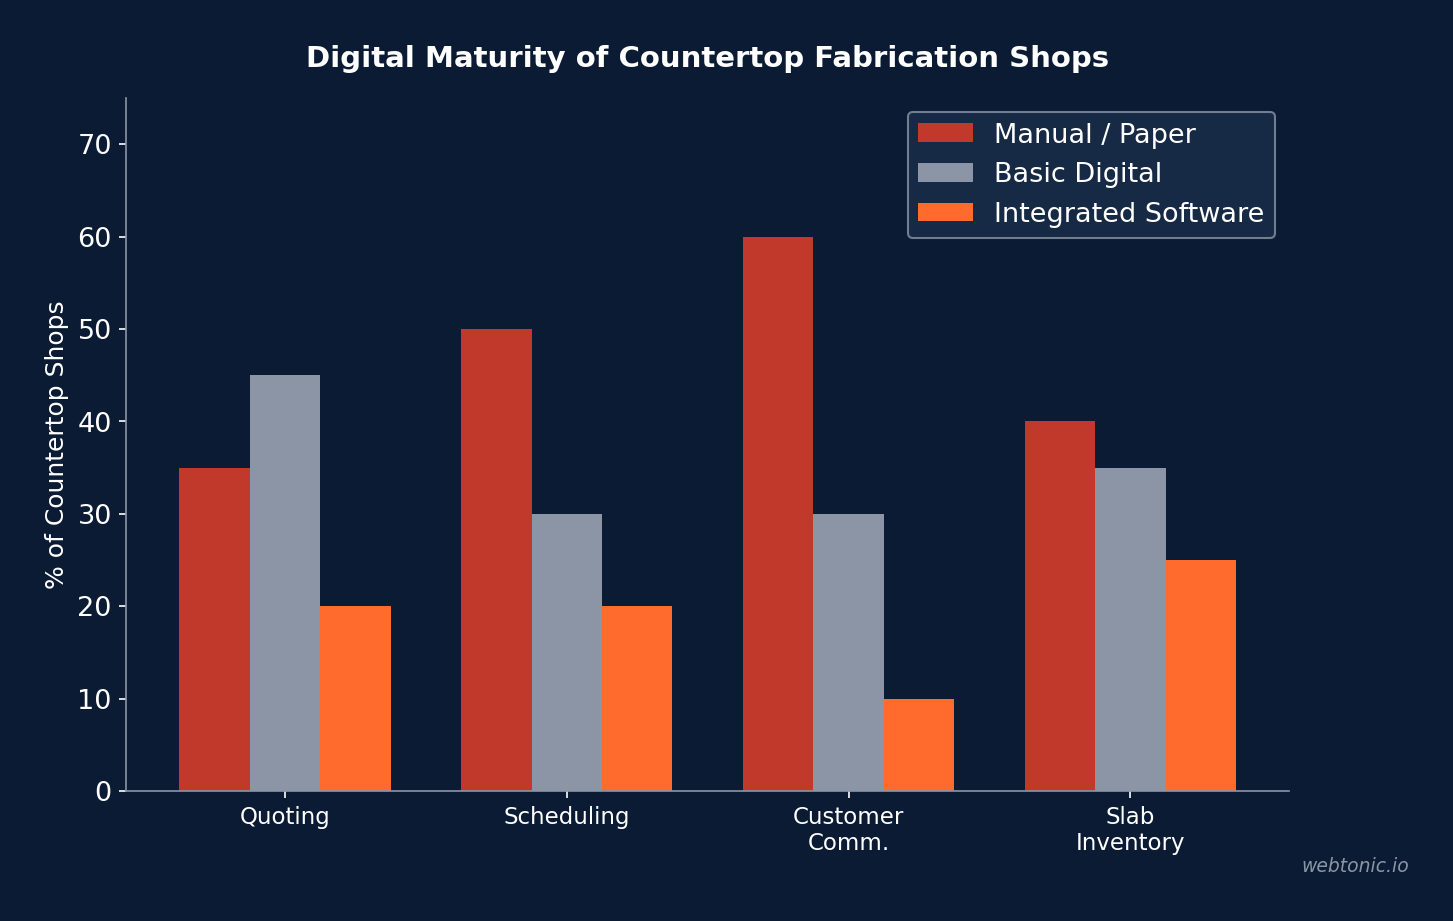
- Only 20% of countertop shops use integrated software for quoting, with 35% still fully manual and 45% on basic spreadsheets.
- Shops with a working CRM close 5–15% more qualified leads, translating to an additional $200K in revenue on a $2M operation.
- 87% of marketing leaders say data-driven decisions are critical to strategy, but 41% still cannot measure marketing effectively across channels.
Countertop Marketing Dashboard Benchmarks at a Glance
| Metric | Benchmark | Source |
|---|---|---|
| Dashboard Adoption (All Industries) | 67% | Gitnux, 2026 |
| Real-Time Dashboard Usage (Marketing) | 55% | Gitnux, 2026 |
| Automation for Reporting | 92% | Blondish, 2026 |
| Data-Driven Decision Priority | 87% | Digital Applied, 2026 |
| Cannot Measure Cross-Channel | 41% | Supermetrics/Konabayev |
| Countertop Avg. Conversion Rate | 2.9% | CuFinder, 2026 |
| Top-10% Conversion Rate | 6.5% | CuFinder, 2026 |
| CRM Close Rate Improvement | +5–15% | SlabWise, 2026 |
| ROI as Top Metric | 63% | Supermetrics/Konabayev |
| Email Open Rate (B2B Countertops) | 26% | CuFinder, 2026 |

Marketing Dashboard Adoption Trends in 2026
Marketing dashboards have shifted from luxury tools to operational necessities. Gitnux's 2026 dashboard statistics report reveals that 67% of organizations now use dashboards for strategic decision-making, up from approximately 55% in 2024. The marketing dashboard market itself reached $650 million in 2023 and continues growing as teams demand real-time visibility into campaign performance.
The acceleration is driven by three forces: the proliferation of marketing channels requiring unified views, the commoditization of dashboard platforms, and executive demand for data-backed budget justification. WiFi Talents' research confirms that 78% of executives now use dashboards for decision-making, and technical usage has increased 40% year-over-year as more team members beyond managers interact with live data.
For the countertop industry specifically, dashboard adoption is less mature. While all-industry benchmarks show majority adoption, SlabWise's digital transformation survey shows that only 20% of countertop shops use integrated software for key workflows like quoting and scheduling. The remaining shops rely on spreadsheets or manual processes, making unified marketing dashboards even rarer. This gap represents a significant competitive advantage for fabricators who invest in data intelligence infrastructure.
The Data-Driven Marketing Gap in Countertop Businesses
Digital Applied's 140-point analytics survey found that 87% of marketing leaders say data-driven decisions are critical to strategy — yet execution lags behind aspiration. The Funnel.io 2026 Marketing Intelligence Report found that 80%+ of all marketers say they lack a clear signal to understand what is actually working in their campaigns.
The measurement gap is quantified by Konabayev's analytics statistics: 41% of marketers cannot measure marketing effectively across channels, while 63% rank ROI as their top metric — a disconnect between what teams want to measure and what they can actually track. For countertop businesses running campaigns across Google, Meta, Instagram, and showroom events simultaneously, this cross-channel visibility challenge is particularly acute.
The solution lies in purpose-built reporting that connects marketing activity to booked jobs. ConstructoMarketing's remodeling ROI guide outlines the metrics that matter for home improvement businesses: marketing spend by channel, leads by source, proposals generated, won jobs tied to source, and attributed revenue. Most countertop businesses track at most two of these five metrics, leaving enormous visibility gaps that prevent optimization.
KPI Tracking Standards for Countertop Fabricators
SlabWise's monthly KPI checklist defines the performance metrics every fabrication shop should track: revenue, waste rates, lead conversion, and production efficiency. These operational KPIs form the foundation for meaningful marketing dashboards — without them, marketing data exists in a vacuum disconnected from business outcomes.
| KPI Category | Key Metrics | Dashboard Frequency |
|---|---|---|
| Lead Generation | CPL by channel, lead volume, form vs. call ratio | Weekly |
| Conversion | Quote-to-close rate, avg. project value, days to close | Weekly |
| Revenue Attribution | Revenue by source, ROAS by channel, MER | Monthly |
| Campaign Performance | CTR, CPC, impression share, Quality Score | Daily/Weekly |
| Website Analytics | Traffic by source, bounce rate, page CVR, mobile % | Weekly |
| Email Marketing | Open rate (26% B2B avg), CTR (2.8%), unsubscribe rate | Per campaign |
| Production Efficiency | Waste %, remakes ($1.5K–$4K each), on-time delivery | Weekly |
The email marketing benchmarks are particularly relevant for countertop dashboard design. CuFinder's industry data shows countertop B2B email open rates average 26% versus 21% for B2C, with an overall email CTR of 2.8% and new-arrival campaigns hitting 4.5% CTR. These benchmarks belong on every fabricator's marketing dashboard as reference lines against which actual performance is measured.
CRM and Reporting Platform Adoption in the Stone Industry
CRM platforms serve as the backbone of marketing dashboards for countertop businesses, connecting lead data to project outcomes. SlabWise's CRM ranking identifies the core reporting capabilities that stone-industry CRMs provide: lead source tracking, pipeline visibility, quote-to-close analysis, and revenue attribution by channel.
Stone World's CRM analysis emphasizes that shops using CRMs report up to 300% improvements in lead conversion rates. The visibility alone drives this improvement — when a shop can see every open quote, how long it has been sitting, and what the next step is, the sales process accelerates. Dashboard integration makes this visibility passive rather than requiring manual lookups, enabling managers to spot bottlenecks in the pipeline within seconds.
The technology stack required for effective countertop reporting has expanded. SlabWise's tech stack guide documents the components: countertop-specific CRM, digital templating tools (now used by 45–50% of US fab shops, up from 30% in 2022), production management software, and marketing analytics platforms. The integration challenge is connecting these systems into a unified reporting view that shows the full picture from ad click to completed installation.
Automation and Real-Time Reporting Statistics
Blondish's marketing analytics survey documents near-universal automation adoption: 92% of marketers now use automation for data analysis and reporting. This shift from manual spreadsheet compilation to automated dashboards saves an estimated 4–8 hours per week for marketing teams, freeing capacity for strategy and optimization.
Real-time reporting has become the standard expectation. 55% of marketing teams rely on real-time dashboards for campaign monitoring and budget allocation, according to Gitnux. For countertop businesses running Google Ads and Meta campaigns simultaneously, real-time visibility means catching a budget overrun or underperforming campaign before it wastes hundreds of dollars rather than discovering the issue in a weekly report.
The analytics infrastructure powering these dashboards processes enormous data volumes. Marketing dashboards analyze 1.8 billion social posts daily across platforms, per WiFi Talents — a scale that makes manual monitoring impossible. While individual countertop businesses deal with far smaller data sets, the automated tools built for enterprise use have trickled down to SMB-accessible pricing, making sophisticated reporting available to fabricators at $100–$500/month rather than the $5K+/month enterprise dashboards commanded five years ago.
Countertop Dashboard Metrics vs. All-Industry Averages
| Metric | Countertops | All-Industry Avg. | Gap |
|---|---|---|---|
| Dashboard Adoption | ~20% | 67% | −47pp |
| Automated Reporting | ~25% | 92% | −67pp |
| Real-Time Data Access | ~15% | 55% | −40pp |
| CRM Usage | ~20% | 55% | −35pp |
| Cross-Channel Measurement | ~10% | 59% | −49pp |
| Conversion Rate | 2.9% | 3.6% | −0.7pp |
The dashboard adoption gap in the countertop industry is among the widest in home services. While 67% of organizations globally use dashboards for decision-making, countertop fabricators sit around 20%. This creates a data-driven advantage for early adopters who can see which channels produce booked projects, optimize spend in real time, and document ROI to justify marketing budgets — all while competitors operate on gut instinct and monthly spreadsheet reviews.
Building a Data-Driven Reporting Stack for Countertop Shops
- Start with CRM lead source tracking. Every lead entering your pipeline should be tagged with its originating channel (Google, Meta, referral, home show). This single action transforms your CRM from a contact database into an attribution tool — and Meta Ads conversion data becomes actionable.
- Connect Google Analytics 4 to your dashboard. GA4's event-based tracking captures quote form submissions, phone clicks, gallery views, and AR visualizer usage. CuFinder's data shows pages with AR tools convert at 6.5%, and without GA4 event tracking, this insight is invisible.
- Automate weekly reporting. With 92% of marketers already using automated reporting, manual compilation is not competitive. Platforms like Looker Studio, Databox, or industry-specific tools like Milia Analytics create auto-refreshing dashboards at $100–$300/month.
- Track cost per booked project, not just CPL. The gap between a $65 social CPL and a $88 search CPL narrows dramatically when search leads close at higher rates. Your dashboard should show cost per signed contract by channel, updated monthly.
- Set benchmark alerts. When your conversion rate drops below the 2.9% industry average or email open rates fall below 23.5%, automated alerts ensure the team investigates immediately rather than discovering the decline weeks later.
- Review production KPIs alongside marketing KPIs. Waste rates ($1,500–$4,000 per remake), on-time delivery, and installation efficiency directly impact customer satisfaction and referral rates. A truly integrated dashboard connects marketing performance to operational outcomes.
The ROI of Reporting Infrastructure Investment
Investing in marketing dashboards delivers returns through three mechanisms: waste elimination, speed-to-optimization, and budget justification. When a countertop fabricator can see in real time that their Google Ads campaign is generating clicks at $12 CPC but only 1.2% conversion — below the 2.9% industry average — they can pause and redirect that spend within hours rather than discovering the underperformance in a monthly review.
The waste factor is substantial. PipelineOn's 2026 benchmarks show that the average Google Ads CPL across home services is $90.92, with roofing at $228.15 and plumbing at $76.40. For countertop businesses spending $5K–$15K/month on paid channels, even a 15% improvement in lead quality through dashboard-driven optimization saves $750–$2,250 monthly — more than enough to cover the entire reporting platform cost.
Speed-to-lead is another dashboard-driven advantage. BaaDigi's contractor benchmarks found that 37% of businesses respond to leads within 60 minutes, and those who respond first are 7x more likely to qualify leads. Dashboards with real-time lead alerts ensure countertop shops respond to quote requests within minutes rather than hours, directly improving close rates and maximizing the return on paid media investment.
Data Quality Challenges in Countertop Marketing Reporting
Even with dashboards in place, data quality determines reporting value. The Funnel.io 2026 Marketing Intelligence Report revealed that more than 80% of all marketers surveyed say they do not have a clear signal that helps them understand what is actually working. The problem is not a lack of data — it is fragmented, inconsistent, and unlabeled data flowing into dashboards without structure.
For countertop businesses, common data quality issues include: mismatched UTM parameters across campaigns, phone leads not attributed to digital channels, showroom walk-ins with no source tag, and CRM entries without lead source information. SlabWise's digital transformation data confirms that 60% of shops handle customer communication manually, meaning most lead interactions happen outside any trackable system.
The solution involves establishing data standards before building dashboards. Every lead entry needs a source tag (Google, Meta, referral, home show, contractor), every campaign needs consistent UTM parameters, and every phone line needs call tracking with source attribution. Without these foundations, even the most sophisticated dashboard displays unreliable data — and decisions based on bad data are worse than decisions based on experience alone. Countertop fabricators should allocate 2–4 weeks to data cleanup and standardization before launching any marketing dashboard.
Frequently Asked Questions
What KPIs should countertop businesses track on a marketing dashboard?
The essential KPIs are cost per lead by channel, quote-to-close rate, average project value, and revenue attributed by marketing source. Secondary metrics include website conversion rate (target 2.9%+ per industry average), email open rate (26% B2B benchmark), and phone call connection rate. The most actionable dashboard format shows these metrics by week with trend indicators, allowing fabricators to spot changes before they impact revenue.
How much does a marketing dashboard cost for a countertop business?
Expect $100–$500/month for a functional marketing dashboard stack. This includes a CRM platform ($50–$200/month), analytics dashboard tool ($50–$150/month), and potentially call tracking integration ($200–$500/month). Free options like Google Looker Studio work for basic reporting, but lack the automated data connections and alerts that make dashboards operationally useful for busy fabrication shops.
Why do most countertop shops not use marketing dashboards?
Three barriers slow adoption: technical complexity, small team size, and perceived cost. With only 20% of shops on integrated software for basic operations like quoting, marketing analytics represents an even further stretch. However, the ROI is clear — shops with CRMs close 5–15% more leads, and those with automated dashboards identify and fix underperforming campaigns weeks faster than competitors relying on manual reviews.
What is the best reporting frequency for countertop marketing?
Weekly reporting balances timeliness with statistical significance. Daily campaign monitoring catches budget overruns, but meaningful conversion trends require 7+ days of data given the lower lead volumes typical in the countertop industry. Monthly reporting is too slow for paid campaigns where a single week of poor performance can waste thousands of dollars. The ideal cadence for most countertop fabricators is daily budget and spend checks via automated alerts, weekly performance reviews in a team meeting, and monthly strategic analysis including revenue attribution by channel and cost per booked project calculations.
How do countertop dashboards differ from general marketing dashboards?
Countertop dashboards must bridge the online-to-offline gap — connecting ad clicks to showroom visits, samples requested, quotes sent, and installations completed. General marketing dashboards track digital metrics only. Countertop-specific dashboards also need production metrics (waste rates costing $1,500–$4,000 per remake, on-time delivery percentages, installation efficiency) and contractor referral tracking that do not exist in standard SaaS marketing tools. A well-designed countertop dashboard connects the marketing funnel to operational outcomes, showing whether marketing-sourced leads convert differently from referral leads and whether specific project types generated by different channels produce different margin profiles for the business.
Sources
gitnux.org/dashboard-statistics
digitalapplied.com/blog/marketing-analytics-statistics-2026
konabayev.com/blog/marketing-analytics-statistics
blondish.net/marketing-analytics-statistics
cufinder.io/blog/benchmarks/countertop-manufacturing
slabwise.com/checklist/monthly-kpi-review
slabwise.com/guide/digital-transformation
constructomarketing.com/how-to-calculate-marketing-roi
stoneworld.com — your-crm-should-be-the-single-source-of-truth
slabwise.com/best/countertop-crm