



Table of contents
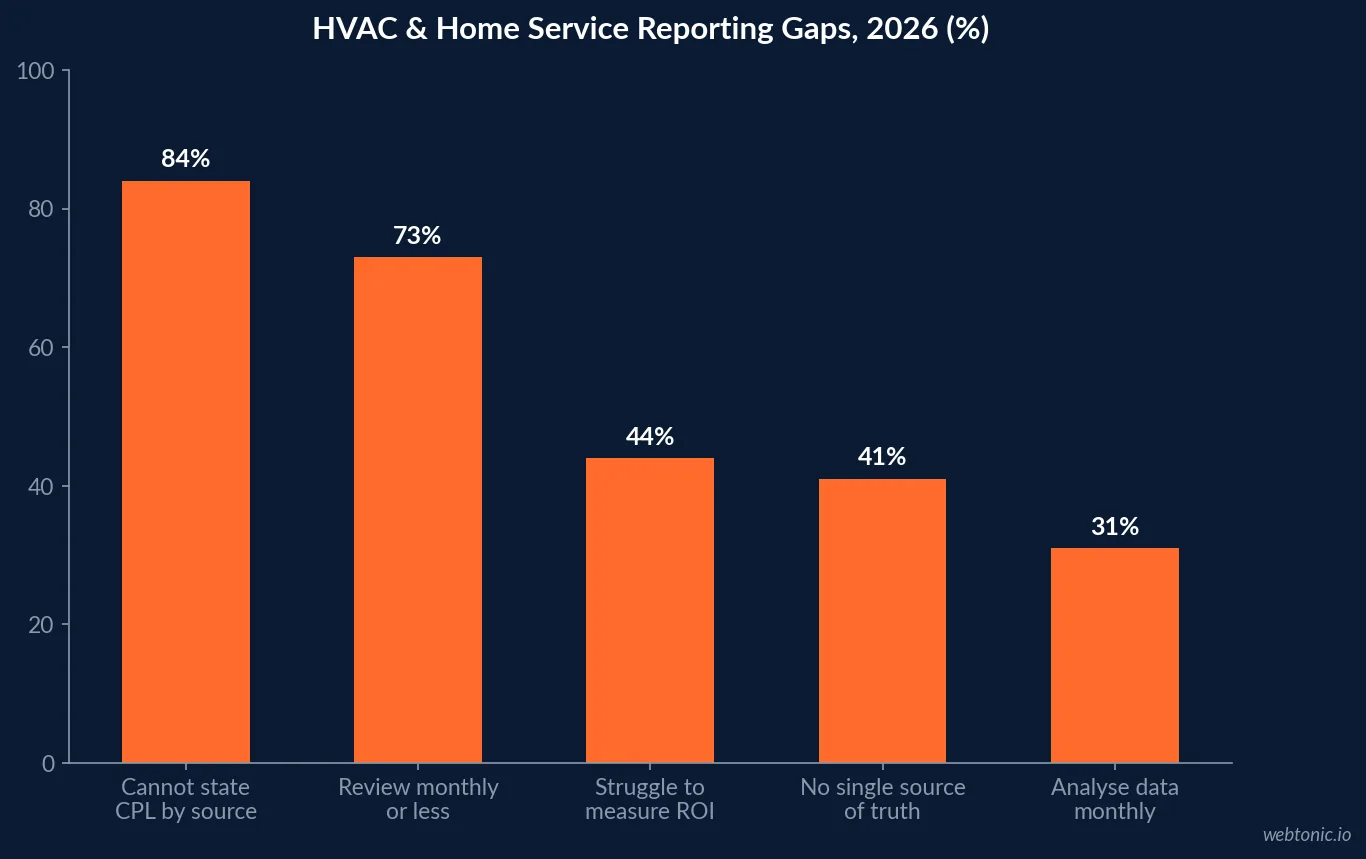
Seventy-three percent of home service owners review their marketing numbers monthly or less, and 41% have no single source of truth for cost per lead by channel — yet the shops that move to weekly review cut blended acquisition cost 15% to 25% within a quarter. A working HVAC dashboard is seven numbers and about $50 to $80 per month in connectors. Here is the 2026 data.
Key Takeaways
- 73% of owners review marketing numbers monthly or less; 41% lack a single source of truth for CPL.
- Weekly review cuts blended CAC 15%-25% in a quarter; budget moves in 7 days versus 28+.
- A healthy dashboard is 7 KPIs, reviewable in 30 minutes.
- Healthy booking rate is 40%-60% of qualified inbound calls; below 35% is a CSR problem.
- Looker Studio is free with 1,000+ connectors; paid connectors run $24-$199/month.
- Only 31% of small businesses analyse marketing data monthly — 67% of those report better decisions.
- Ad spend is only 50%-60% of true CAC, so most reported CAC figures are understated.
- CPL can swing 40% in three days — review weekly, decide on 30-day trends.
HVAC Reporting Benchmarks at a Glance
The table consolidates 2026 contractor dashboard research across 1,200 contractors, contractor KPI benchmarks and small business marketing survey data.
| Reporting metric | 2026 figure | Implication |
|---|---|---|
| Owners reviewing monthly or less | 73% | Three weeks of bleed before action |
| No single source of truth for CPL | 41% | Conflicting reports across platforms |
| Small businesses analysing data monthly | 31% | 67% of them report better decisions |
| Businesses struggling to measure ROI | 44% | Measurement, not media, is the gap |
| KPIs on a working dashboard | 7 | More than that and nobody reads it |
| Time to review a good dashboard | 30 minutes | Weekly cadence, Monday |
| Budget reallocation speed, weekly reviewers | Within 7 days | Monthly reviewers: 28+ days |
| CAC reduction from weekly review | 15% - 25% | Within one quarter |
| Typical CPL swing over three days | 40% | Why daily reaction is destructive |
| Connector cost for a free dashboard | $50 - $80/month | Looker Studio plus connectors |
Row three is the quiet one. Only 31% of small businesses analyse their marketing data monthly, and 67% of those who do report better decision-making and campaign performance. Reporting discipline is itself the competitive advantage in a trade where 78% of HVAC contractors employ fewer than 10 people.
1. The Seven KPIs That Belong on One Screen
The benchmark set is deliberately narrow. Everything else is a drill-down.
| KPI | Why it earns a slot | Healthy target |
|---|---|---|
| CPL by channel | Blended CPL hides everything | Trend, not absolute |
| CAC by channel | CPL times close rate | Under $350 for most shops |
| CLV by customer type | A $400 call can be a $14,000 lifetime | $12,000-$15,000 average |
| Conversion rate by funnel stage | Isolates page vs CSR problems | Stage-specific |
| Ad spend pacing vs budget | Day 12 should show ~40% consumed | Within 10% of pace |
| Revenue attribution by source | Leads and revenue diverge | Scale 18%-leads/41%-revenue channels |
| Booked jobs by day of week | Staffing and bid scheduling | Pattern stability |
The CLV example is the one that changes budget decisions. A $400 residential service call from a one-time customer is a $400 lifetime; the same call from a customer who signs a maintenance plan and replaces the system in year four is a $14,000 lifetime. With average home service CLV of $12,000 to $15,000 and a target CAC under $350, a well-run shop sits at 5:1 or better. Also note that repeat customers spend 67% more than new customers, which is why maintenance-plan conversion deserves a place on the same screen.
2. Review Cadence Is the Highest-Leverage Change
Cadence outperforms tooling. The dashboard research found weekly reviewers reallocating budget within 7 days of a CPL spike against 28+ days for monthly reviewers.
| Cadence | What it catches | Cost of the delay |
|---|---|---|
| Daily | Nothing reliable | 40% three-day CPL swings are noise |
| Weekly (30 min) | CPL spikes, pacing drift, booking dips | Budget moves in 7 days |
| Monthly | Quarter-scale problems only | Roughly 3 weeks of bleed |
| Quarterly | Structural mix issues | A full season of a seasonal trade |
Seasonality raises the stakes: winter delivers about 40% more leads than summer for HVAC firms and mobile searches for HVAC services rise 32% during peak repair seasons. A monthly review in a seasonal trade means discovering a pacing problem after the peak has passed. The rule the research settles on is straightforward — review weekly, decide on 30-day trends, and require every review to end in one of three outcomes: a corrective action, a rebalanced channel mix, or reduced spend.
3. The Channel Mix a Dashboard Should Show
Concentration risk and fragmentation are both visible only in a mix view.
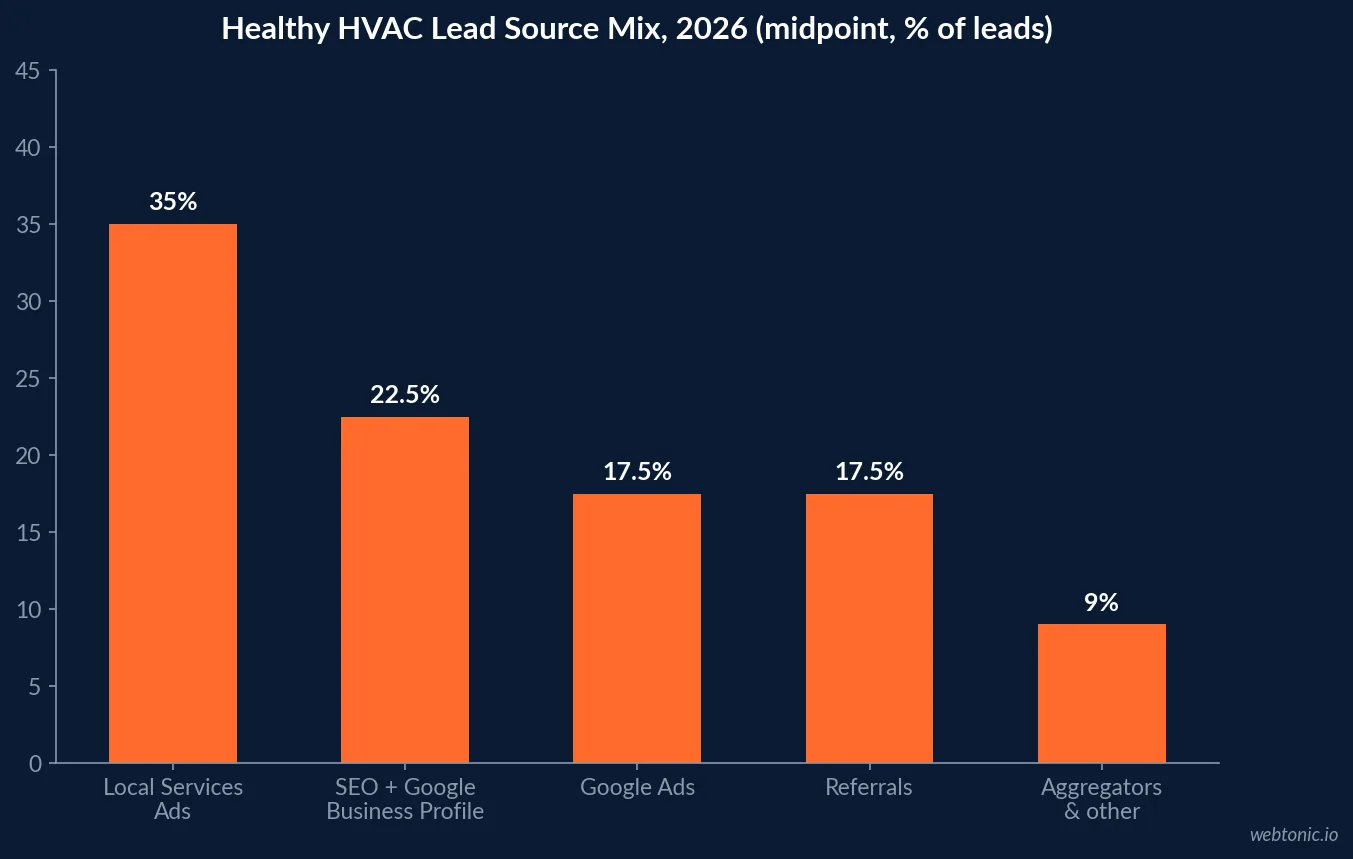
| Source | Healthy share of leads | Dashboard flag |
|---|---|---|
| Google Local Services Ads | 30% - 40% | Above 50% is concentration risk |
| SEO and Google Business Profile | 20% - 25% | GBP drives 30%-50% of calls organically |
| Google Ads | 15% - 20% | Watch CPL against $145 benchmark |
| Referrals | 15% - 20% | Converts at 2-4x cold leads |
| Aggregators and other | Under 10% | Bottom quartile spends 14%-22% of budget here |
Two failure shapes to watch for. If 80% of leads come from one channel, the business has concentration risk; if 20 or more channels each produce 5%, there is nothing to scale. And 54% of HVAC leads come from organic search with paid search at 29%, so a dashboard that only tracks paid media is reporting on a minority of demand. Marketing spend benchmarks: 7% to 10% of revenue for a healthy shop, 8% to 12% in growth mode, 5% to 7% for mature referral-led shops, with above 15% without falling CAC as the warning line.
4. Booking Rate: Where Marketing Data Meets Operations
The most common dashboard misdiagnosis is calling a CSR problem a marketing problem. Quartile benchmarks make the split visible.
| Operational KPI | Top 25% | Industry average | Bottom 25% |
|---|---|---|---|
| Inbound call answer rate | 91%+ | 68% | 51% or below |
| Booking rate on answered calls | 62% - 70% | 38% - 45% | 25% - 32% |
| First response time | Under 5 minutes | 47 minutes | 2+ hours |
| Booking rate tracked per CSR | 71% of companies | 8% of companies | Not tracked |
| Documented call scripts | Yes, maintained | 34% have any script | None |
The bottom-quartile 51% answer rate means nearly half of every marketing dollar buys calls nobody picks up — at $35 per call and 300 calls a month, roughly $5,145 monthly ringing to voicemail. A 35% click-to-lead rate is a landing page problem; a 28% lead-to-booked rate is a CSR problem, and only a funnel-stage view tells them apart. Note also that only 8% of average shops track booking rate per CSR versus 71% of top performers, and 42% of HVAC leads are lost to delayed follow-up.
5. The Metrics to Delete
Vanity metrics are not merely useless on a contractor dashboard — they actively mislead budget decisions.
- Impressions up 40% month over month. Did booked-job rate move? If not, nothing happened.
- CTR jumped to 8%. If booked-job rate from those clicks is 4%, you are paying more per customer.
- 8,000 monthly profile views. One operator celebrated this for six months before checking bookings.
- CPL without booked-job rate. A $50 lead at 8% close is dearer than a $150 lead at 40%.
- CAC as ad spend divided by customers. Ad spend is only 50%-60% of true CAC.
- No days-to-booked. Under 1 day is the win condition on emergency trades; over 3 days means they called someone else.
- No referral conversion rate. Referrals convert at 2-4x cold leads and almost nobody tracks them weekly.
The reason these gaps persist is cost, not ignorance: wiring lead-source attribution at the booked-job level takes a CSR script, a CRM field, a call-tracking subscription and roughly 8 hours of report building. The shops that pay that cost pull 20% to 35% more ROI from the same budget. The mechanics of that plumbing are covered in our data intelligence practice.
6. Tooling and What It Costs
Three names cover roughly 90% of contractor dashboard builds in 2026.
| Tool | Cost | Fit |
|---|---|---|
| Looker Studio | Free, 1,000+ data sources | Default under $10M revenue |
| Supermetrics connector | $79 - $199/month | Facebook, CallRail, HubSpot feeds |
| PorterMetrics connector | $30 - $90/month | Cheaper connector alternative |
| Coupler.io connector | $24 - $99/month | Sheets-first workflows |
| WhatConverts | $30 - $160/month | Attribution-first dashboards |
| ServiceTitan Marketing Pro | Enterprise pricing | 40+ pre-built KPIs |
Most contractors land at $50 to $80 per month in connector costs and still call Looker Studio the free option. That is the correct trade: the expensive part of a dashboard has never been the software, it is the 90 minutes of source tagging without which the report stays 60% "Unknown" forever. Teams that would rather not build it themselves can see how we structure reporting in data intelligence.
7. AI in Reporting: Adoption Is Ahead of Data Readiness
Reporting is where the AI gap shows most clearly. Dun & Bradstreet's survey of 10,000 businesses found more than three-quarters reporting measurable AI ROI while only 6% say their data is fully ready to support AI at scale.
| AI and data readiness | Figure | Reporting consequence |
|---|---|---|
| Enterprises reporting some AI ROI | 76%+ | Pockets of ROI at 48% |
| Broad or strong ROI | 28% | Concentrated in data-ready firms |
| Data fully ready for AI at scale | 6% | Partially ready 47%, mostly 36% |
| Organisations scaling AI | 34% | Up from piloting |
| Small businesses using AI in marketing | 73% (from 41% in 2025) | Lead scoring at 31% |
| Planning $1M+ AI investment | 58% | 84% increasing AI spend |
| Average budget allocated to AI | 15.3% | 70% of CMOs call it a top priority |
The lesson for a contractor is not to skip AI but to sequence it. Automated lead scoring and anomaly detection are only as good as the source tagging beneath them — with 60% of a dashboard reading "Unknown", an AI layer produces confident nonsense. Broader 2026 budget data adds useful context: marketing budgets grew just 1.3% and now average 7.8% of company revenue versus 11% in 2020, so reporting quality is how flat budgets get stretched.
8. The Weekly 30-Minute Review, Structured
A cadence without an agenda drifts into number-admiring. The structure the benchmark data supports:
| Minutes | Segment | Decision it forces |
|---|---|---|
| 0-5 | Pacing check against budget | Increase, hold or cut for the month |
| 5-12 | CPL and CAC by channel, 30-day trend | Reallocate or investigate |
| 12-18 | Booking rate and answer rate | Marketing issue or CSR issue |
| 18-24 | Revenue attribution by source | Scale the revenue channel, question the lead channel |
| 24-30 | One action, one owner, one date | Written and revisited next week |
The trap the research names explicitly is over-reaction: CPL rising from $120 to $180 on a Tuesday triggers an emergency call to the agency, and two weeks later the number is back at $115 — the decision was noise. Weekly visibility with monthly decision-making is the combination that produces the 15% to 25% CAC improvement, not weekly decision-making.
9. Seasonal and Market Context to Overlay
A dashboard without seasonal and cost context produces false alarms every spring.
| Context factor | 2026 figure | Overlay on the dashboard |
|---|---|---|
| Winter vs summer lead volume | About +40% | Compare year over year, not month over month |
| Mobile search rise in peak season | +32% | Watch mobile CVR separately |
| Share of HVAC searches on mobile | 76% | Call extensions cut CPL 34% |
| HVAC Google Ads CPC inflation | +8% - 12% YoY | Rising CPL is not always mismanagement |
| Average HVAC CAC | $289 | Benchmark for CAC-by-channel rows |
| Home service businesses expecting growth | 75% | 1 in 5 expect a significant jump |
| Searches with an AI answer first | About 22% | Organic reporting needs a new baseline |
That last row matters for reporting integrity: with roughly 22% of home service searches now involving an AI-generated answer before a click, organic traffic can fall while demand rises. Dashboards built on session counts will mis-report the channel; dashboards built on booked jobs by source will not. Our HVAC branding statistics cover why brand strength increasingly determines whether that AI answer names your company at all.
10. What the Data Recommends
- Cut the dashboard to 7 KPIs and review it in 30 minutes every Monday.
- Move from monthly to weekly review. Documented 15%-25% blended CAC reduction in a quarter.
- Put booking rate and answer rate on the marketing dashboard. 91% vs 68% answer rate is the top-quartile gap.
- Report revenue by source, not leads by source. An 18%-of-leads, 41%-of-revenue channel is the one to scale.
- Delete impressions, views and follower counts. Keep only metrics with a booked-job link.
- Compute CAC properly. Ad spend is 50%-60% of the real figure.
- Spend the 90 minutes on source tagging or live with 60% "Unknown" permanently.
- Decide on 30-day trends. A 40% three-day CPL swing is noise.
The pattern across the 2026 benchmarks is consistent: contractors winning the channel mix are reviewing fewer metrics, at the right cadence, with honest attribution underneath. Seven numbers, thirty minutes, $50 to $80 a month in connectors, and a written action every week. For the paid-media inputs feeding those rows see our Google Ads cost guide, and for building the reporting layer with us, growth marketing or get in touch.
Frequently Asked Questions
What should an HVAC marketing dashboard actually show?
Seven KPIs on one screen: cost per lead by channel, customer acquisition cost by channel, customer lifetime value by customer type, conversion rate by funnel stage, ad spend pacing against budget, revenue attribution by source, and booked jobs by day of week. That set is drawn from 2026 contractor dashboard benchmarks and it is deliberately short — the reason most contractors do not run a dashboard is not tooling, it is that nobody told them which seven numbers matter and how to review them in 30 minutes instead of three hours.
How often should marketing numbers be reviewed?
Weekly. A 2026 benchmark of 1,200 contractors found 73% of home service owners review marketing numbers monthly or less, and shops moving from monthly to weekly review typically cut blended customer acquisition cost 15% to 25% within a quarter. Contractors running a 30-minute Monday review reallocate budget within 7 days of a cost-per-lead spike versus 28 or more days for monthly reviewers. The counterweight: cost per lead can swing 40% in three days, so act on 30-day trends rather than daily noise.
What does a marketing dashboard cost to run?
Less than most contractors assume. Looker Studio is free and connects to 1,000+ data sources, but Facebook Ads, CallRail and HubSpot need a paid connector — Supermetrics at $79 to $199 per month, PorterMetrics at $30 to $90, or Coupler.io at $24 to $99. Most contractors land at $50 to $80 per month in connector costs. WhatConverts runs $30 to $160 per month for attribution-first dashboards, and ServiceTitan Marketing Pro ships 40+ pre-built KPIs at enterprise pricing.
What are healthy dashboard benchmark targets for HVAC?
Booking rate of 40% to 60% of qualified inbound calls, with anything below 35% indicating a customer service representative problem rather than a marketing problem. Days-to-booked under one day on emergency trades. Marketing spend at 7% to 10% of revenue for a healthy shop, 8% to 12% in growth mode and 5% to 7% for mature shops carried by referrals. A lead mix of roughly 30% to 40% Local Services Ads, 15% to 20% Google Ads, 20% to 25% SEO and Google Business Profile, and 15% to 20% referrals.
Which metrics should be removed from an HVAC dashboard?
Impressions, follower counts, Google Business Profile views and click-through rate without a downstream booking figure. One operator described spending six months celebrating 8,000 monthly profile views before checking booked jobs. The specific traps in the benchmark data are tracking cost per lead without booked-job rate, reporting customer acquisition cost as ad spend divided by customers when ad spend is only 50% to 60% of true CAC, omitting days-to-booked, and having no standing referral conversion rate even though tracked referrals convert at 2 to 4 times the rate of cold leads.
Sources
PipelineOn — Contractor Marketing Dashboard 2026
PipelineOn — Contractor Marketing KPIs
Built on Tenth — HVAC Marketing Benchmarks 2026
DesignLoud — State of Small Business Marketing 2026
Dun & Bradstreet — AI Momentum Survey
RSM — Middle Market AI Survey
ALM — Marketing Statistics 2026
CustomerFlows — Home Service Business Statistics
Elev8 Operations — Contractor Marketing Statistics 2026
RYN Digital — HVAC Marketing Statistics 2026
ZipDo — HVAC Marketing Statistics


