Table of contents
The U.S. countertop market reached $22.1 billion in 2025 and quartz now commands 51% market share, but brand trust rankings shift every year — the gap between the top and bottom ranked brands in the 2026 America's Most Trusted study is just 6 points. For countertop fabricators and distributors, branding is no longer optional; it is the lever that separates commodity pricing from premium positioning.
Key Takeaways
- Caesarstone leads the 2026 America's Most Trusted Countertop ranking with a 107.3 Net Trust Quotient, based on 5,285 shopper opinions (Lifestory Research).
- Quartz holds 51% of the U.S. countertop market share, up from roughly 22% a decade ago (SlabWise).
- Remodeling firms with branding consistency close 31% more deals and local branding increases trust by 53% (Marketing LTB).
- Countertop showrooms convert 2 to 3 times higher than phone or web-only quoting because customers can see and touch materials (SlabWise).
- 9 in 10 contractors report satisfaction after switching brands, signaling that loyalty is increasingly earned through experience, not inertia (Principia).
- 38 to 42% of homeowners choosing new countertops in 2026 select quartz, driven by stain resistance (84% rate it "very important") and aesthetics (82%) (SlabWise).
- The average countertop manufacturer website converts at 2.9%, with top performers reaching 6.5% through pricing transparency (Cufinder).
- 44% of remodeling companies do not track marketing ROI — those that do grow 2.4 times faster (Marketing LTB).
Countertop Branding Benchmarks at a Glance
The following table consolidates the most important branding, trust, and performance metrics for countertop companies in 2026.
| Metric | Value | Context |
|---|---|---|
| U.S. Countertop Market Size (2025) | $22.1 billion | Residential + commercial |
| Quartz Market Share | 51% | Dominant material, up from 22% |
| Granite Market Share | 24% | Second most popular |
| Top Brand Trust Score (Caesarstone) | 107.3 | Net Trust Quotient |
| Lowest Ranked Score (Formica) | 101.0 | 6-point gap to leader |
| Branding Consistency Deal Uplift | +31% | Remodeling firms |
| Local Branding Trust Increase | +53% | Consumer perception |
| Showroom Conversion Premium | 2 to 3x higher | vs. phone/web-only |
| Average Website CVR | 2.9% | Countertop manufacturing |
| Top 10% Website CVR | 6.5% | Pricing transparency driven |
| Mobile Conversion Rate | 1.8% | Desktop 2.3x higher |
| B2B NPS | +52 | Above industry average |
2026 Countertop Brand Trust Rankings
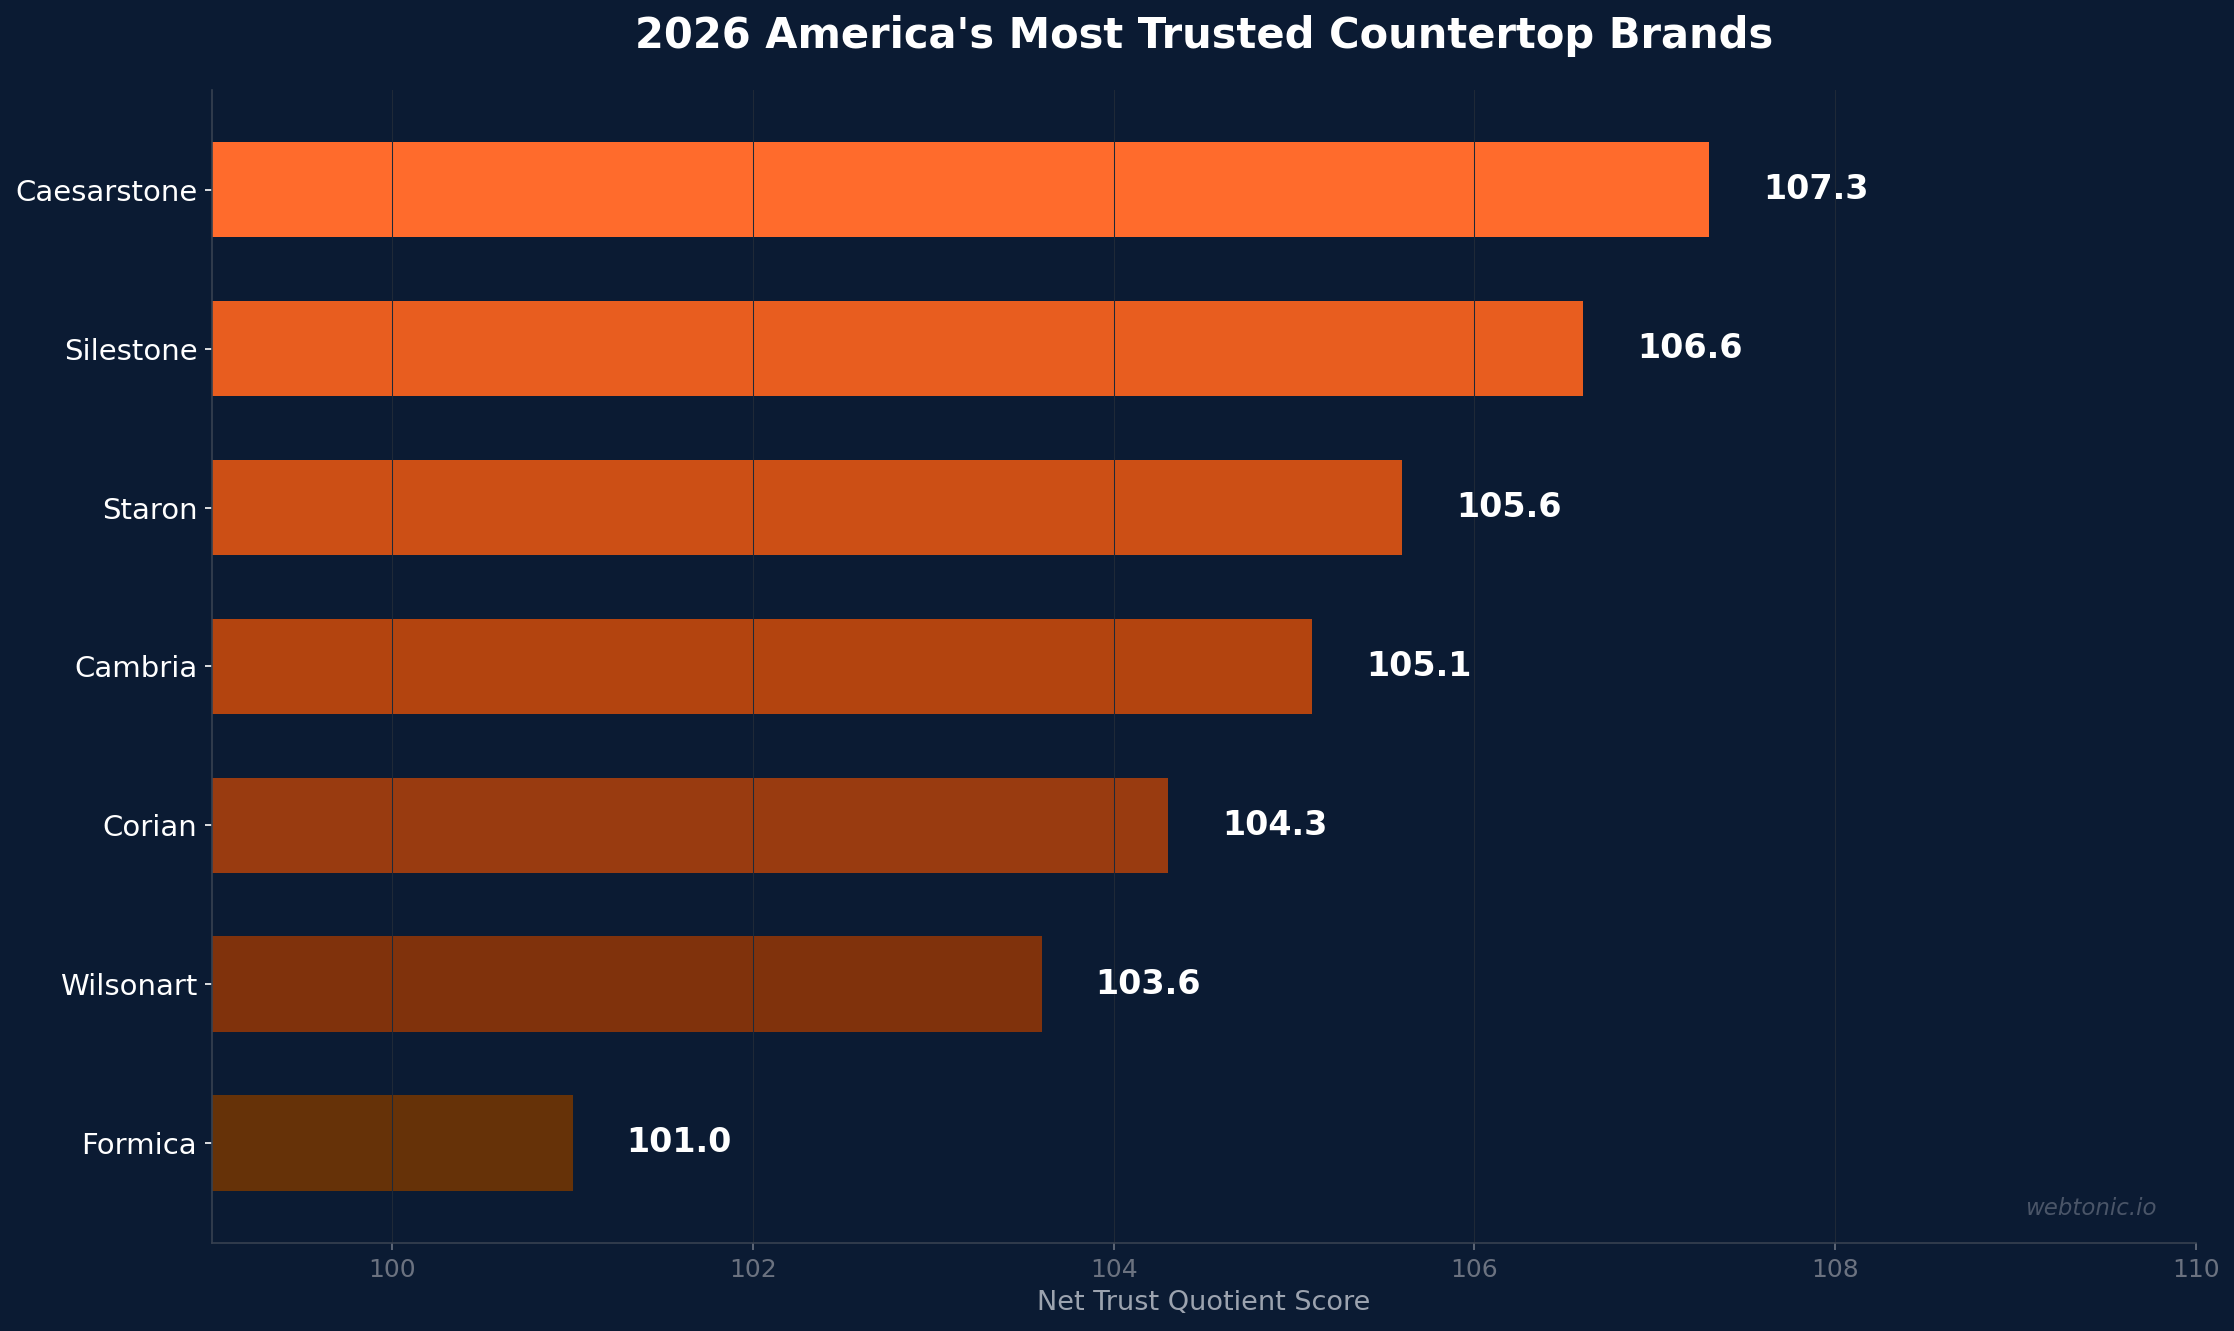
The 2026 America's Most Trusted Countertop study by Lifestory Research surveyed 5,285 active countertop shoppers and evaluated 7 major brands. The Net Trust Quotient measures the ratio of Trust Advocates to Trust Antagonists among real buyers.
| Rank | Brand | Net Trust Quotient |
|---|---|---|
| 1 | Caesarstone | 107.3 |
| 2 | Silestone | 106.6 |
| 3 | Staron | 105.6 |
| 4 | Cambria | 105.1 |
| 5 | Corian | 104.3 |
| 6 | Wilsonart | 103.6 |
| 7 | Formica | 101.0 |
The 6.3-point spread between Caesarstone (107.3) and Formica (101.0) is narrow, meaning that brand perception in the countertop space is fiercely competitive. Caesarstone climbed from mid-pack in 2024 (where Cambria led at 101.6) to the top position in 2026, demonstrating how rapidly trust scores can shift with sustained branding investment. For fabricators and retailers, aligning with a high-trust manufacturer brand amplifies their own credibility and can justify premium pricing for installation services.
Countertop Material Market Share and Trends
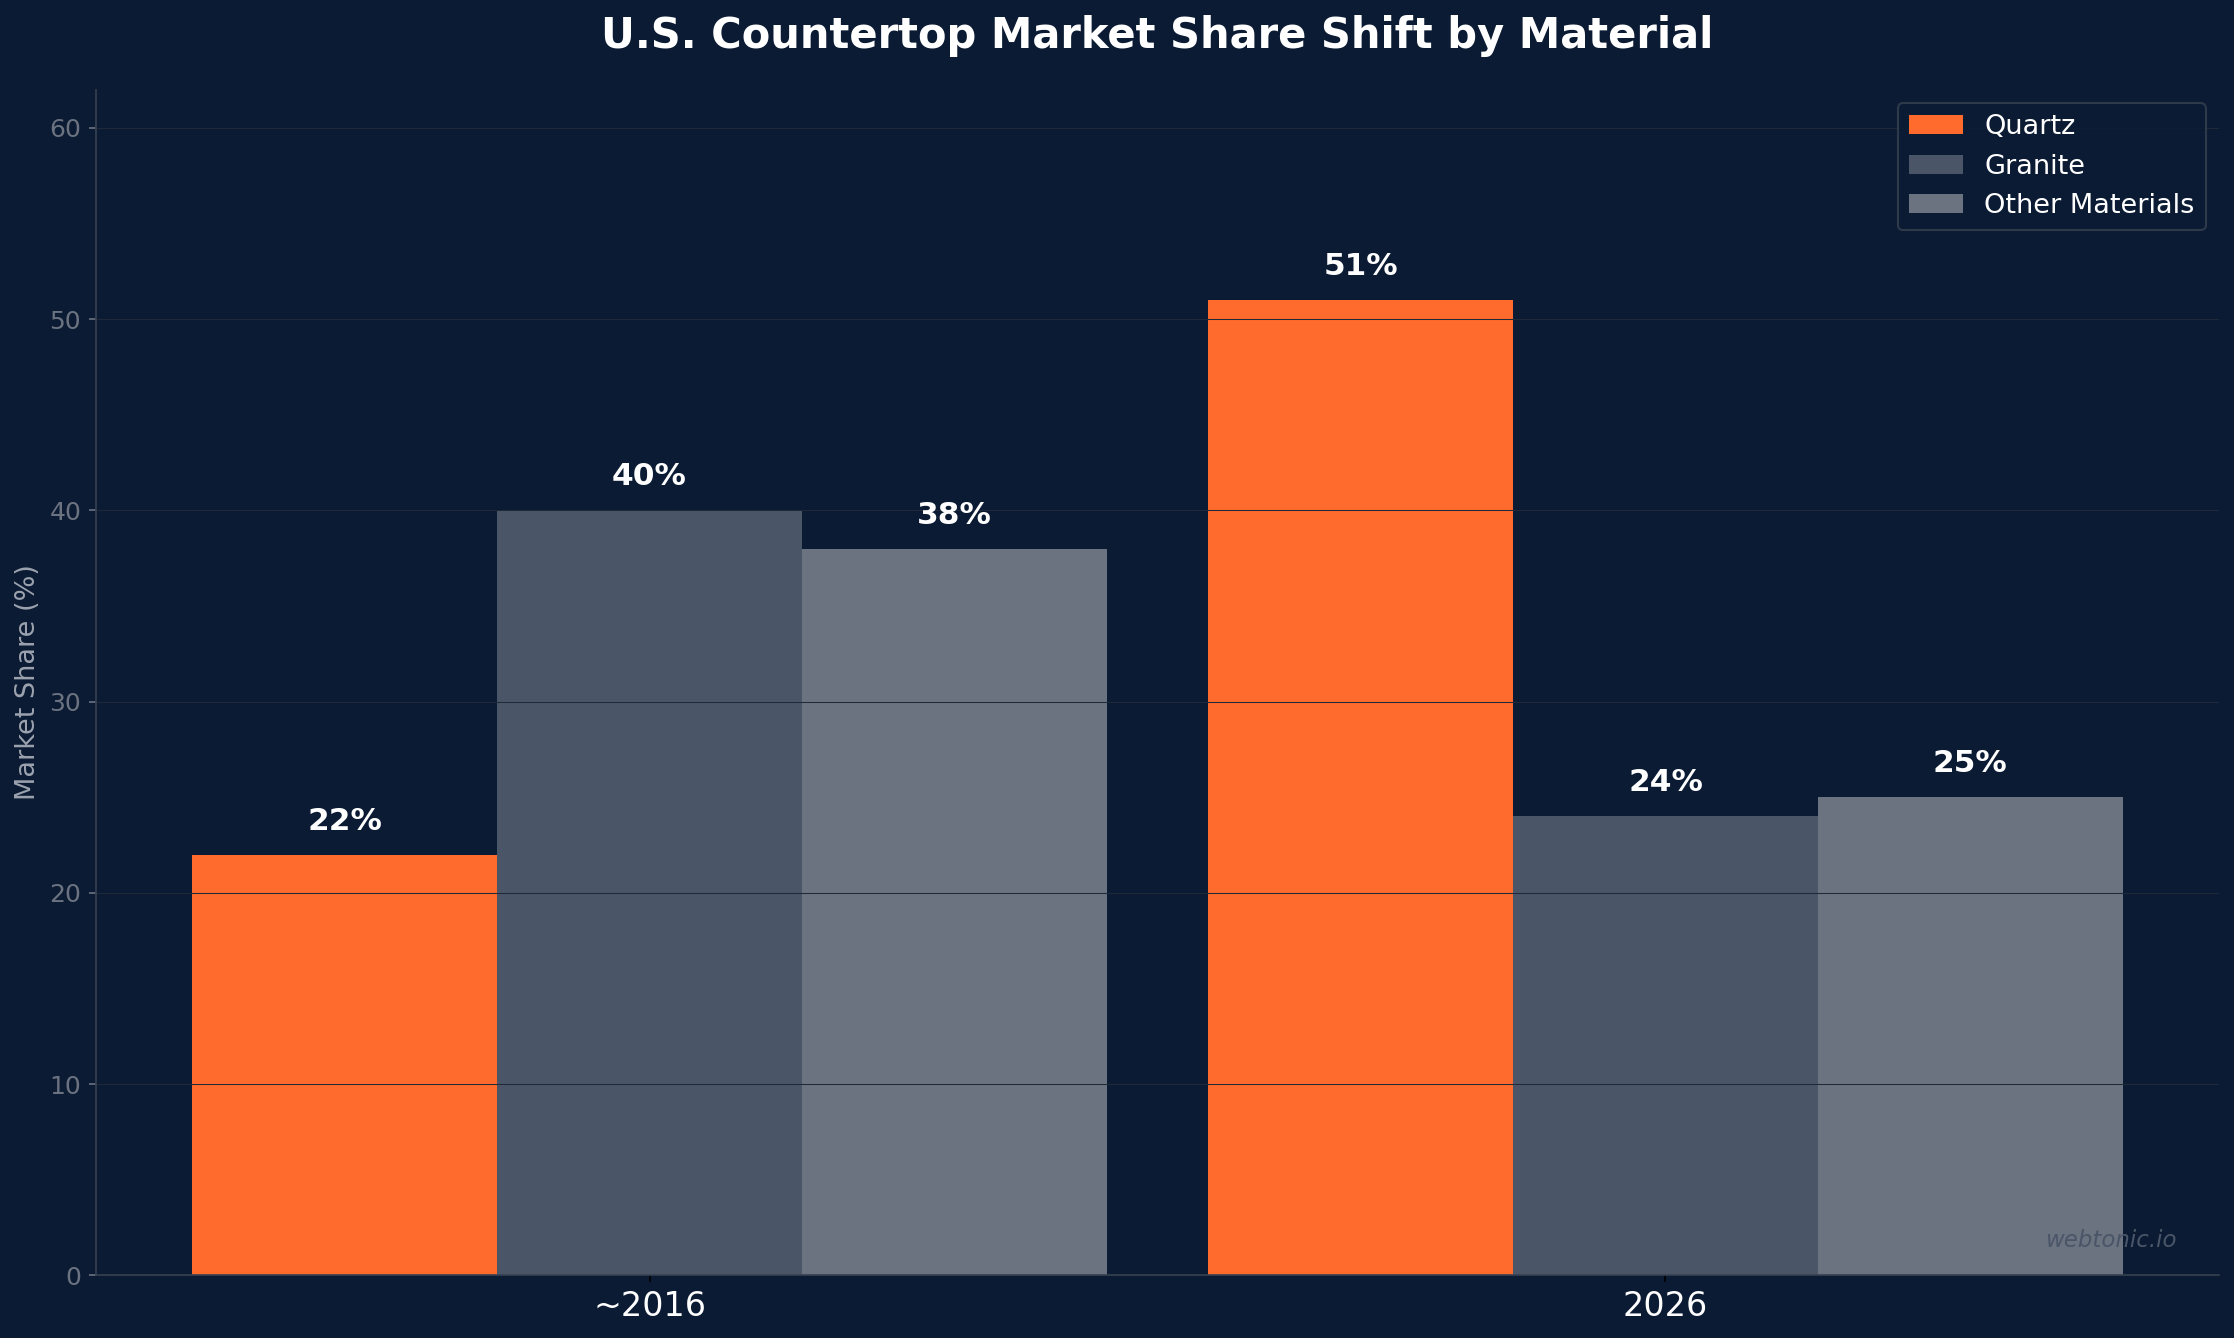
Quartz has fundamentally reshaped the countertop landscape. A decade ago, granite held roughly 40% market share while quartz sat at 22%. By 2026, those positions have flipped: quartz commands 51% and granite holds 24% (SlabWise). This shift is driven by consumer preference for uniform appearance, zero maintenance requirements (no annual sealing like granite), and broader design versatility.
The global countertop market is projected to reach $209.5 billion by 2034 at a 5.02% CAGR. Within the quartz segment specifically, the top 3 manufacturers control 33 to 40% of the market, while regional and private-label producers hold 45 to 52% — creating a fragmented landscape where strong branding is the primary differentiator for mid-market fabricators and distributors.
Homeowner preferences in 2026 confirm the brand opportunity: 38 to 42% of consumers selecting new countertops choose quartz, with stain resistance rated "very important" by 84% and aesthetics by 82% (SlabWise). Brands that effectively communicate these functional advantages through consistent visual identity and messaging capture a disproportionate share of the consideration set.
Branding Impact on Countertop Sales Performance
Data from the remodeling sector — the largest demand driver for countertops — reveals clear links between branding discipline and revenue outcomes. Remodeling firms with branding consistency close 31% more deals, and local branding increases consumer trust by 53% (Marketing LTB).
Yet 44% of remodeling companies do not track marketing ROI — a gap that directly impacts branding investment decisions. Companies that do track grow 2.4 times faster than those that do not. For countertop businesses, this means that branding is not just a creative exercise but a measurable growth strategy that compounds when paired with proper attribution and analytics.
Showroom experiences amplify branding impact significantly. Countertop showrooms convert at 2 to 3 times the rate of phone or web-only quoting because buyers can see and touch materials (SlabWise). More than 40% of homeowners are referred to a showroom by an industry professional, while 25% find showrooms through their own online research (NKBA). This makes the connection between digital branding and physical showroom experience critical — a well-branded online presence drives qualified foot traffic that converts at premium rates.
Brand Loyalty Is Shifting in Building Materials
Brand loyalty in building materials is no longer a given. Principia's research shows that 9 in 10 contractors report satisfaction after switching to a new brand, meaning that past loyalty is increasingly fragile. The data suggests that contractors are making more informed, performance-driven decisions rather than defaulting to familiar names.
For countertop brands, this creates both a threat and an opportunity. Established brands cannot coast on legacy recognition — they must continuously reinforce their value proposition through quality delivery, consistent visual identity, and responsive service. Challenger brands, meanwhile, have a real opening: if 90% of switchers end up satisfied, then the barrier to trial is the primary obstacle, not product quality. Effective growth marketing that reduces the perceived risk of switching (samples, guarantees, case studies) can accelerate share capture in this environment.
The brand switching dynamic is particularly acute in the countertop sector because product quality has converged across major manufacturers. When quartz brands offer similar durability, stain resistance, and aesthetic options, the differentiator shifts to brand experience — how easy it is to get samples, how responsive the quoting process is, how professional the installation team appears, and how well the company communicates throughout the project lifecycle. The communication and updates satisfaction score of just 3.1 out of 5 across the industry reveals that most countertop companies are underinvesting in this crucial brand touchpoint.
Repeat business and referral patterns further underscore branding importance. The countertop industry's B2B Net Promoter Score of +52 — above the building materials average — indicates strong referral potential. However, this score is unevenly distributed: top-performing brands with 4.6 out of 5 satisfaction ratings on problem resolution generate significantly more organic referrals than the industry average of 3.4. Building a brand reputation for reliable problem resolution and after-sale support creates a compounding referral engine that reduces customer acquisition costs over time.
Digital Branding Performance for Countertop Companies
The average countertop manufacturer website converts at 2.9%, with top 10% performers reaching 6.5% — driven primarily by pricing transparency (Cufinder). Desktop conversion rates reach 4.2%, while mobile lags at 1.8% — a 2.3x device gap that represents a significant branding opportunity for countertop companies that optimize their mobile experience.
Organic search remains the highest-ROI digital channel for countertop companies, driving 52% of website traffic. Companies that invest in branded search campaigns alongside organic efforts create a double coverage effect — appearing in both paid and organic results reinforces brand authority and captures high-intent buyers at the moment of decision.
Customer satisfaction data reveals the branding elements that matter most to countertop buyers. Installation professionalism scores 4.1 out of 5 on average, while communication and updates score just 3.1 — the lowest-rated touchpoint (SlabWise). Brands that invest in proactive communication workflows — automated updates, timeline tracking, post-install follow-ups — can differentiate on the dimension where competitors fall shortest.
Sustainability as a Countertop Brand Differentiator
The 2026 Green Builder Sustainable Brand Index highlights sustainability as an emerging branding lever in the countertop space. Brands that effectively communicate their environmental credentials — recycled content percentages, manufacturing emissions data, certifications — gain preference among the growing segment of environmentally conscious homeowners and designers.
Cambria, a family-owned U.S. manufacturer, has leveraged its domestic production story and design range (over 150 patterns) as brand differentiators, consistently ranking among the top trusted brands. The lesson for mid-market countertop companies is that brand storytelling rooted in verifiable claims — origin, sustainability, craftsmanship — resonates more powerfully than generic quality messaging. Paired with professional agency guidance, this storytelling approach builds defensible brand equity that commodity competitors cannot easily replicate.
Countertop Industry Marketing Spend and Budget Allocation
Top-performing contractors and home improvement businesses allocate 7 to 10% of revenue to marketing, with well-run remodelers seeing 380 to 420% returns on their overall marketing investment. The average cost per booked job ranges from $300 to $700 for healthy contractor accounts, while bottom-quartile performers spend $1,400 or more per booked job — typically indicating a broken funnel rather than insufficient budget.
For countertop fabricators specifically, the average website conversion rate of 2.9% and organic search driving 52% of traffic create a baseline that branding can meaningfully improve. Companies that combine consistent brand identity with conversion-optimized websites push toward the 6.5% top-performer conversion benchmark, effectively doubling their lead generation from the same traffic volume.
The pricing transparency factor is particularly relevant for countertop branding. The top-converting countertop websites share pricing ranges openly, which both qualifies leads and builds trust. This aligns with broader consumer behavior data showing that homeowners researching countertops visit an average of 3 to 5 brand websites before requesting a quote, making each brand touchpoint a competitive opportunity. Companies that present clear pricing alongside strong brand storytelling capture more of these comparison shoppers.
Marketing budget tracking remains a critical gap in the industry. With 44% of remodeling companies not tracking ROI, many countertop businesses invest in branding without measuring its impact on deal flow, average order value, or customer lifetime value. Implementing proper attribution — connecting digital ad exposure and website visits to showroom appointments and closed sales — is the foundation that turns branding from an expense into a measurable growth lever.
Branding Best Practices for Countertop Companies
- Audit your brand trust baseline. Track how your brand scores against competitors using consumer trust surveys and NPS data. The current B2B NPS benchmark for countertop manufacturing is +52 — use it as your measuring stick.
- Invest in showroom branding. Showrooms convert 2 to 3 times higher than digital-only channels. Ensure your showroom experience matches your digital brand identity in materials, lighting, and messaging consistency.
- Close the mobile branding gap. With mobile converting at just 1.8% versus desktop at 4.2%, optimize your mobile brand experience — fast-loading product galleries, easy-to-use quote request forms, and click-to-call functionality.
- Track and communicate ROI. The 44% of companies not tracking marketing ROI are flying blind. Implement attribution tracking across digital advertising and showroom walk-ins to justify branding investments.
- Lead with functional benefits. Stain resistance (84% importance) and aesthetics (82%) drive purchase decisions. Your brand messaging should quantify these benefits, not just claim them generically.
- Build switching incentives. With 90% of brand-switchers reporting satisfaction, reducing the perceived risk of trial (free samples, satisfaction guarantees, before-and-after case studies) is the highest-leverage branding investment.
Frequently Asked Questions
What is the most trusted countertop brand in 2026?
Caesarstone leads the 2026 America's Most Trusted Countertop ranking with a 107.3 Net Trust Quotient, followed by Silestone at 106.6 and Staron at 105.6, based on 5,285 shopper opinions surveyed by Lifestory Research.
How much does branding impact countertop sales?
Remodeling firms with consistent branding close 31% more deals, and local branding increases consumer trust by 53%. Countertop showrooms — the most brand-intensive touchpoint — convert at 2 to 3 times the rate of phone or web-only interactions.
What is the current market share of quartz countertops?
Quartz holds 51% of the U.S. countertop market, making it the dominant material. Granite is second at approximately 24%. A decade ago, these positions were nearly reversed, with granite leading and quartz at just 22%.
How much should a countertop company spend on branding?
Remodeling and home improvement companies typically allocate 7 to 10% of revenue to marketing, with well-performing firms seeing 380 to 420% returns. Given that branding consistency drives a 31% deal close improvement, dedicating at least a third of the marketing budget to brand-building activities is supported by the data.
Why is brand loyalty declining in building materials?
Contractors are making more performance-driven purchasing decisions. Research shows that 9 in 10 contractors are satisfied after switching brands, meaning that product quality across brands has converged. Loyalty now depends more on ongoing service quality, communication, and digital brand experience than on legacy familiarity alone.
Sources
Lifestory Research — 2026 Most Trusted Countertop Brands
SlabWise — Countertop Industry Statistics 2026
SlabWise — Quartz Market Growth Statistics
SlabWise — Homeowner Preferences 2026
SlabWise — Countertop Showroom Guide
SlabWise — Customer Satisfaction 2026
Cufinder — Countertop Manufacturing Benchmarks
Marketing LTB — Remodeling Marketing Statistics
Principia — Brand Loyalty in Building Materials
Green Builder — Sustainable Brand Index 2026
NKBA — Independent Kitchen and Bath Showrooms Report