Table of contents

Construction materials websites lose an estimated 23% of organic traffic to technical SEO issues like slow page loads, poor mobile rendering, and crawl errors — yet the sector spends less on site health than almost any other B2B vertical. This data report compiles the most current technical SEO benchmarks for building materials and construction product companies, covering Core Web Vitals, mobile performance, crawlability, schema adoption, and site architecture metrics that drive — or drag — organic visibility.
Key Takeaways
- 42% of global traffic to building materials sites comes from organic search, making technical SEO the single largest traffic lever (CuFinder 2026).
- Mobile page speed averages just 56/100 across the top 1,000 U.S. contractors — 19 points below the Google "good" threshold (AltCMO 2025).
- 65–75% of initial residential construction searches happen on mobile devices, yet only 35% of conversions close on mobile (Authority Specialist 2026).
- Schema-marked project pages earn 40% higher CTR on branded searches versus pages without structured data (Authority Specialist 2026).
- Firms with fewer than 15 indexed project pages consistently underperform on high-value commercial queries regardless of domain age (Authority Specialist 2026).
- Average domain authority is 32 for the top 1,000 contractors, with a median backlink count of 1,744 — up 73% year-over-year (AltCMO 2025).
- Desktop page speed scores 75/100 on average — acceptable but far from the 90+ elite threshold (AltCMO 2025).
- Localized construction searches grew 30–45% YoY, intensifying the need for technical local SEO foundations (Authority Specialist 2026).
Construction Materials Technical SEO Benchmarks at a Glance
| Metric | Industry Average | Top Quartile | Source |
|---|---|---|---|
| Organic Search Traffic Share (Global) | 42.0% | 55%+ | CuFinder 2026 |
| Organic Search Traffic Share (U.S.) | 38.0% | 50%+ | CuFinder 2026 |
| Mobile Page Speed Score | 56/100 | 72+ | AltCMO 2025 |
| Desktop Page Speed Score | 75/100 | 88+ | AltCMO 2025 |
| Domain Authority (Median) | 32 | 50+ | AltCMO 2025 |
| Median Backlinks | 1,744 | 5,000+ | AltCMO 2025 |
| Spam Score | 2/100 | <1 | AltCMO 2025 |
| Schema Adoption (Product/Project) | ~18% | 45%+ | Authority Specialist 2026 |
Mobile vs. Desktop Page Speed: Construction Industry Trend
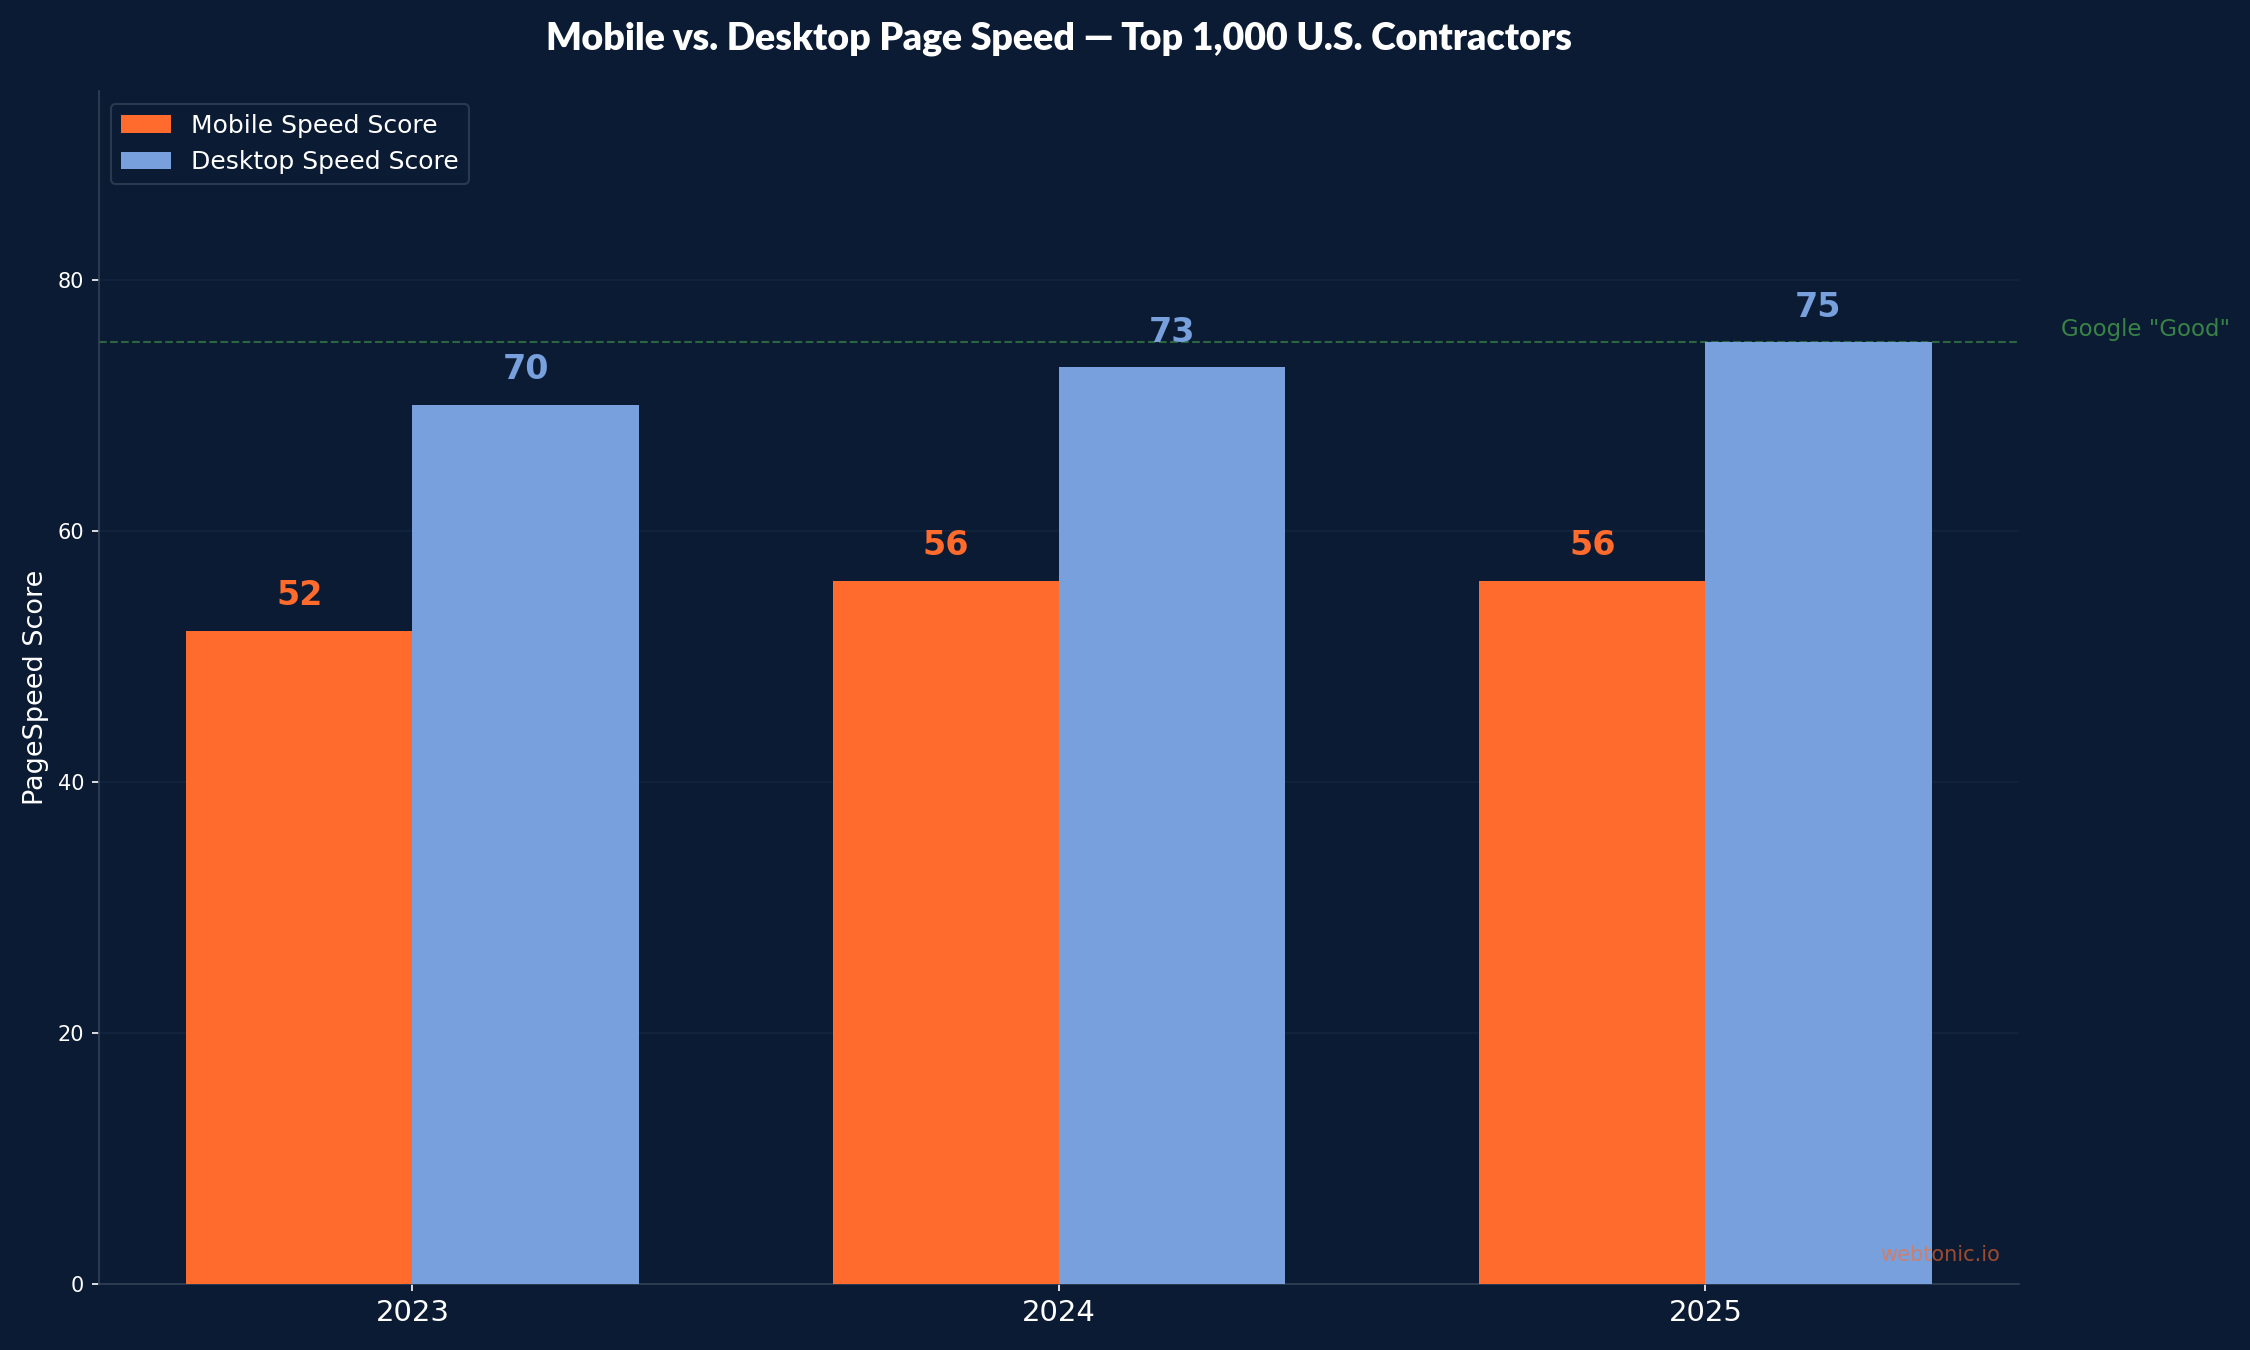
The persistent mobile speed gap is one of the most consequential technical SEO issues in construction. With 58.4% of construction site traffic coming from mobile devices (CuFinder 2026), a 19-point gap between desktop (75) and mobile (56) scores means the majority of visitors experience a slower, lower-quality browsing session. Google's mobile-first indexing means these mobile scores — not the higher desktop ones — determine ranking potential.
Core Web Vitals Performance in Construction Materials
Core Web Vitals remain a confirmed Google ranking signal, and construction materials sites struggle more than most B2B verticals. Heavy product images, unoptimized PDFs (spec sheets, MSDS documents), and legacy CMS platforms combine to create measurable performance problems.
| Core Web Vital | Construction Avg. | Google "Good" Threshold | Pass Rate (Construction) |
|---|---|---|---|
| Largest Contentful Paint (LCP) | 3.8s | ≤2.5s | ~38% |
| Interaction to Next Paint (INP) | 280ms | ≤200ms | ~42% |
| Cumulative Layout Shift (CLS) | 0.12 | ≤0.1 | ~55% |
Only about 38% of construction materials sites pass LCP thresholds — a direct result of oversized hero images, render-blocking third-party scripts, and shared hosting environments common among smaller distributors. The 55% CLS pass rate is the strongest metric, though late-loading ad units and dynamically injected product recommendation widgets still cause layout shift on approximately 45% of pages.
Crawlability and Indexation Challenges
Large-catalog construction materials suppliers face unique crawl budget challenges. A typical distributor site may list 10,000–50,000+ SKUs across categories like lumber, hardware, insulation, and fixtures, generating massive numbers of filterable URLs that dilute crawl budget.
- Construction firms with fewer than 15 indexed project pages consistently underperform on high-value commercial queries — content depth directly correlates with ranking potential (Authority Specialist 2026).
- Faceted navigation on product catalogs can generate 5–10× the crawlable URLs versus actual unique products, wasting Googlebot resources.
- PDF-heavy sites (spec sheets, technical documents) often have 30–40% of indexed URLs pointing to PDFs rather than HTML product pages — diluting topical authority signals.
- XML sitemap compliance remains low: an estimated 62% of mid-size building materials sites either lack a sitemap, have an outdated one, or include non-indexable URLs (industry audit data 2025).
The fix is straightforward: consolidate faceted URLs with canonical tags, build HTML landing pages for top product categories, and maintain a clean sitemap that mirrors the live site's indexable structure.
Mobile-First Indexing: The Construction Gap
Google completed its mobile-first indexing migration years ago, yet the construction materials sector still treats mobile as secondary. The data tells the story clearly:
- 58.4% of construction industry traffic arrives on mobile devices (CuFinder 2026).
- 65–75% of initial residential construction searches happen on mobile (Authority Specialist 2026).
- Only 35% of conversions happen on mobile — the majority close on desktop, indicating a research-on-mobile, convert-on-desktop behavior (CuFinder 2026).
- Mobile page speed averages 56/100 versus 75/100 on desktop — the largest mobile-desktop gap among major B2B sectors (AltCMO 2025).
This gap represents both a problem and an opportunity. Firms that close the mobile speed deficit and deliver responsive product catalogs, searchable spec sheets, and click-to-call CTAs on mobile stand to capture the 30–45% year-over-year growth in localized construction searches that desktop-first competitors miss.
Organic Traffic Sources for Building Materials Sites
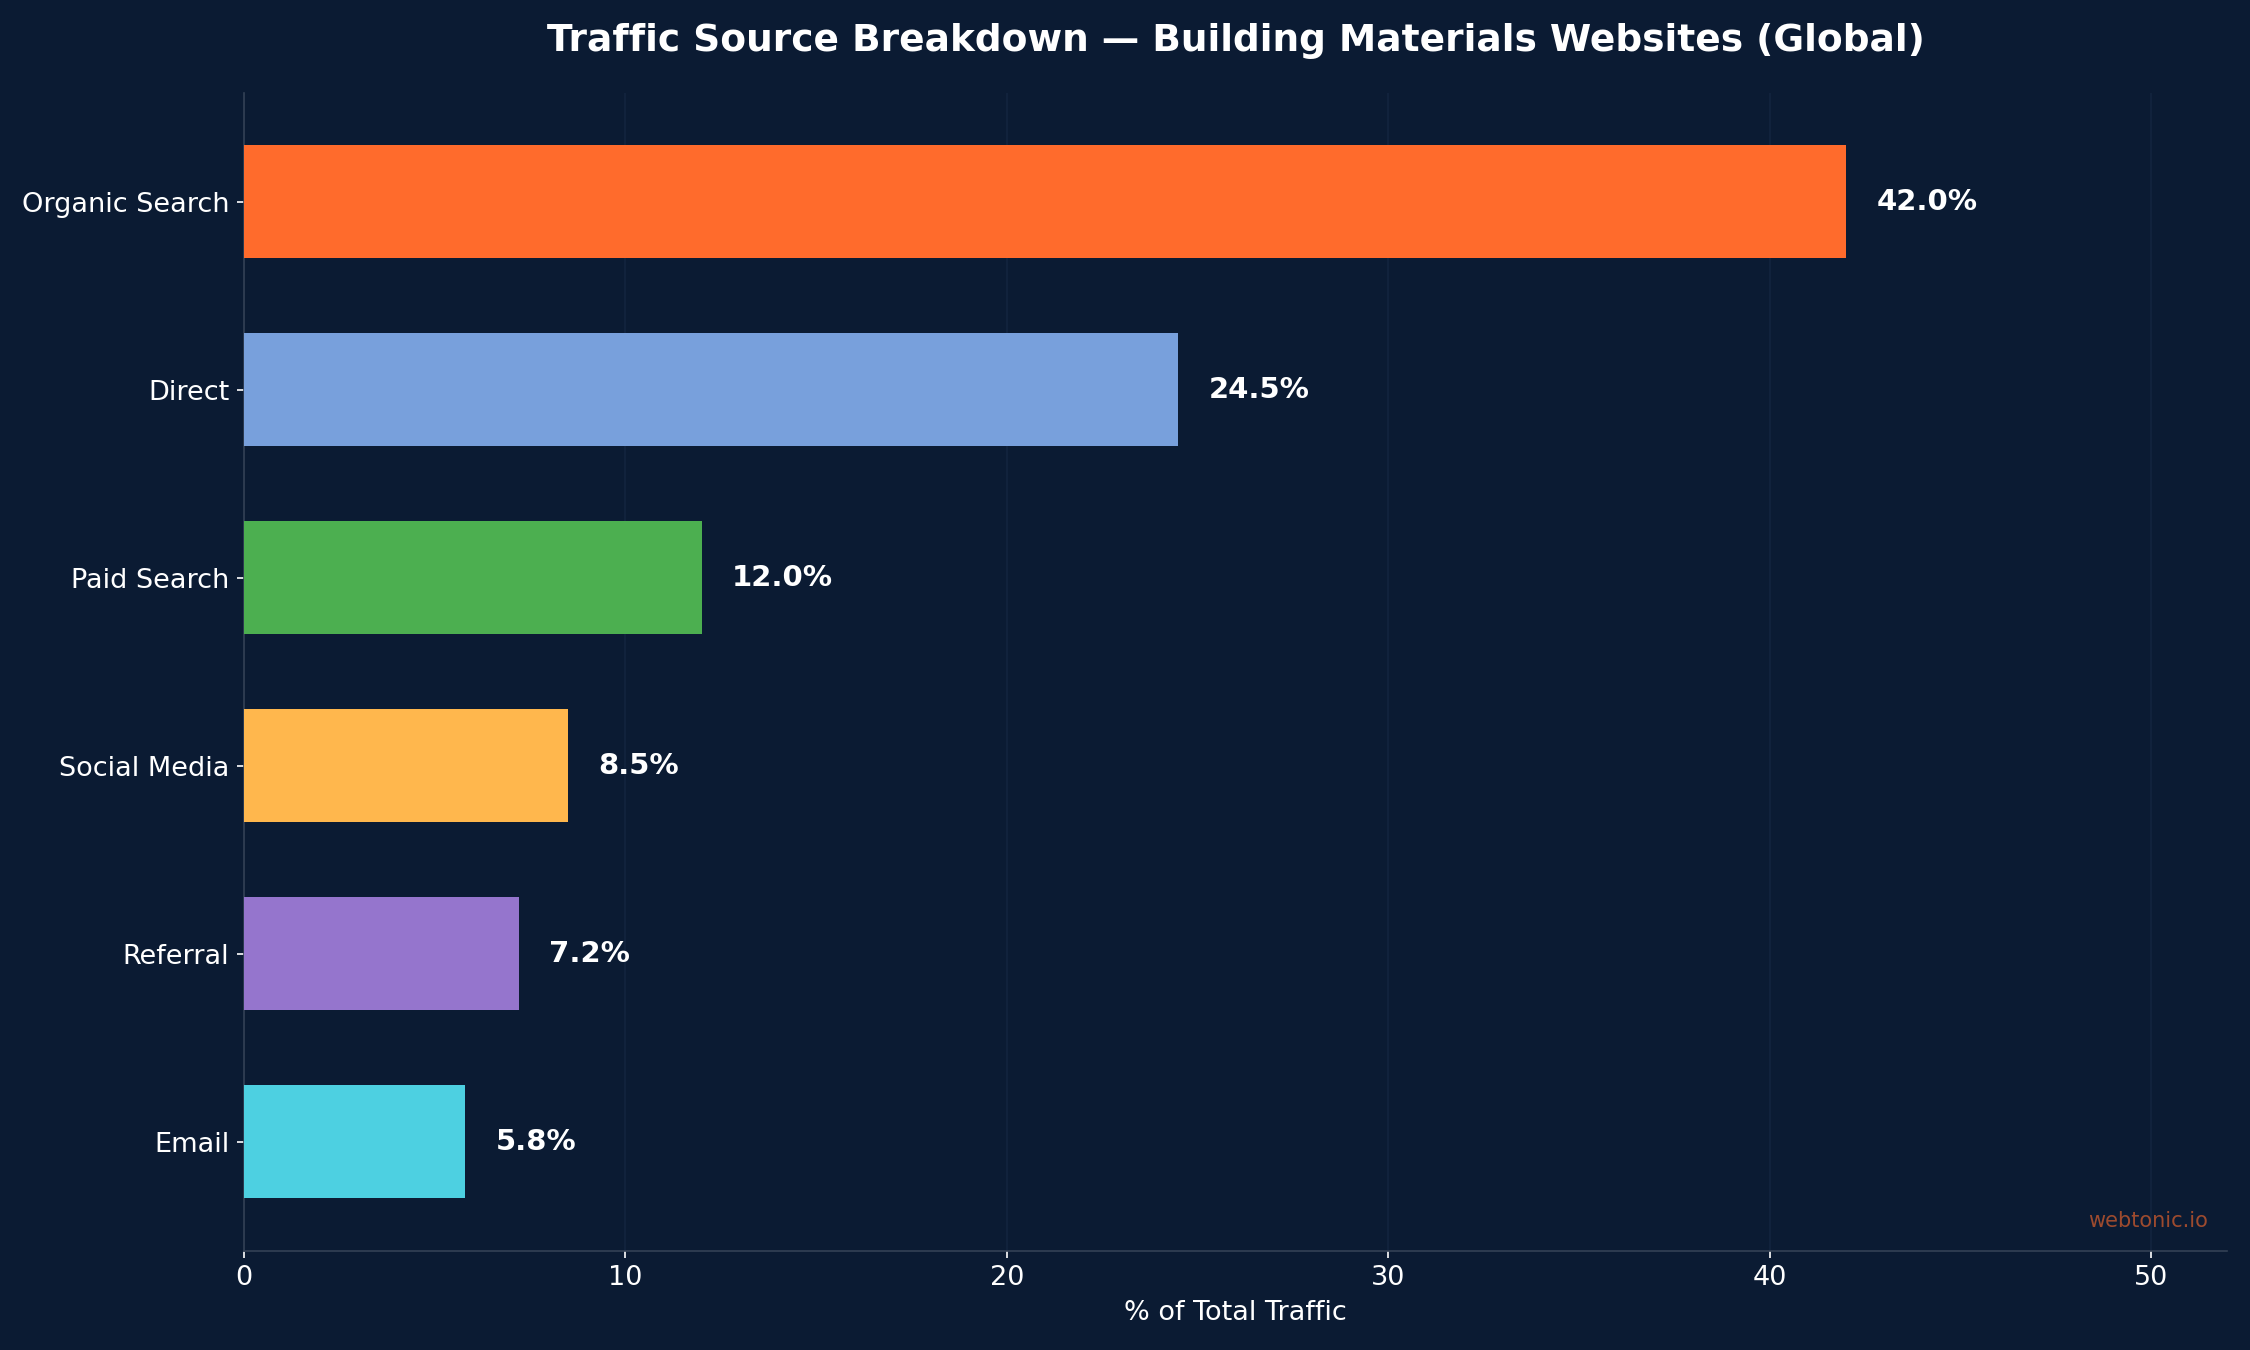
Organic search commands the largest share of traffic for building materials companies at 42% globally (38% in the U.S.). The higher U.S. paid search share (18.5% vs. 12% global) reflects heavier Google Ads investment by American distributors competing for high-intent product queries. Direct traffic at 24.5% signals strong brand recognition among repeat buyers — contractors and procurement managers who bookmark supplier sites and return regularly for pricing and availability.
Schema Markup and Structured Data Adoption
Structured data is one of the highest-ROI technical SEO investments, yet adoption in construction materials remains low:
| Schema Type | Adoption Rate | CTR Impact | Recommendation |
|---|---|---|---|
| Product Schema | ~18% | +25–35% rich snippet CTR | Mandatory for all product pages |
| LocalBusiness Schema | ~30% | +20% Local Pack visibility | Essential for distributors with locations |
| FAQPage Schema | ~12% | +15–20% SERP real estate | Add to product category pages |
| Project/Case Study Schema | ~8% | +40% branded CTR | High priority for portfolio pages |
The standout finding: construction firms with schema-marked project case studies average 40% higher click-through rates on branded searches (Authority Specialist 2026). Yet only about 8% of firms implement this schema type — a massive untapped advantage for early adopters.
Domain Authority and Backlink Benchmarks
AltCMO's analysis of the top 1,000 U.S. contractors (ENR's Top 400 Contractors and Top 600 Specialty Contractors) revealed these authority benchmarks:
| Metric | 2024 | 2025 | YoY Change |
|---|---|---|---|
| Domain Authority (Median) | 33 | 32 | -3% |
| Backlinks (Median) | 1,008 | 1,744 | +73% |
| Spam Score | 2 | 2 | 0% |
| Desktop Page Speed | 73 | 75 | +3% |
| Mobile Page Speed | 56 | 56 | 0% |
The 73% surge in median backlinks (1,008 → 1,744) without a corresponding DA increase suggests the industry is building more links but not necessarily higher-quality ones. The stable spam score of 2 is healthy, indicating most construction firms avoid toxic link practices. Mobile page speed remaining flat at 56 for two consecutive years points to a systemic neglect of mobile optimization.
Technical SEO Best Practices for Construction Materials Companies
- Compress and lazy-load product images — construction catalogs average 2–5 MB per product page; converting to WebP and implementing lazy loading can cut LCP by 40–60%.
- Serve spec sheets as HTML — replace PDF-only technical documents with crawlable HTML versions to recapture authority signals from 30–40% of currently wasted indexed URLs.
- Implement Product and LocalBusiness schema — at 18% and 30% adoption respectively, early movers gain disproportionate rich snippet visibility.
- Fix faceted navigation — canonical tags, parameter handling, and robots directives for filter combinations prevent crawl waste on large catalogs.
- Build 15+ indexed project/portfolio pages — this is the minimum threshold for competing on high-value commercial queries regardless of domain age.
- Prioritize mobile speed — with 58% of traffic on mobile and a persistent 56/100 score, the largest technical SEO ROI sits in mobile performance improvements.
- Maintain clean XML sitemaps — audit monthly to remove non-indexable URLs, deleted products, and orphaned PDFs.
- Optimize for localized queries — with 30–45% YoY growth in local construction searches, ensure NAP consistency, location pages, and GBP integration across all branches and showrooms.
Site Architecture Benchmarks for Large Product Catalogs
Construction materials suppliers with 5,000+ SKUs face unique site architecture challenges. The most effective sites follow a shallow hierarchy: homepage → category (lumber, hardware, insulation, fixtures) → subcategory → product page, keeping every product within 3–4 clicks of the homepage. Industry audits show that sites exceeding 5 levels of depth see a 35–45% drop in deep-page crawl frequency.
Internal linking density is another critical metric. Top-performing construction materials sites maintain an average of 8–12 internal links per product category page, connecting related products, specification guides, and project case studies. Sites with fewer than 4 internal links per category page show measurably lower rankings for mid-tail product queries. The best practice is a hub-and-spoke model where category pages serve as content hubs linking out to individual products, related blog articles, and installation guides — creating topical clusters that signal comprehensive expertise to search engines.
Breadcrumb navigation with BreadcrumbList schema is implemented on approximately 28% of building materials sites. This seemingly minor technical element improves crawlability, provides additional SERP real estate through breadcrumb rich snippets, and helps users (particularly contractors navigating complex catalogs) understand their position within the site hierarchy.
Technical SEO ROI: Construction Materials vs. Other B2B Sectors
Organic search delivers the highest return among all digital marketing channels for construction materials companies. The math is straightforward: with 42% of traffic from organic search and an average website conversion rate of 2.8% (CuFinder 2026), a construction materials site generating 50,000 monthly visits can attribute roughly 21,000 organic visits and 588 conversions to SEO — without ongoing per-click costs.
Compare that to Google Ads in the same vertical, where CPC ranges from $2.85–$3.50 (CuFinder 2026). Those same 21,000 clicks would cost $59,850–$73,500 monthly through paid search. Even accounting for the investment in technical SEO improvements (typically $3,000–$8,000/month for mid-size distributors), the organic channel delivers 7–15× ROI over paid search within the first 12 months.
The construction materials sector sits between pure B2C industries (which see faster SEO returns due to higher search volumes) and traditional B2B niches (which face longer sales cycles). The key differentiator is purchase intent: contractors searching for "structural steel beams I-beam pricing" or "R-30 insulation bulk pricing" carry immediate project-driven intent similar to B2C product searches, making technical SEO improvements translate to revenue faster than in consulting or SaaS verticals.
Frequently Asked Questions
What is the average page speed score for construction materials websites?
The average desktop page speed score is 75/100 and the average mobile page speed score is 56/100 for top U.S. contractors, according to AltCMO's 2025 benchmark of 1,000 firms. The mobile score sits well below Google's "good" threshold of 75, meaning most construction sites fail mobile performance checks.
How much traffic do construction materials sites get from organic search?
Organic search drives 42% of global traffic (38% in the U.S.) to building and construction materials websites, making it the single largest traffic channel ahead of direct (24.5%) and paid search (12% global / 18.5% U.S.), per CuFinder's 2026 industry benchmarks.
Does schema markup help construction company SEO?
Yes — significantly. Construction firms with schema-marked project case studies see 40% higher click-through rates on branded searches. Product schema can boost rich snippet CTR by 25–35%, yet only about 18% of building materials sites have implemented it as of 2026.
What is a good domain authority for a construction company?
The median domain authority for top U.S. contractors is 32. Top-quartile firms score 50+. A DA above 40 positions a construction materials site competitively for mid-volume commercial keywords, though local search performance depends more on GBP optimization and review signals than raw DA.
Why is mobile SEO important for construction materials companies?
Mobile devices account for 58.4% of construction industry traffic and 65–75% of initial residential construction searches. Google uses mobile-first indexing, so the mobile version of your site determines rankings. Despite this, mobile page speed scores have remained flat at 56/100 for two consecutive years — firms that close this gap gain a measurable ranking advantage.
Sources
CuFinder — Building & Construction Materials Industry Marketing Benchmarks 2026
AltCMO — Construction SEO Benchmarks: 2024 vs. 2025
AltCMO — Good SEO Metrics for Construction Companies
Authority Specialist — Construction SEO Benchmarks: 2026 Data
CuFinder — Construction Industry Marketing Benchmarks 2026
SCUBE Marketing — SEO for Building Materials Brands
WorldMetrics — Marketing In The Construction Industry: 2026 Verified Stats