Table of contents
The gap between an average brand ambassador program and a top-performing one is not budget or brand size - it is a sixfold difference in referred revenue, measured from live programs rather than a marketer survey. Here is what the 2026 data says about what separates them.
Key Takeaways
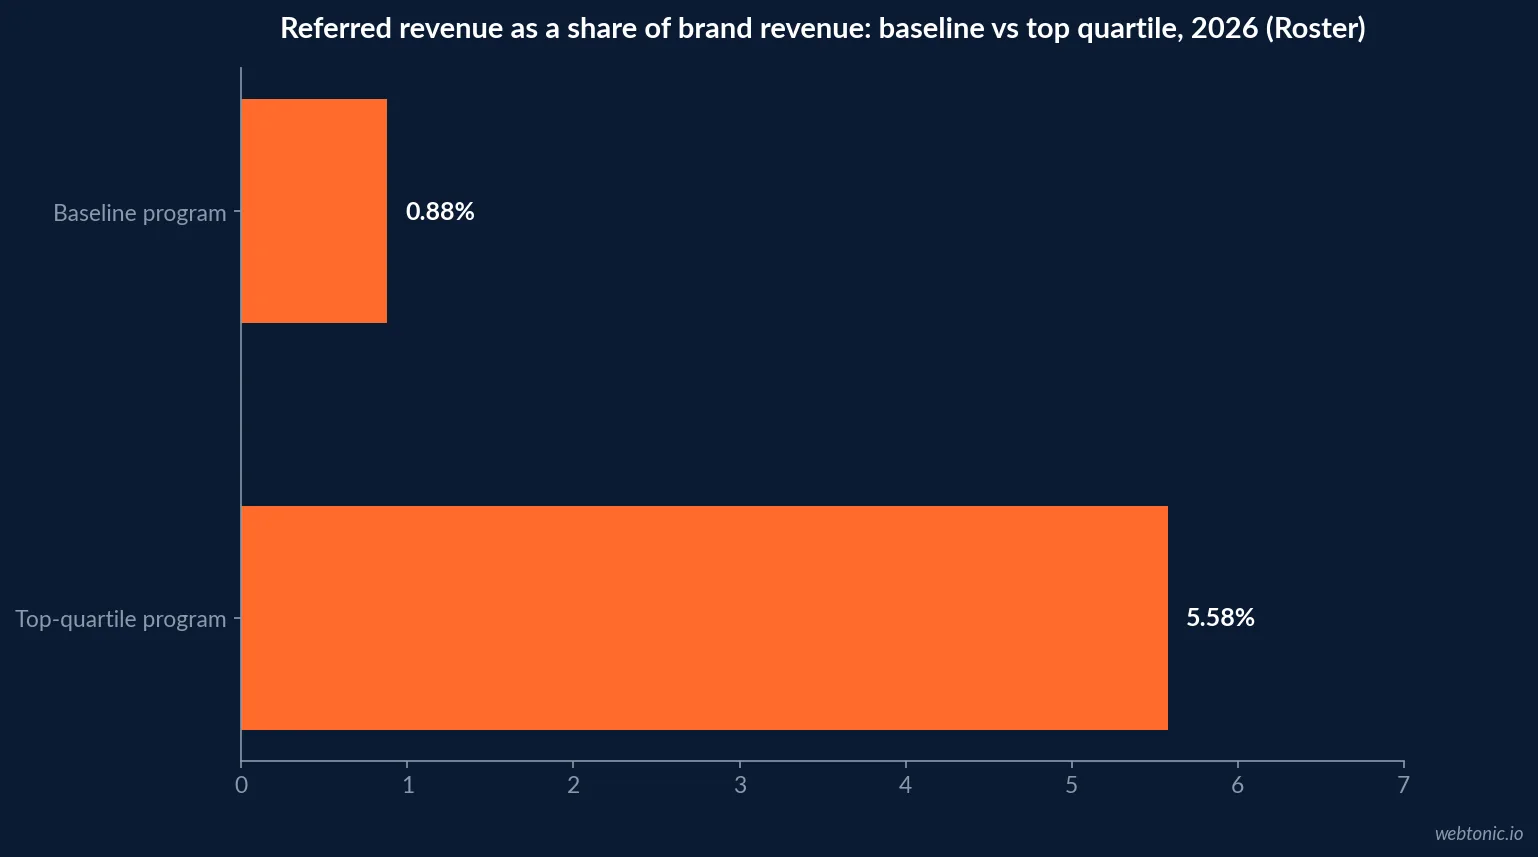
- Top-quartile ambassador programs refer 5.58% of brand revenue, per Roster's 2026 data.
- The baseline program at the same size refers only 0.88%, a sixfold gap.
- On a USD 25 million brand that gap is worth USD 1,175,000 a year.
- Each active member drives USD 63 a month in the top quartile, versus USD 20 baseline.
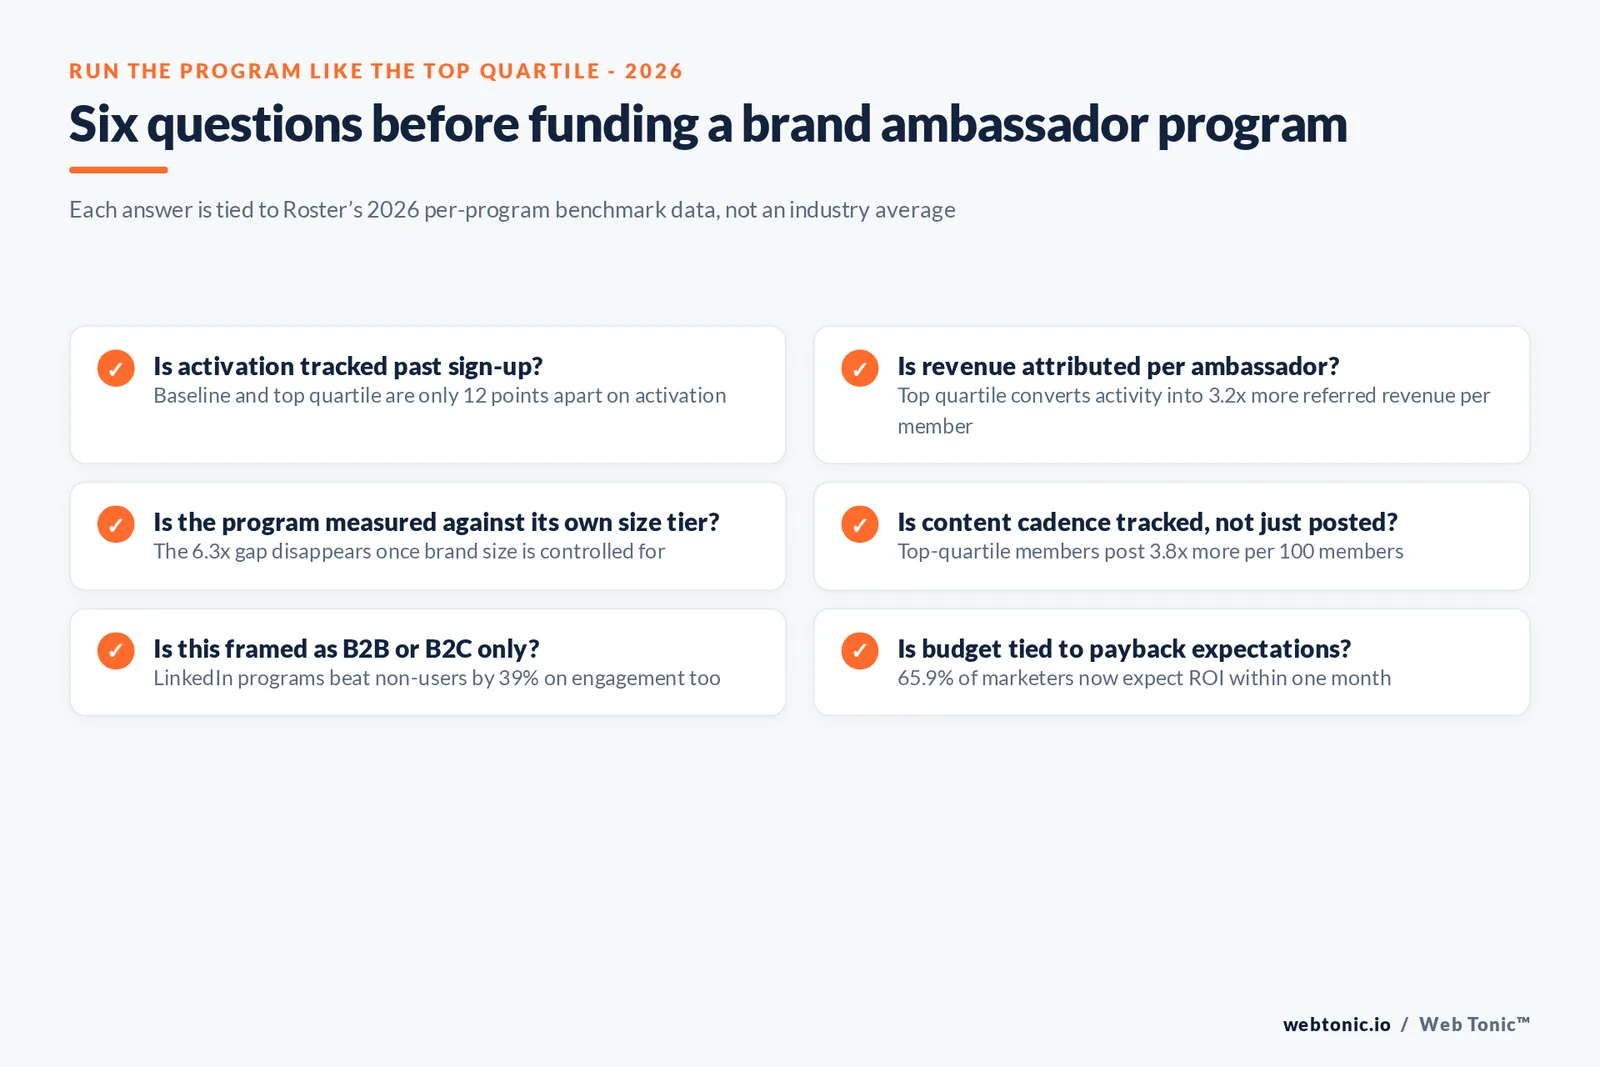
- Member activation rates are 92% top quartile versus 80% baseline, only 12 points apart.
- Top-quartile members post 3.8 times more content per 100 members than baseline.
- B2B ambassador and creator programs outperform non-users by up to 39% on engagement.
- The same programs beat non-users by 30% on revenue growth and lead generation.
- Global influencer marketing spend crossed USD 44 billion in 2026, up 18% year over year.
- 87.49% of brands expect their influencer or ambassador budget to grow in 2026.
- 66.3% of brands now run these programs entirely in-house.
- 65.9% of marketers expect ROI payback within one month of launching a program.
- Brands earn an average of USD 5.78 for every USD 1 spent across influencer channels.
- Branding is a named 2026 growth strategy in Sagefrog's B2B Marketing Mix Report.
The benchmark that matters: referred revenue, not follower count
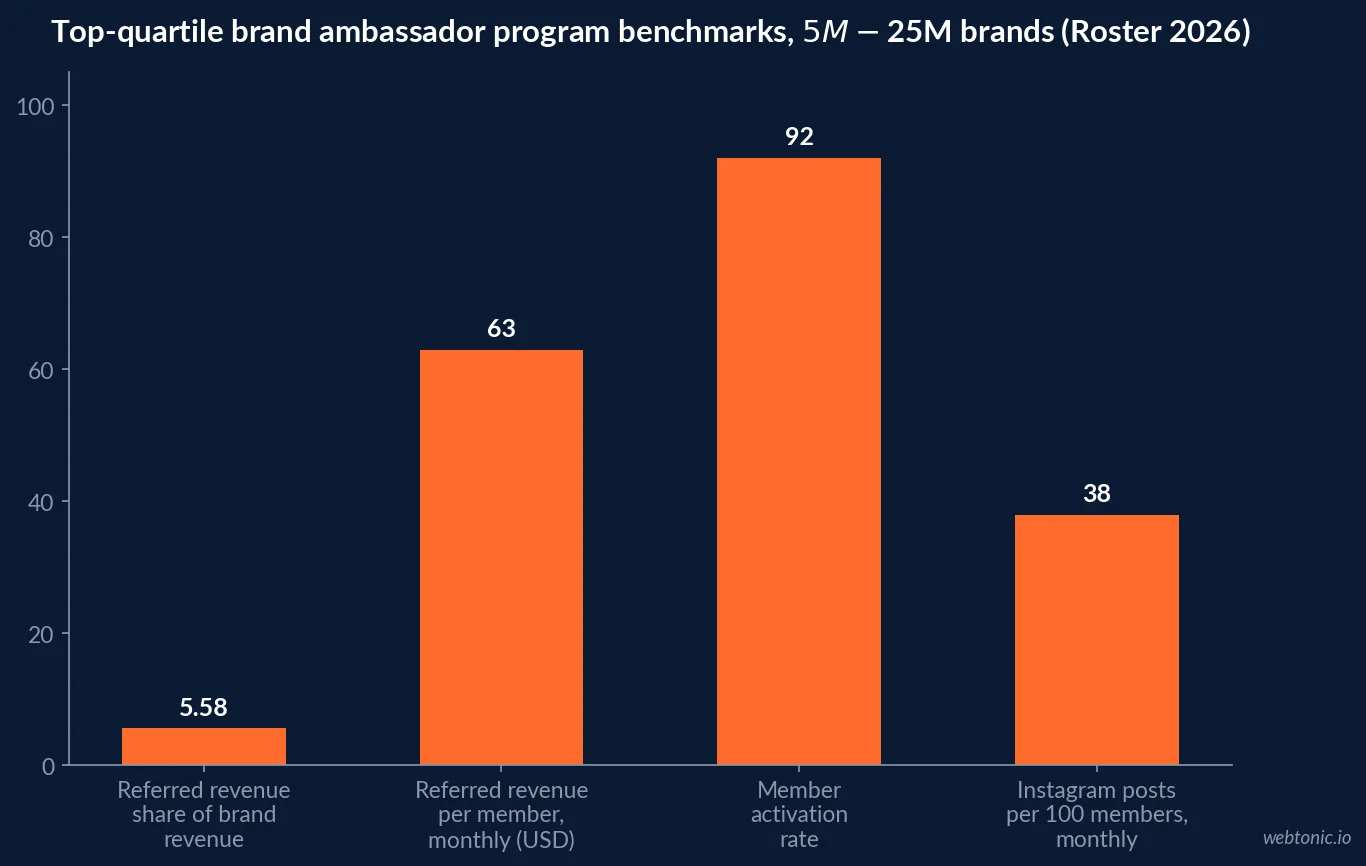
Roster's Ambassador Marketing Benchmarks 2026, built from live programs running on its platform between February and July 2026 rather than a marketer survey, measured established ecommerce and DTC ambassador programs (90-plus days old, 25-plus active members) at USD 5 million to USD 25 million in revenue. The baseline program refers 0.88% of brand revenue through its ambassadors. The top quartile at the identical revenue size refers 5.58% - a sixfold gap that Roster's own press release confirms is about how the program is run, not brand size or budget.
On a USD 25 million brand, that is USD 1,395,000 a year in referred revenue at the top-quartile rate against USD 220,000 at the baseline rate - an upside of USD 1,175,000 without adding a dollar of brand revenue.
| Metric ($5M-$25M brands, 2026) | Baseline | Top quartile | Gap |
|---|---|---|---|
| Referred revenue as share of brand revenue | 0.88% | 5.58% | 6.3x |
| Referred revenue per active member, monthly | USD 20 | USD 63 | 3.2x |
| Member activation rate | 80% | 92% | 12 points |
| Referral clicks per active member, monthly | 1.5 | 3.3 | 2.2x |
| Instagram posts per 100 active members, monthly | 10 | 38 | 3.8x |
What the dollar gap looks like at different brand sizes
Because the benchmark is a percentage of revenue, the absolute dollar gap scales with the size of the brand. Roster's own worked examples show the same 6.3x multiple applied at USD 10 million and USD 100 million in annual revenue, which is useful for building a business case regardless of company size.
| Brand annual revenue | Baseline referred revenue (0.88%) | Top-quartile referred revenue (5.58%) | Annual upside |
|---|---|---|---|
| USD 10 million | USD 88,000 | USD 558,000 | USD 470,000 |
| USD 25 million | USD 220,000 | USD 1,395,000 | USD 1,175,000 |
| USD 50 million | USD 440,000 | USD 2,790,000 | USD 2,350,000 |
| USD 100 million | USD 880,000 | USD 5,580,000 | USD 4,700,000 |
Brand ambassadors versus influencers
The terms get used interchangeably, but the underlying relationship is different. An influencer's primary value is audience size, and the arrangement is usually transactional and short-term: a fee for a defined number of posts tied to a launch or campaign. A brand ambassador's primary value is expertise, renown or an existing relationship with your buyer, and the arrangement is a long-term partnership, often running years rather than weeks, with compensation that can include product access, revenue share or co-creation rather than a flat per-post fee.
That distinction matters for measurement: an influencer campaign is judged on reach and immediate conversion, while an ambassador program is judged on the referred-revenue and retention metrics Roster's benchmark data tracks over months, not days.
| Dimension | Influencer relationship | Brand ambassador relationship |
|---|---|---|
| Primary value to the brand | Audience size and reach | Expertise, renown or existing customer relationship |
| Typical duration | Single campaign or launch | Months to years |
| Compensation | Fee per post or deliverable | Product access, revenue share, co-creation, retainer |
| How it is measured | Reach, impressions, immediate conversion | Referred revenue, retention, lifetime value |
| Depth of product knowledge | Often limited to the brief | Deep, ongoing familiarity |
B2B brand ambassador adoption is accelerating
Ambassador programs are not only a DTC and ecommerce tactic. Per Moburst's review of the LinkedIn-Ipsos 2025 B2B Marketing Benchmark, brands running influencer or ambassador programs on LinkedIn outperform non-users by up to 39% on customer engagement and brand awareness, and by 30% on revenue growth and lead generation. B2B influencer and ambassador spend is growing at roughly 47% year over year, faster than the broader industry's approximately 30% growth rate.
Sagefrog's 2026 B2B Marketing Mix Report, now in its 19th edition, describes branding as a defined growth strategy for B2B marketers this year rather than a nice-to-have layered on top of demand generation - the context in which B2B ambassador programs are being funded.
The reason B2B teams keep funding these programs at all traces back to a well-documented buying pattern. The LinkedIn B2B Institute's 95-5 Rule research finds roughly 95% of B2B buyers are not in the market for a given purchase at any point in time - only about 5% are actively buying in any given quarter. That is the case for keeping an ambassador relationship running continuously rather than campaign-by-campaign: a long-term ambassador stays visible to the 95% who are not buying yet, so the brand is already familiar when they finally are.
| B2B ambassador/influencer fact (2026) | Figure | Source |
|---|---|---|
| Engagement and awareness lift for LinkedIn programs | Up to 39% | LinkedIn-Ipsos 2025 B2B Marketing Benchmark |
| Revenue growth and lead-gen lift for LinkedIn programs | Up to 30% | LinkedIn-Ipsos 2025 B2B Marketing Benchmark |
| B2B influencer/ambassador spend growth | ~47% YoY | Moburst, State of B2B Influencer Marketing 2026 |
| Overall influencer industry growth | ~30% YoY | Moburst, State of B2B Influencer Marketing 2026 |
Where ambassador budgets are heading in 2026
Budget sentiment is running well ahead of caution across the wider creator economy that ambassador programs sit inside. Aspire's State of Influencer Marketing 2026, now in its eighth consecutive year, and Sprout Social's 2026 Influencer Marketing Report both point the same direction: budgets are growing, programs are moving in-house, and payback expectations are compressing.
Global influencer marketing spend, the category ambassador programs fall under, crossed USD 44 billion in 2026, up 18% from USD 37.1 billion in 2025, and 87.49% of brands expect their budget for it to increase further this year. 66.3% of programs now run entirely in-house, and brands report earning an average of USD 5.78 for every USD 1 spent across the category.
| Budget and structure fact (2026) | Figure | Source |
|---|---|---|
| Global influencer marketing spend | USD 44 billion | Industry reporting, June 2026 |
| Growth versus 2025 (USD 37.1B) | +18% | Industry reporting, June 2026 |
| Brands expecting budget to increase | 87.49% | Influencer Marketing Hub 2026 Benchmark |
| Programs run entirely in-house | 66.3% | Influencer Marketing Hub 2026 Benchmark |
| Marketers expecting payback within one month | 65.9% | Influencer Marketing Hub 2026 Benchmark |
| Average return per USD 1 spent | USD 5.78 | Influencer Marketing Hub 2026 Benchmark |
Why long-term ambassadors outperform one-off influencer posts
We Are Social's Think Forward 2026 research, surveying 300 marketers in the US and UK, finds creators outperform the average media channel by 51% in long-term ROI when the relationship is sustained rather than transactional. The same report finds 51% of Americans say sharing content on social media is important to expressing their fandom for a brand - a behavior an ambassador relationship is built to encourage and a single sponsored post is not. Aligned with that, 95% of marketers surveyed by We Are Social now call social media a critical tool for brand building, not just a performance channel.
The practical implication for a 2026 program is sequencing: treat the first few months of an ambassador relationship as activation, measured the way Roster measures it, then let the relationship compound past the point a one-off influencer deal would have ended.
| Long-term vs one-off relationship signal (2026) | Figure | Source |
|---|---|---|
| Long-term ROI advantage of sustained creator relationships | +51% | We Are Social, Think Forward 2026 |
| Americans for whom social sharing expresses brand fandom | 51% | We Are Social, Think Forward 2026 |
| Marketers calling social critical for brand building | 95% | We Are Social, Think Forward 2026 |
What actually separates a top-quartile program
Roster's data shows the gap is not where most brands assume it is. Activation rate - getting an ambassador to do anything at all in a 30-day window - is 80% at baseline and 92% at top quartile, a difference of only 12 points. The real separation shows up after activation: top-quartile members post 3.8 times more content per 100 members and generate 3.2 times more referred revenue per active member. Almost every established program gets ambassadors to participate; far fewer turn that participation into a tracked sale, which is the operating discipline that produces the sixfold revenue gap.
Our growth marketing team builds the attribution layer that makes referred revenue trackable in the first place, which is the prerequisite for knowing which side of that 6x gap your own program sits on.
How to read ambassador ROI claims critically
Industry-wide averages like "USD 5.78 per USD 1 spent" are useful for a budget conversation but mask enormous variance between individual programs, which is exactly what Roster's per-program benchmark data is built to expose. When a vendor or agency quotes a single ROI number for ambassador marketing, ask which revenue tier and which percentile it represents - the difference between a baseline and a top-quartile program at the same brand size is worth six times more, and that is the number that should set your program's targets, not the industry average.
See our related breakdown of when paid social ROI claims hold up for the same critical-reading approach applied to a different channel, or talk to us about building that attribution layer for your own program.
Frequently Asked Questions
What is a brand ambassador program worth in referred revenue?
Roster's Ambassador Marketing Benchmarks 2026, measured from live programs rather than a survey, found the baseline ecommerce or DTC program at USD 5 million to USD 25 million in revenue refers 0.88% of brand revenue through its ambassadors. The top quartile at the same size refers 5.58%, a sixfold difference. On a USD 25 million brand that gap is worth USD 1,175,000 a year.
How is a brand ambassador different from an influencer?
The B2B Institute and multiple industry write-ups describe the distinction the same way: an influencer's primary value is the size of their following and the relationship is usually transactional, fee-per-post. A brand ambassador's primary value is their expertise, renown or existing relationship with your customer, and the relationship is a long-term partnership that can run years rather than a single campaign.
Do B2B companies use brand ambassador programs?
Yes, and adoption is accelerating on LinkedIn specifically. Moburst's review of the LinkedIn-Ipsos 2025 B2B Marketing Benchmark found brands running ambassador or creator programs outperform non-users by up to 39% on engagement and brand awareness and by 30% on revenue growth and lead generation. Sagefrog's 2026 B2B Marketing Mix Report separately shows branding has become a named growth strategy for B2B marketers this year, not just a demand-generation afterthought.
What content output should a brand ambassador produce?
There is no universal quota, but the direction across 2026 research is toward more, not fewer, touchpoints per ambassador and toward longer program tenure. Aspire's State of Influencer Marketing 2026 and Sprout Social's 2026 Influencer Marketing Report both track a shift toward retained, always-on creator relationships over one-off posts, which is the same shift Roster's benchmark data shows paying off in referred revenue.
What is the biggest mistake brands make with ambassador programs?
Treating activation as the finish line. Roster's data shows the gap between a baseline and a top-quartile program is only 12 points on activation rate (80% versus 92%) but six times wider on referred revenue. Almost every established program gets ambassadors to do something; far fewer turn that activity into a tracked sale, which is where the real gap between average and top-quartile programs opens up.
Sources
Roster - Ambassador Marketing Benchmarks 2026
PRWeb - Roster Ambassador Marketing Benchmarks 2026 press release
Moburst - The State of Influencer Marketing for B2B Brands in 2026
Sagefrog - 2026 B2B Marketing Mix Report
Aspire - The State of Influencer Marketing 2026
Sprout Social - The 2026 Influencer Marketing Report
We Are Social - Think Forward 2026
LinkedIn B2B Institute - The 95-5 Rule