



Table of contents
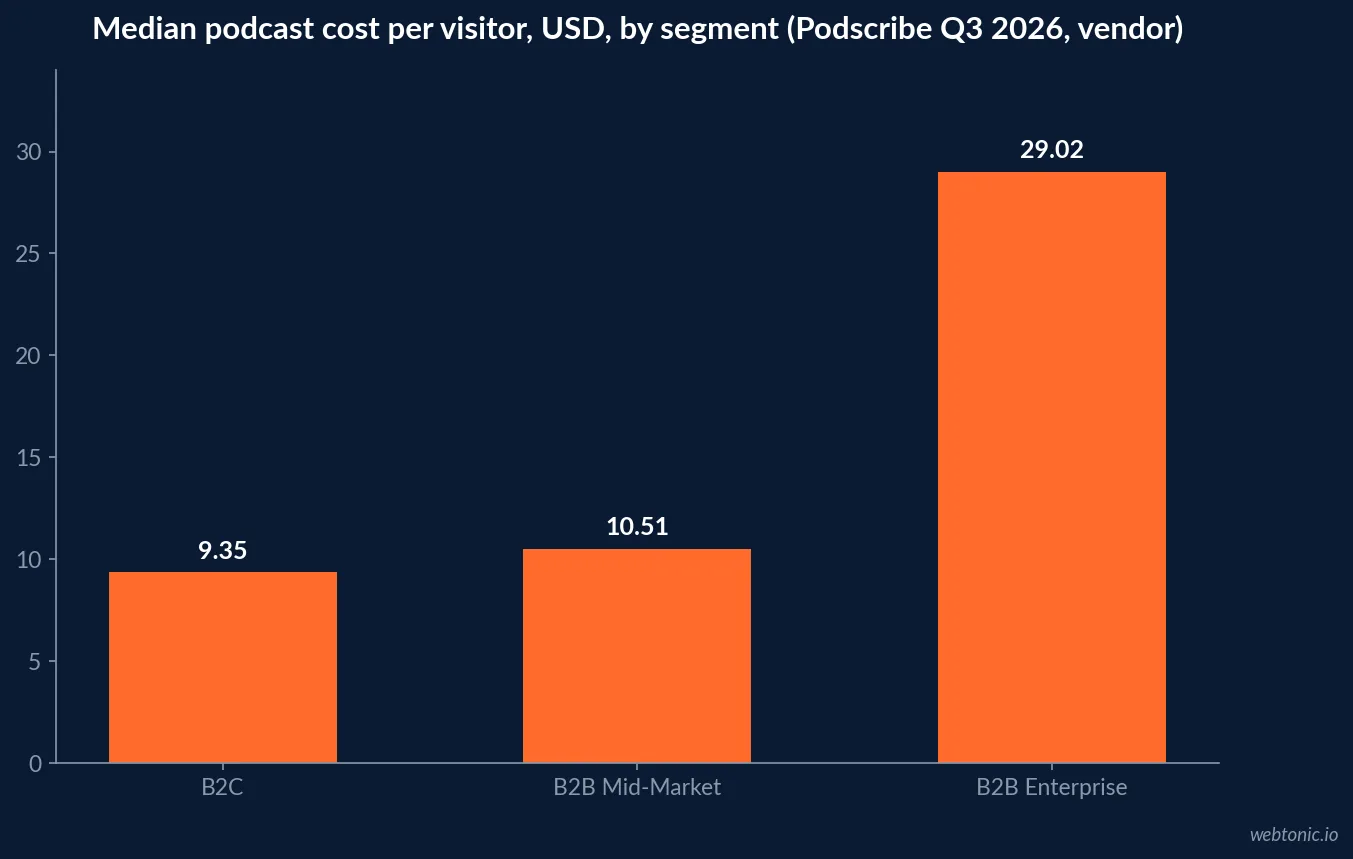
B2B is one of the few categories with its own podcast benchmark: Podscribe's 2026 data shows enterprise visits costing close to three times mid-market visits. No SaaS-only figure exists, so this page separates B2B segment data from cross-industry data at every step.
Key Takeaways
- B2B enterprise median cost per visitor: USD 29.02 (Podscribe Q3 2026, vendor).
- B2B mid-market: USD 10.51 per visitor and USD 278 CPA.
- B2C: USD 9.35 per visitor and USD 162 CPA.
- Enterprise visitor rate 0.09% vs 0.20% mid-market.
- US podcast ad revenue hit USD 2.9 billion in 2025, up 17.6% (IAB/PwC).
- Technology shows drew just 0.6% of 2023 podcast revenue by genre (IAB/PwC).
- Libsyn's Technology CPM was USD 29 in August 2024 (vendor).
- 18% of weekly podcast consumers own a business (Edison, 2025).
- Host-read ads: 3.22% response vs 2.09% produced (Magellan AI, vendor).
- Median B2B SaaS CAC payback is 16 months (Benchmarkit CY-2025).
The only B2B podcast benchmark in the market
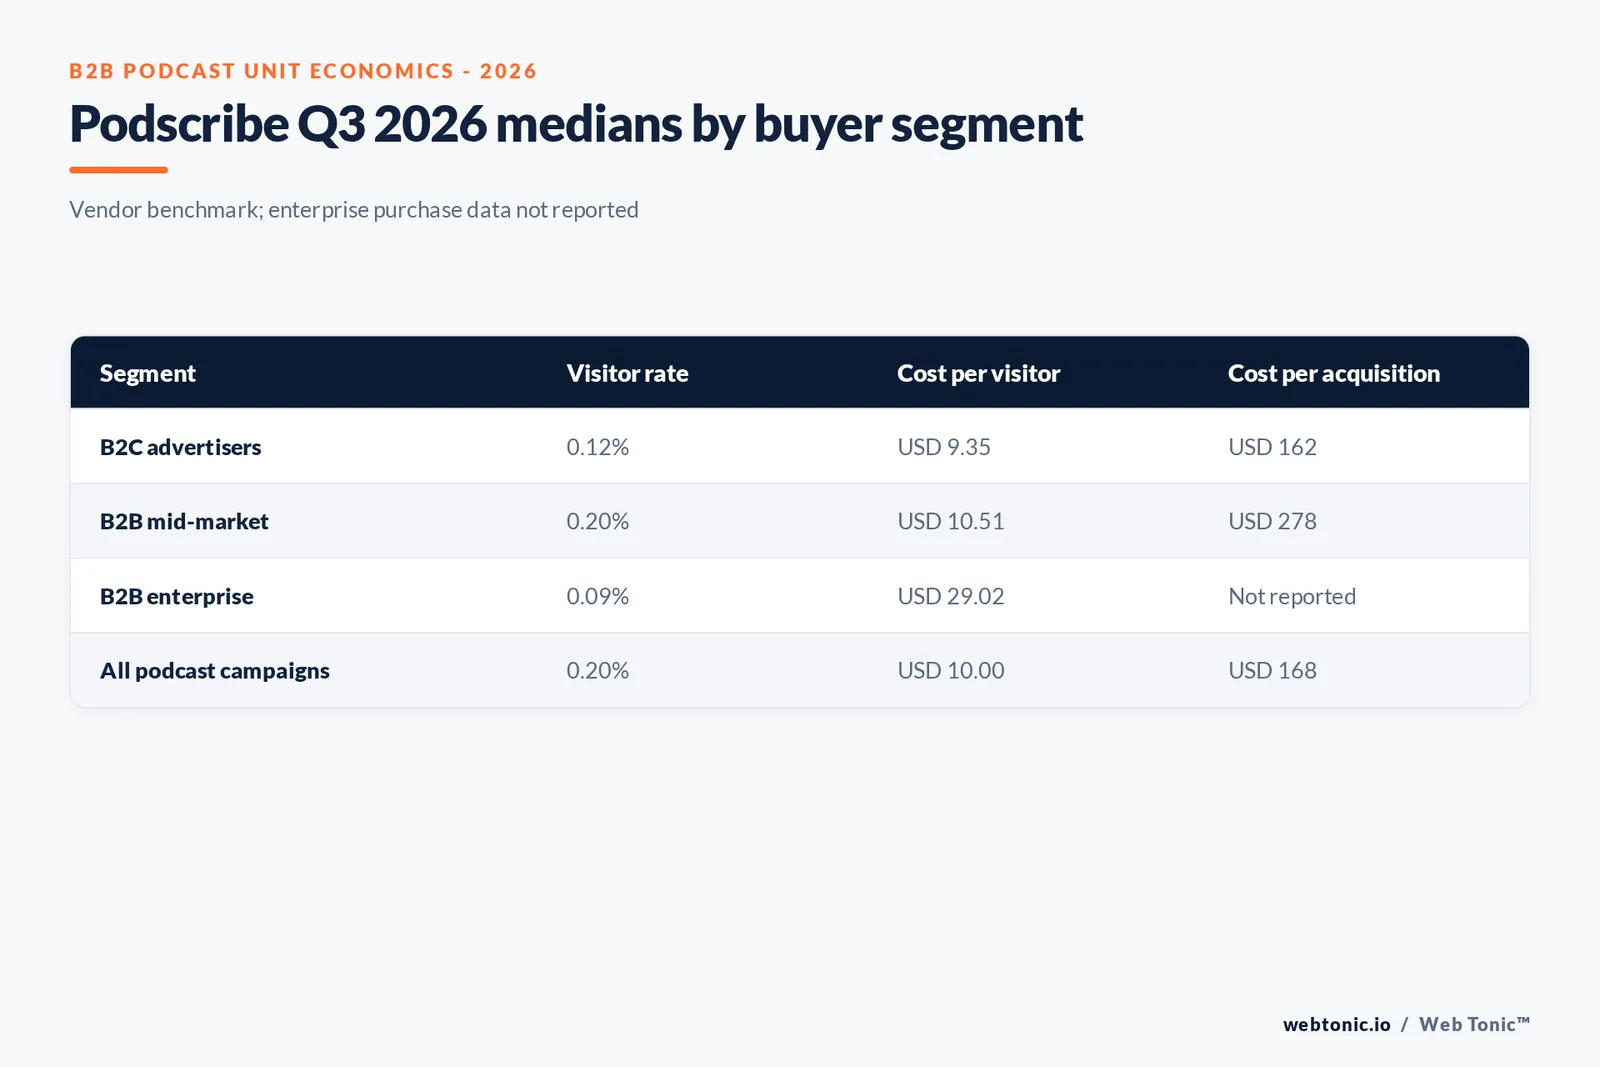
Podscribe's Q3 2026 Performance Benchmark Report covers campaigns from August 2025 to July 2026, more than 105,000 campaigns and 36 billion impressions, and it defines three segments. B2B enterprise sells high-cost, complex solutions to large organisations, with contracts often USD 100,000+ a year. B2B mid-market sells to SMBs, startups and mid-sized firms, with contracts that can start as low as USD 1,000 a year. B2C sells to consumers.
Most SaaS companies fit one of the two B2B definitions cleanly, which makes this the closest thing to a SaaS podcast benchmark that exists. It is still vendor data measured on Podscribe's own platform.
| Segment (Podscribe Q3 2026) | Median visitor rate | Median cost per visitor | Median CPA |
|---|---|---|---|
| B2B enterprise | 0.09% | USD 29.02 | Not reported |
| B2B mid-market | 0.20% | USD 10.51 | USD 278 |
| B2C | 0.12% | USD 9.35 | USD 162 |
| All podcast campaigns | 0.20% | USD 10.00 | USD 168 |
Why enterprise numbers look worse, and are not
An enterprise visitor rate of 0.09% and a cost per visitor near three times the mid-market figure look like a warning. They mostly reflect the audience: few listeners are in-market for a six-figure platform at any given moment. Podscribe says it cannot report enterprise purchase rates or CPA because most enterprise purchases happen through signed contracts and handshakes.
The useful comparison is against the value of one opportunity. For a mid-market product, a USD 278 CPA is measurable within the window; for enterprise, the right metric is pipeline sourced or influenced, tracked in the CRM.
Put differently, at the enterprise median of USD 29.02 per visitor, a hundred site visits from a podcast flight cost about USD 2,900. If one of those visits becomes a qualified opportunity on a USD 100,000 contract, the channel has paid for itself many times over, and no 30-day purchase metric would ever show it.
Reach: business listeners at national scale
Edison Research's Infinite Dial 2026 (n=2,050, January 2026) puts monthly podcast consumption at 58% of Americans 12+ (167 million), weekly at 45% (130 million) and 80% (230 million) who have ever consumed one. Among 35 to 54 year olds, the core of B2B buying committees, monthly reach is 68%.
Edison's Podcast Consumer 2025 adds the profile that matters for software: 18% of weekly podcast consumers own a business, 51% of monthly consumers hold a college degree against 46% of the population, and 47% earn USD 75K or more against 43%.
| Reach measure | Figure | Source and year | B2B reading |
|---|---|---|---|
| Monthly podcast consumers, 12+ | 58% / 167M | Edison Infinite Dial 2026 | Scale comparable to major social platforms |
| Weekly podcast consumers, 12+ | 45% / 130M | Edison Infinite Dial 2026 | Habitual listeners for frequency |
| Monthly reach, age 35-54 | 68% | Edison Infinite Dial 2026 | Buying-committee age band |
| Business owners, weekly consumers | 18% | Edison Podcast Consumer 2025 | SMB SaaS decision makers |
| College degree, monthly consumers | 51% vs 46% population | Edison Podcast Consumer 2025 | Knowledge-worker skew |
Tech podcasts are small by revenue share
The IAB/PwC FY2023 podcast revenue study lists Technology among genres outside its main chart at just 0.6% of 2023 podcast ad revenue. As an advertiser category, tech sits inside an Other bucket, with energy, government, law and others, worth 23.4%. The study defines a separate Business-to-Business category but its share appears only in a chart.
A small revenue share cuts both ways: less competition for inventory on tech shows, and fewer large shows to buy. That is the practical difference between a "tech podcast" buy and a "B2B SaaS" buy aimed at business, leadership and industry shows where your buyers already listen.
What tech and business shows cost
Libsyn Ads reported an average CPM of USD 21.25 for a 60-second spot in August 2024, with Government and Technology tied for the highest category CPM at USD 29 and Health and Fitness next at USD 24. That puts tech inventory roughly 36% above the marketplace average. These are rate data from one vendor marketplace, not an industry-wide price.
| Libsyn Ads rate point (vendor) | CPM | Period | Use for SaaS planning |
|---|---|---|---|
| 60-second average | USD 21.25 | August 2024 | Baseline for host-read packages |
| 60-second average | USD 21.93 | July 2024 | Month-on-month stability check |
| 60-second average | USD 22.10 | August 2023 | Year-on-year trend |
| Technology category | USD 29 | August 2024 | Tech-show premium |
| Government category | USD 29 | August 2024 | GovTech SaaS audiences |
Direct show, run-of-network or programmatic
B2B teams often default to buying named shows. Podscribe's buy-type data (first published in its Q2 2026 report and repeated in Q3) complicates that. Direct show buys posted the highest purchase rate at 0.027% but a USD 98 CPA; direct run-of-network (RON) buys had a 0.017% purchase rate and a USD 64 CPA; programmatic had 0.021% and USD 74, with the highest visitor rate at 0.32%. Podscribe's own summary: direct impressions are more efficient, programmatic wins per dollar.
The same report finds host-read ads more efficient per impression but less efficient per dollar than producer-read ads, at a 0.018% against 0.016% purchase rate and a USD 137 against USD 123 CPA. That sits alongside Magellan's response-rate gap in favour of host reads; the two vendors measure different outcomes.
For a SaaS brand the trade-off is concrete. Named business shows give context and host credibility for a considered purchase; network and programmatic buys give cheaper reach for a product with a self-serve trial. Many teams run both and let the pixel decide the split after 30 days.
| Buy type (Podscribe, all industries) | Visitor rate | Purchase rate | CPA |
|---|---|---|---|
| Direct show | 0.25% | 0.027% | USD 98 |
| Direct run-of-network | 0.28% | 0.017% | USD 64 |
| Programmatic | 0.32% | 0.021% | USD 74 |
| Host-read creative | Not split | 0.018% | USD 137 |
| Producer-read creative | Not split | 0.016% | USD 123 |
Market growth: where B2B dollars are joining
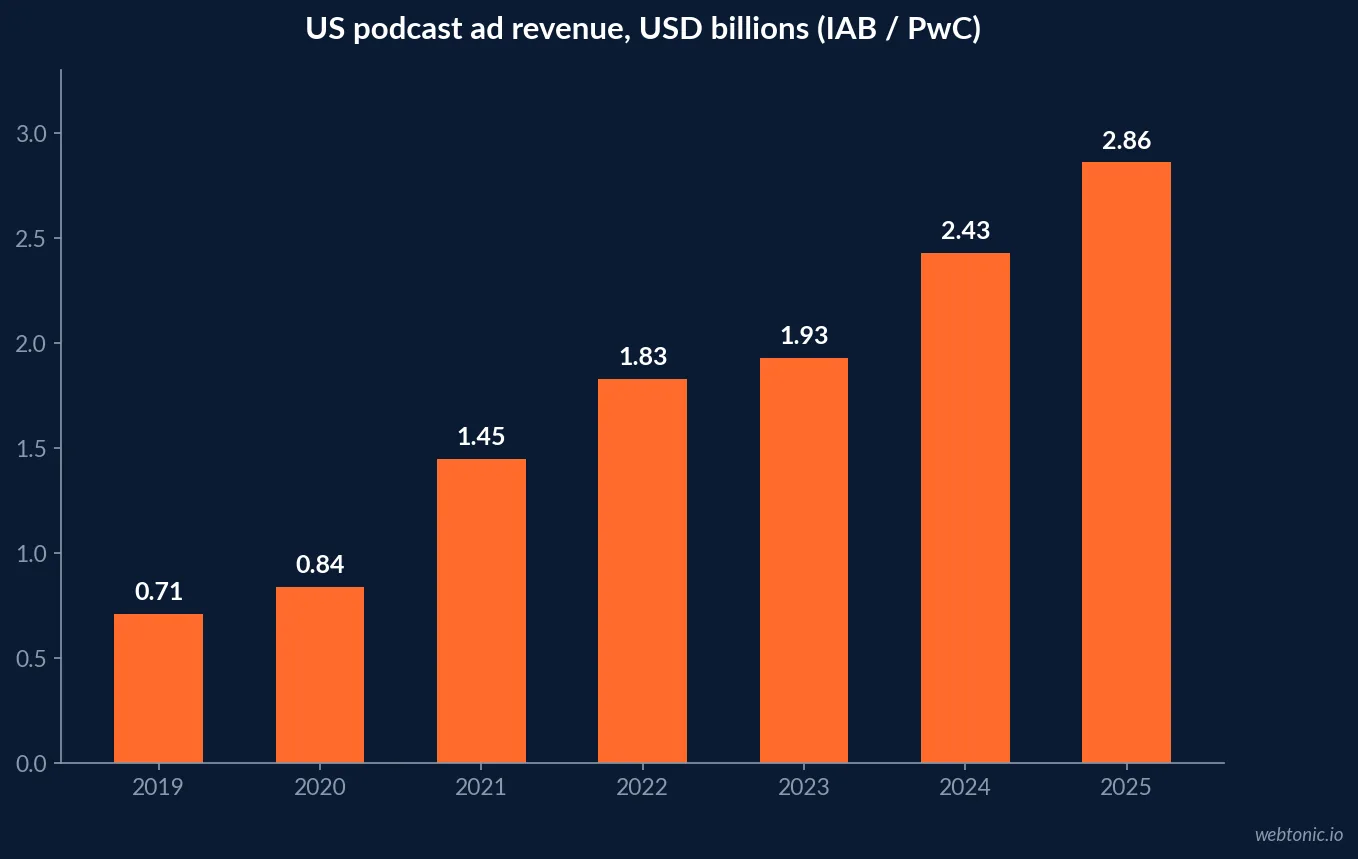
The IAB/PwC Internet Advertising Revenue Report FY2025 puts US podcast revenue at USD 2,862.2 million in 2025, up 17.6% from USD 2,433.1 million, after 26.4% growth in 2024. In 2019 it was USD 708.1 million. Magellan AI's Q4 2025 market benchmarks (vendor) counted spend up 32% year on year and 1,482 brands advertising on podcasts for the first time.
Host-read, produced and the brand-lift question
Magellan AI's Q2 2026 Measurement Benchmark Report (vendor, January to June 2026 medians) shows host-read ads at a 3.22% response rate against 2.09% for produced ads, with all-category response of 2.23%, lead conversion of 4.65% and a 55.5% repeat-listener rate for podcast promos. The iHeartMedia and Omnicom Media Intelligence 2026 study (vendor) reports a 22-point lift in unaided ad recall among in-market consumers from audio advertising.
For B2B, where most of the value is in being remembered when a buying cycle opens, recall is not a vanity metric. None of these figures is SaaS-specific.
Measuring against a 16-month payback
Benchmarkit CY-2025 benchmarks put median B2B SaaS CAC payback at 16 months, LTV to CAC at 4.1x for horizontal SaaS (5.6x for vertical) and a blended CAC ratio of USD 1.30. A podcast test judged on 30-day purchases will always look expensive against that horizon. Podscribe adds that pixel attribution captures about 4.2x the conversions of promo codes and vanity URLs, which capture about 24%.
Use a pixel for site response, a "how did you hear about us" field on demo forms, and CRM source tracking for pipeline. Our data and analytics team builds that attribution layer.
| Measurement layer | Signal | Benchmark to compare | Source |
|---|---|---|---|
| Site response | Pixel visitor rate | 0.20% mid-market, 0.09% enterprise | Podscribe Q3 2026 |
| Offer tracking | Promo code / vanity URL | Captures about 24% of conversions | Podscribe Q3 2026 |
| Lead creation | Demo or trial sign-ups | 4.65% median lead conversion of visitors | Magellan AI Q2 2026 |
| Revenue | CRM-sourced pipeline | 16-month median CAC payback | Benchmarkit CY-2025 |
Disclosure when a host vouches for software
Many B2B podcast deals include the host using the product. The FTC Endorsement Guides (16 CFR Part 255) require an endorsement to reflect the endorser's honest opinion and experience, and any material connection to be disclosed. A host who reads "we run our whole company on it" should actually do so.
A B2B SaaS audio test plan
- Pick the segment first. Mid-market products can be judged on Podscribe's USD 278 CPA benchmark; enterprise products should be judged on sourced pipeline.
- Buy context, then scale. Start with two or three business or industry shows your buyers name in sales calls, then add network or programmatic inventory once the pixel shows response.
- Budget for the tech premium. Libsyn's Technology CPM of USD 29 sits above its USD 21.25 average, so plan fewer impressions per dollar on tech shows.
- Give it 30 days minimum. Early reads show under half of eventual response.
- Log self-reported attribution. Demo forms with a free-text source field catch the listeners who never type the vanity URL.
- Report on the payback horizon. Tie the flight to opportunities opened, not only to trials started, so it is judged on the same 16-month clock as other channels.
Compare audio with our B2B SaaS and tech influencer and UGC statistics, B2B SaaS SMS marketing data and the connected TV advertising statistics hub.
Frequently Asked Questions
Is there a podcast benchmark for B2B SaaS companies?
Partly. Podscribe's Q3 2026 Performance Benchmark Report (vendor data) splits results into B2B enterprise, B2B mid-market and B2C. That is a B2B benchmark, not a SaaS-only one, and no published source gives a SaaS podcast CPM, CTR or cost per lead.
How much more do enterprise B2B podcast visits cost?
Podscribe reports a median cost per visitor of USD 29.02 for B2B enterprise advertisers against USD 10.51 for B2B mid-market and USD 9.35 for B2C. Enterprise visitor rate was 0.09% against 0.20% for mid-market. Podscribe does not report enterprise purchase rates because deals close on signed contracts.
What do tech podcasts charge?
On Libsyn Ads' marketplace, Technology was among the top CPM categories at USD 29 in August 2024, against a USD 21.25 average for 60-second spots. Those are one vendor's figures; Libsyn also says business and entrepreneur audiences command higher CPMs.
How long should a B2B SaaS team wait before judging a podcast test?
At least 30 days for response, and a full sales cycle for revenue. Magellan AI found campaigns judged at seven days showed less than half of what they eventually delivered, and Benchmarkit puts median B2B SaaS CAC payback at 16 months for CY-2025.
Should B2B brands use host-read ads?
The cross-industry evidence favours them. Magellan AI's Q2 2026 medians show host-read response at 3.22% against 2.09% for produced ads. When a host endorses a product, the FTC Endorsement Guides (16 CFR 255) require honest opinion and disclosure of the paid relationship.
Sources
Podscribe - Performance Benchmark Report Q3 2026
IAB/PwC - Internet Advertising Revenue Report FY2025
IAB/PwC - US Podcast Advertising Revenue Study FY2023
Edison Research - The Infinite Dial 2026
Edison Research - The Podcast Consumer 2025
Magellan AI - Podcast Measurement Benchmark Report Q2 2026
Magellan AI - Podcast advertising benchmarks Q4 2025
Libsyn - August 2024 podcast ad rates
Benchmarkit - CY-2025 B2B SaaS benchmarks
iHeartMedia - Omnicom audio study, April 2026
eCFR - 16 CFR Part 255, FTC Endorsement Guides


