



Table of contents
B2B SaaS marketers should budget for tech UGC from published creator rate cards - roughly USD 295 to 307 per collaboration in business and education niches - and weigh it against how little software buyers say they trust influencers. No study benchmarks SaaS creator programmes directly.
Key Takeaways
- US tech brands spent an estimated USD 1.9 billion on creators in 2025 (IAB).
- Total US creator ad spend is projected at USD 44 billion in 2026.
- 48% of creator ad buyers call creators a must-buy.
- Industry influencers are a top trusted source for 7.9% of North American software buyers (G2).
- Software review sites score 13.4% and peers 13.0%.
- 57% of software buyers expect their organisation to spend more on tech.
- Education creators average USD 307 and business creators USD 295 (Collabstr).
- 56% of target buyers use thought leadership to evaluate vendors (Edelman-LinkedIn).
- Creator discovery is the most outsourced function at 19.44% (IMH).
- Fake or bot followers are 56.5% of reported fraud issues.
- No SaaS-specific creator engagement, cost or ROI benchmark exists.
Where software buyers actually build trust
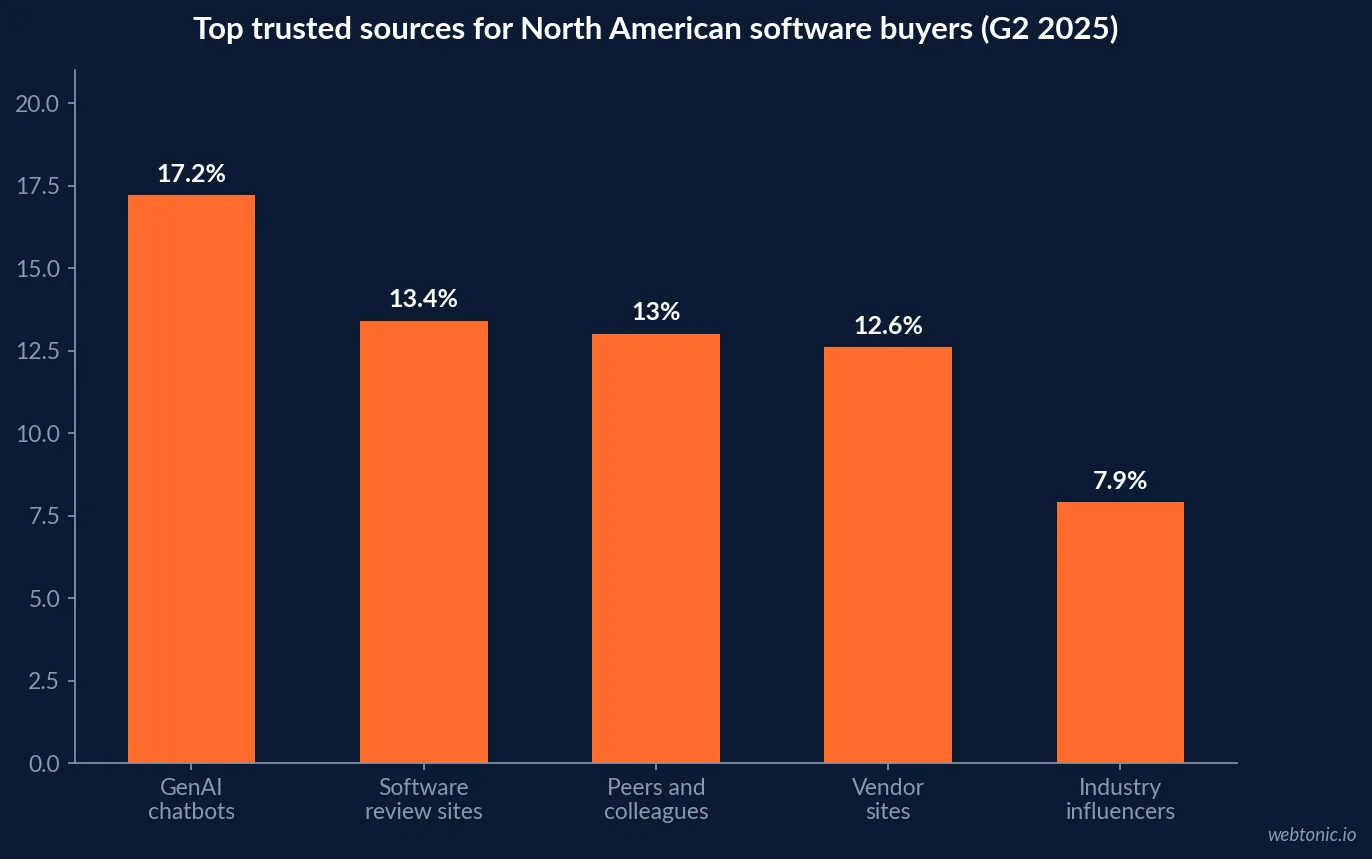
G2's 2025 Buyer Behavior Report surveyed 1,169 B2B decision makers. Asked which sources they trust most at decision time, North American buyers put generative AI chatbots first at 17.2%, followed by software review sites at 13.4%, peers and colleagues at 13.0%, and vendor sites and market research firms at 12.6% each. Industry influencers scored 7.9%.
That is the most useful reality check for a SaaS creator budget. Influencers are a real but secondary trust source; peer and review content - the core of UGC - ranks higher. A budget weighted toward customer voices and practitioner creators reflects the data better than one weighted toward celebrity reach.
| Top trusted source, N. America (G2 2025) | Share of buyers | Creator-content equivalent |
|---|---|---|
| Generative AI chatbots | 17.2% | Content that AI answers can cite |
| Software review sites | 13.4% | Customer reviews and UGC |
| Peers and colleagues | 13.0% | Practitioner creators |
| Vendor sites | 12.6% | Owned case studies |
| Vendor salesperson | 9.3% | Sales-led demos |
| Industry influencers | 7.9% | Paid creator partnerships |
Shortlists are shaped before sales engages
The same G2 dataset shows the sources that influence vendor shortlisting: generative AI chatbots 17.1%, software review sites 15.1%, vendor sites 12.8%, market research firms 10.6% and independent content 9.7%. Vendor salespeople sit at 8.8%. G2 also reports 57% of buyers expect their organisation to spend more on software in the next 12 months, up from 49%.
For tech UGC, that makes independent-looking content - honest walkthroughs, integration demos, comparison videos - more valuable than scripted endorsements. It also makes FTC disclosure non-negotiable, because the value depends on the content being credible.
What tech brands spend on creators
The IAB 2025 Creator Economy Ad Spend and Strategy Report estimates US creator ad spend at USD 37 billion in 2025 and USD 44 billion in 2026. Tech brands account for an estimated USD 1.9 billion, behind retail at USD 12.3 billion, CPG at USD 5.5 billion, financial at USD 2.2 billion and apparel at USD 2.1 billion. The IAB category covers tech and consumer electronics, so B2B software is only a part of it.
The IAB reports that auto, tech and telecom brands name incorporating creator results into marketing mix models as their top challenge - a measurement problem SaaS teams will recognise.
| US creator ad spend by category, 2025 (IAB) | Estimate |
|---|---|
| Retail | USD 12.3 billion |
| CPG | USD 5.5 billion |
| Financial | USD 2.2 billion |
| Apparel | USD 2.1 billion |
| Tech | USD 1.9 billion |
| All categories | USD 37 billion |
Rate cards a SaaS team can budget from
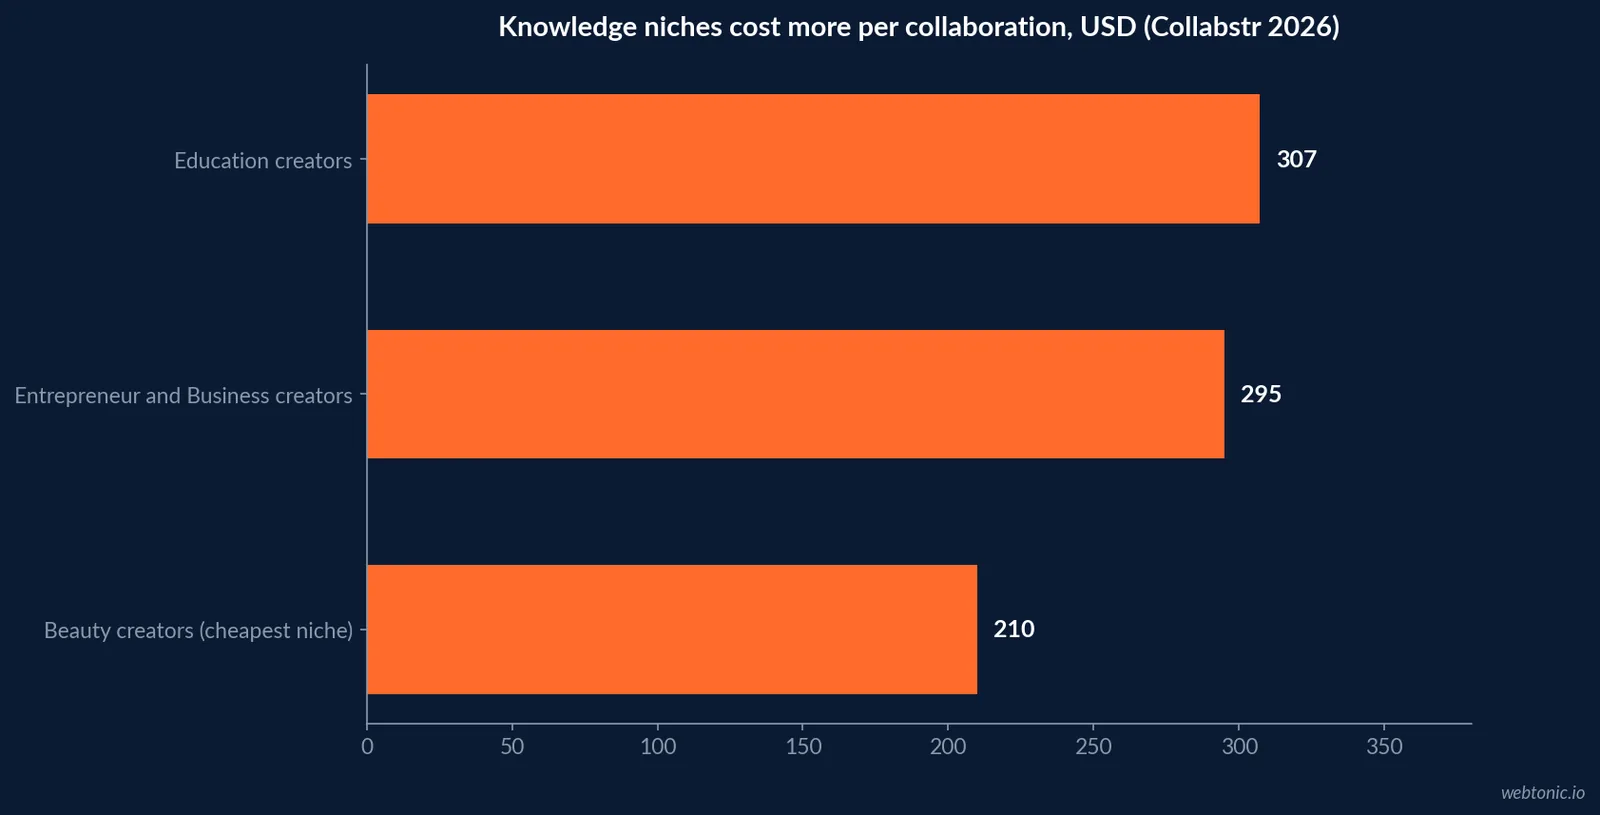
Collabstr's 2026 report, from more than 21,000 collaborations, ranks Education at USD 307 and Entrepreneur and Business at USD 295 among the five most expensive niches; the cheapest, Beauty, averages USD 210. It explains the premium as audiences actively seeking guidance - which is what a software buyer watching a tool tutorial is doing.
The Influencer Marketing Hub 2026 benchmark adds survey cost bands: about 80% of UGC creator answers under USD 500, and mid-tier creators most often at USD 2,000-5,000 or USD 5,000-10,000, about 22.2% each. A quarterly SaaS test with a few practitioner creators and a batch of UGC demos can be costed line by line from these references.
| Budget line | Published reference (2026) | Source |
|---|---|---|
| Education creator | USD 307 average | Collabstr |
| Business creator | USD 295 average | Collabstr |
| UGC demo asset | Mostly under USD 500 | IMH survey |
| Mid-tier creator | USD 2,000-10,000 bands | IMH survey |
| Most collaborations | Under USD 300 (80%) | Collabstr |
Thought leadership reaches the hidden buying group
The 2025 Edelman-LinkedIn B2B Thought Leadership Impact Report finds more than 40% of B2B deals stall on buying-group misalignment. 56% of target buyers and 55% of hidden buyers use thought leadership in vendor evaluation, and 64% and 63% respectively spend more than an hour a week on it.
That is the case for creator and employee content in SaaS: it reaches people who never fill in a demo form. It is survey data on thought leadership broadly, not proof that a paid creator post will move a deal.
The same research reports 41% of target buyers and 35% of hidden buyers say a C-suite executive encouraged them to consider a vendor after engaging with its thought leadership, and hidden buyers value a distinctive format or style more than target buyers do, 60% against 51%. For a creator brief, that argues for a recognisable point of view and format over generic product praise.
LinkedIn Thought Leader Ads mechanics
LinkedIn Thought Leader Ads let a company sponsor public posts from employees, creators and other members after requesting permission; the member's full name must be displayed. Text, single image, video, article and newsletter posts qualify; documents, polls, celebrations, multi-image posts and reposts do not. Posts from 3rd-degree connections can only be found through LinkedIn's Creator Marketplace.
For a SaaS team this is the cheapest way to buy creator distribution in the B2B feed: the asset already exists, and the spend goes into reach.
What to outsource and what to keep
Influencer Marketing Hub's survey of 600+ respondents shows the functions most often handed to agencies: creator discovery and vetting 19.44%, content production 15.28%, and paid amplification and fraud checks 12.5% each. Reporting and analytics is least outsourced at 6.94%, and 66.3% run programmes entirely in-house.
Fraud is the budget leak to watch: fake or bot followers are 56.5% of all reported fraud and quality issues. For B2B, audience quality matters more than size.
| Function (IMH 2026) | Share outsourced |
|---|---|
| Creator discovery and vetting | 19.44% |
| Content production | 15.28% |
| Paid amplification | 12.5% |
| Fraud and authenticity checks | 12.5% |
| Reporting and analytics | 6.94% |
Budget growth and payback expectations
Cross-industry budget intent is strongly expansionary. Influencer Marketing Hub reports 87.49% of respondents expect their influencer budget to increase in 2026 and 5.55% expect a cut, with 72.22% planning rises of 50% or more. 65.9% expect payback within a month, including 48.4% within two weeks. Linqia's enterprise sample is more measured but still positive: 62% are increasing influencer budgets in 2026, 33% plan to spend more than USD 5 million, and 49% now work with specialist influencer agencies.
Those payback expectations come mostly from consumer brands with short purchase cycles. A B2B software deal with a multi-person buying group will not pay back in two weeks, so a SaaS team should set its own horizon - usually one or two sales cycles - before it compares creator spend with other channels.
| Budget signal (2026) | Figure | Source | Sample |
|---|---|---|---|
| Expect influencer budget to rise | 87.49% | Influencer Marketing Hub | 600+ respondents |
| Expect a rise of 50% or more | 72.22% | Influencer Marketing Hub | 600+ respondents |
| Expect payback within a month | 65.9% | Influencer Marketing Hub | 600+ respondents |
| Increasing budgets in 2026 | 62% | Linqia | 200+ enterprise marketers |
| Struggle to measure ROI | 79% | Linqia | 200+ enterprise marketers |
| Use AI in creator workflows | 74% | Linqia | 200+ enterprise marketers |
What the data cannot tell a SaaS team
No dataset on this page reports a cost per demo, cost per trial or pipeline return for B2B software creator programmes. G2 measures trust, the IAB measures spend, Collabstr measures marketplace prices and the surveys measure intent. Vendors that quote a SaaS-specific influencer ROI without naming a sample should be treated with caution.
The workable approach is to run a bounded test - a small number of practitioner creators, a batch of customer UGC, and Thought Leader Ads distribution - with one tracked landing page or code per creator. After one or two sales cycles you will hold the only SaaS benchmark that matters: your own cost per influenced opportunity.
Disclosure in B2B creator deals
The FTC Endorsement Guides apply to B2B endorsements too: section 255.5 requires any material connection - payment, free licences, early access - to be disclosed clearly and conspicuously. Free seats given to a creator for a review count. The FTC Disclosures 101 guide asks for the disclosure in the post itself. Linqia reports 100% of enterprise marketers repurpose creator content, so disclosure has to travel with the asset into ads and landing pages.
Goldman Sachs Research estimated in 2023 that the creator economy could reach USD 480 billion by 2027, from about USD 250 billion - more creators, and more scrutiny of how they are paid.
Budgeting steps for a SaaS creator test
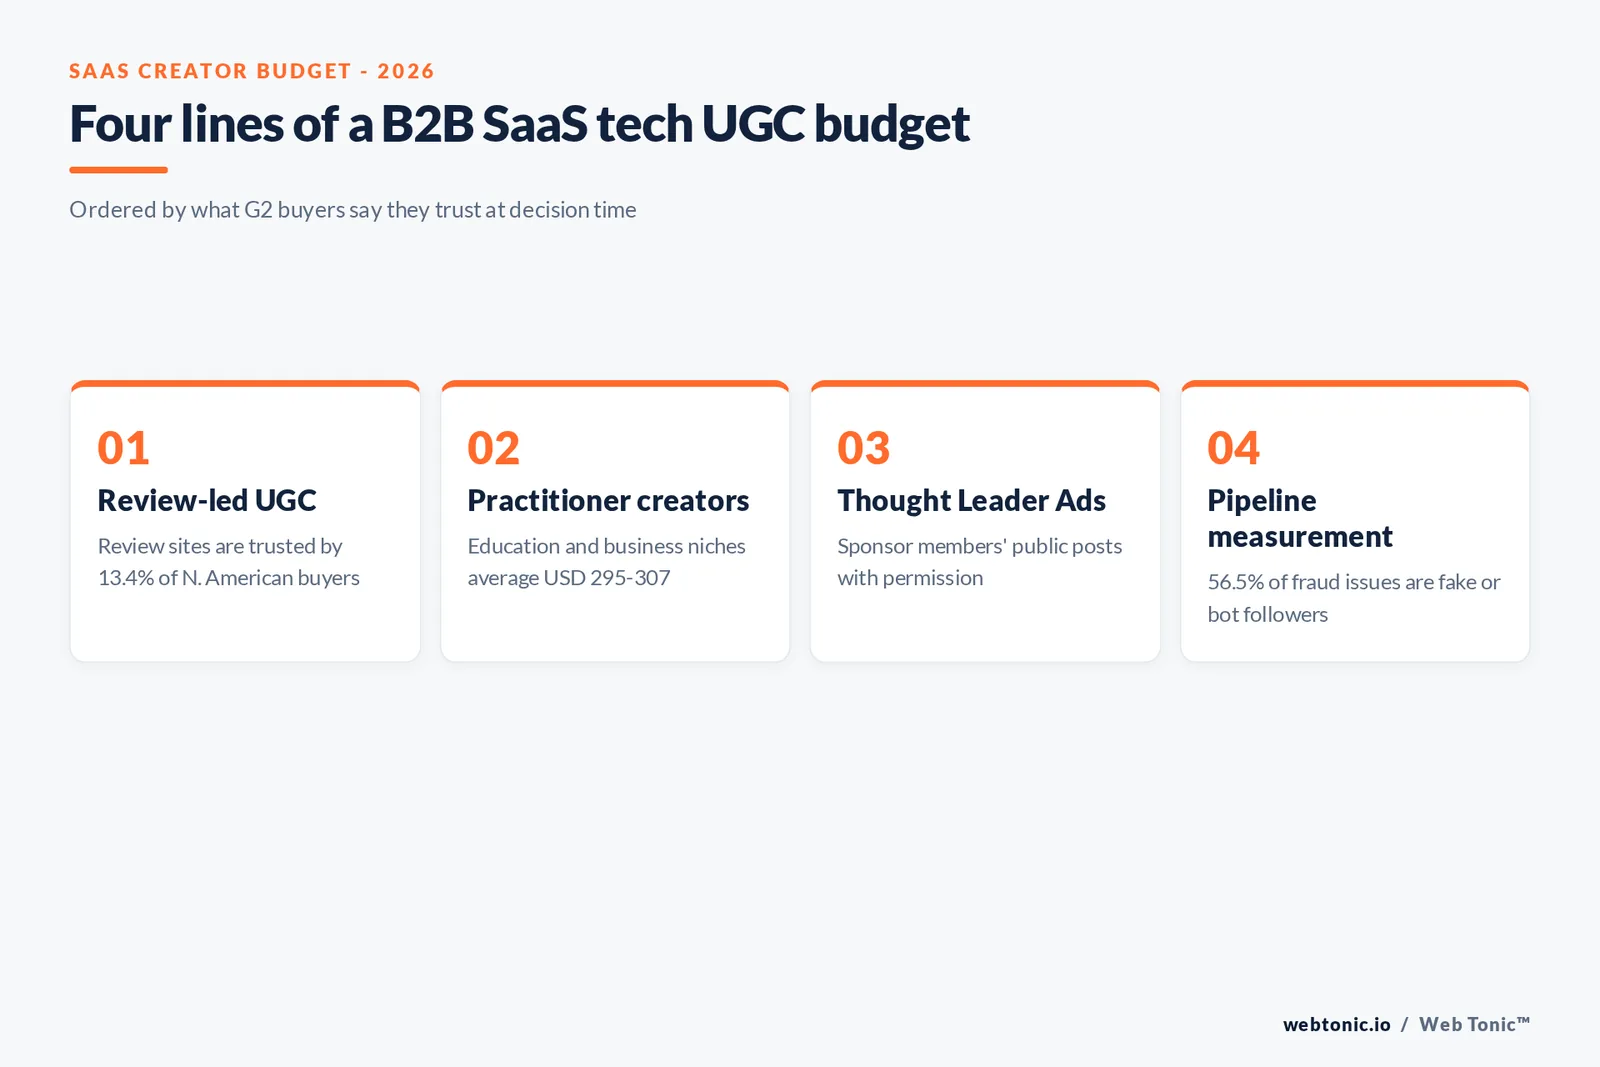
- Weight spend toward reviews and practitioner voices, which buyers trust more.
- Price each line from the published USD 295-307 knowledge-niche references.
- Distribute through Thought Leader Ads rather than new production.
- Vet audiences for bot followers before signing.
- Track influenced pipeline, not views.
See our influencer marketing statistics, the influencer and UGC hub and our B2B SaaS SMS marketing data. Our growth marketing and performance creative teams can help, or contact us.
Frequently Asked Questions
How much should a B2B SaaS company budget for tech UGC?
Start from published rate cards, not a percentage rule. Collabstr's 2026 report puts Education creators at USD 307 and Entrepreneur and Business creators at USD 295 per collaboration, both among its most expensive niches, and 80% of all collaborations under USD 300. Influencer Marketing Hub's survey places most UGC creator costs under USD 500 and mid-tier creators in USD 2,000 to 10,000 bands. None of these figures is SaaS-specific.
Do software buyers trust industry influencers?
Somewhat, but less than other sources. In G2's 2025 Buyer Behavior Report (1,169 B2B decision makers), North American buyers ranked industry influencers at 7.9% as a top trusted source at decision time, against 17.2% for generative AI chatbots, 13.4% for software review sites and 13.0% for peers and colleagues.
What are LinkedIn Thought Leader Ads?
A LinkedIn format that lets a company sponsor a public post from an employee, creator or other member after requesting their permission. The member must display their full name, and polls, documents, celebrations, multi-image posts and reposts are not eligible.
How much do tech brands spend on creators?
The IAB estimates US tech brands spent USD 1.9 billion on creator advertising in 2025, out of USD 37 billion across all categories, and projects total US creator ad spend of USD 44 billion in 2026.
Is there a SaaS benchmark for influencer ROI?
No public dataset reports influencer or UGC ROI for B2B software specifically. Linqia's 2026 survey found 79% of enterprise marketers struggle to measure influencer ROI at all, and the IAB reports tech brands name incorporating creator results into marketing mix models as their top challenge.
Sources
G2 - 2025 Buyer Behavior Report
IAB - Creator Economy Ad Spend and Strategy Report 2025
Collabstr - 2026 Influencer Marketing Report
Influencer Marketing Hub - Influencer Marketing Benchmark Report 2026
LinkedIn - Edelman-LinkedIn 2025 B2B Thought Leadership Impact Report, hidden buyers
LinkedIn - Thought Leader Ads
Linqia - 2026 State of Influencer Marketing
eCFR - 16 CFR Part 255, FTC Endorsement Guides
FTC - Disclosures 101 for Social Media Influencers
Goldman Sachs - The creator economy could approach half a trillion dollars by 2027


