Table of contents
The median GA4 bounce rate across 15 industries was 44.04% as of September 2024 benchmark data, but that number only means something once you know what GA4 actually counts as a "bounce." The metric was redefined when Google Analytics 4 replaced Universal Analytics — it is no longer single-page-session rate, it is the inverse of an engaged-session rate — and industries that read as high-bounce under the old definition can look completely different under the new one.
Key Takeaways
- The median GA4 bounce rate across 15 industries was 44.04% in Databox's September 2024 benchmark-group data.
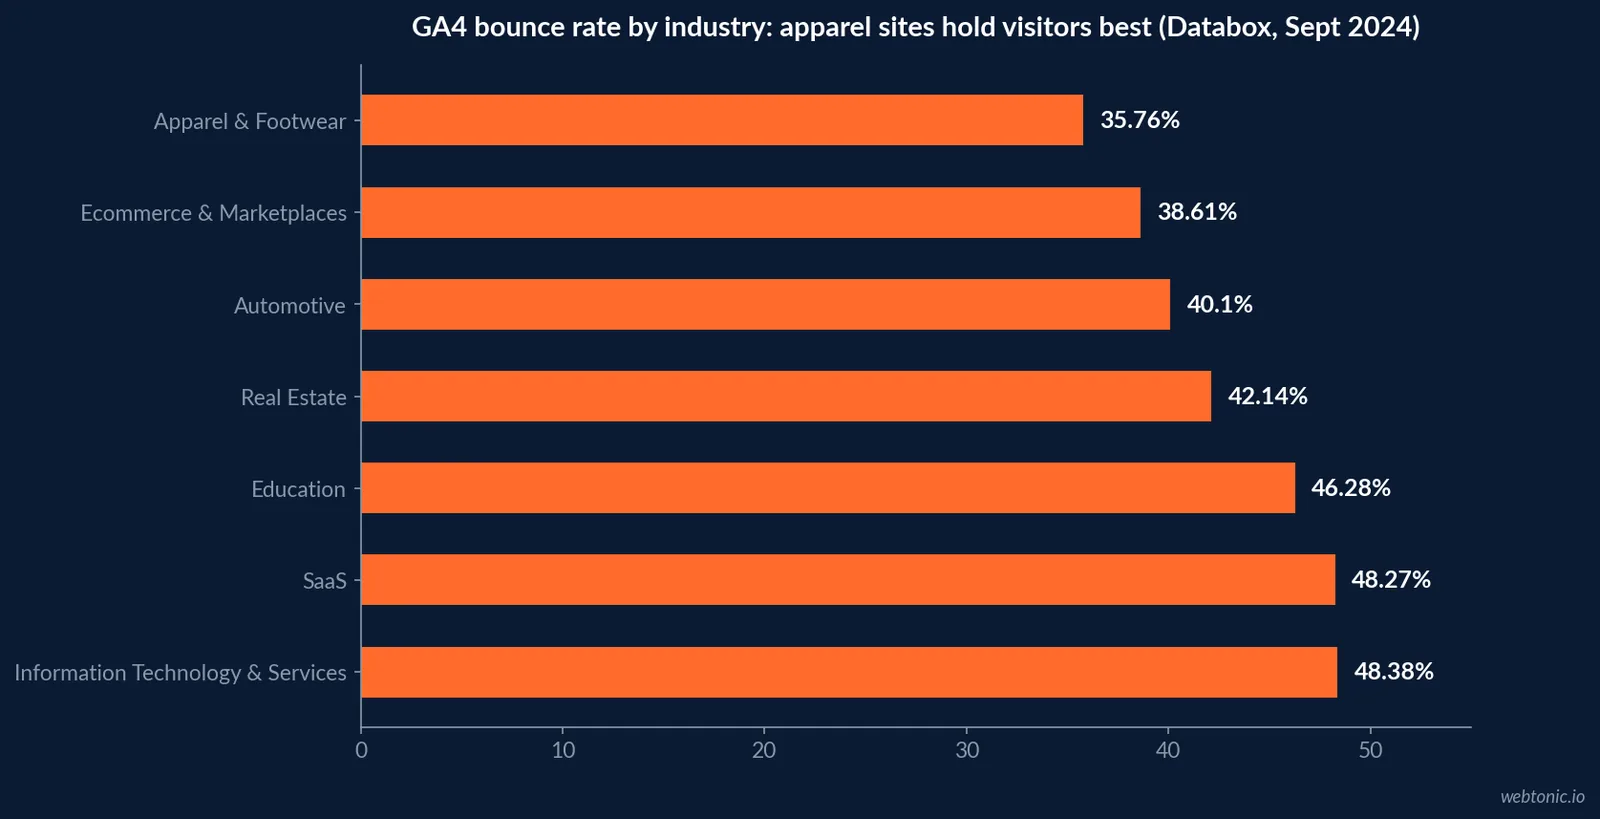
- Apparel & Footwear held the lowest bounce rate at 35.76% — the most engaged sessions in the set.
- Information Technology & Services posted the highest bounce rate at 48.38%, with SaaS close behind at 48.27%.
- GA4 bounce rate is defined as the inverse of engagement rate — a session is "engaged" if it lasts 10+ seconds, includes a conversion event, or has 2+ page/screen views (Google Analytics Help).
- Ecommerce & Marketplaces bounced at 38.61%, notably lower than most B2B and services categories.
- Real Estate sat at 42.14% bounce rate, roughly mid-pack across the dataset.
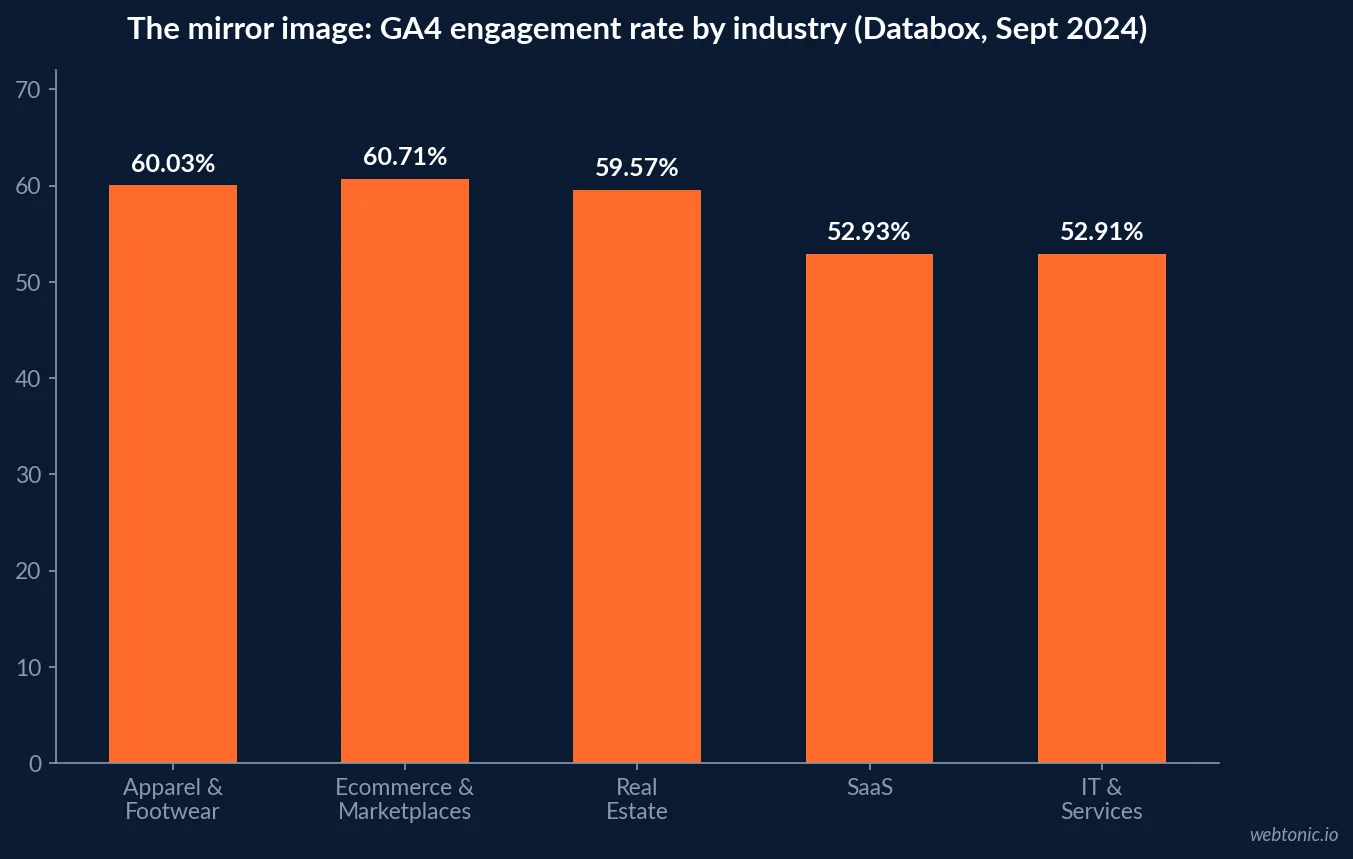
- Bounce rate and engagement rate are mathematically complementary: Apparel & Footwear's 60.03% engagement rate pairs with its 35.76% bounce rate to sum near 100%.
- Legacy Universal Analytics bounce rate and current GA4 bounce rate are not directly comparable numbers, per Google's own migration documentation.
Why the GA4 definition changes everything about this metric
Before comparing any bounce rate figure to an industry benchmark, it matters which Analytics version produced it. Under Universal Analytics, bounce rate was single-page sessions divided by all sessions — a visitor who read one page and left counted as a bounce no matter how long they stayed. Under GA4, Google's own documentation states plainly: "The bounce rate is the opposite of the engagement rate," and an engaged session requires 10+ seconds on site, a conversion event, or 2+ page or screen views.
The practical effect: a visitor who reads one article for 45 seconds now counts as engaged (not bounced) in GA4, even though the same behavior would have counted as a bounce under Universal Analytics. Any historical bounce-rate trend that spans the 2023 GA4 migration should be read as two different metrics stitched together, not one continuous line.
| Industry | GA4 bounce rate (Sept 2024) | GA4 engagement rate (Sept 2024) | Sum (should approach 100%) |
|---|---|---|---|
| Apparel & Footwear | 35.76% | 60.03% | 95.79% |
| Ecommerce & Marketplaces | 38.61% | 60.71% | 99.32% |
| Travel & Leisure | 38.84% | 60.71% | 99.55% |
| Automotive | 40.1% | 61.48% | 101.58% |
| Health & Wellness | 39.41% | 61.74% | 101.15% |
| Real Estate | 42.14% | 59.57% | 101.71% |
| Food | 38.93% | 55.53% | 94.46% |
| Health Care | 40.94% | 59.1% | 100.04% |
| Industrials & Manufacturing | 41.78% | 57.85% | 99.63% |
| Construction | 45.28% | 55.06% | 100.34% |
| Education | 46.28% | 53.82% | 100.1% |
| Technology | 48.28% | 53.34% | 101.62% |
| SaaS | 48.27% | 52.93% | 101.2% |
| Consulting & Professional Services | 47.84% | 52.97% | 100.81% |
| Information Technology & Services | 48.38% | 52.91% | 101.29% |
Why apparel and ecommerce sites bounce less
Sites built around browsing — apparel, footwear, general ecommerce and marketplaces — naturally produce the multi-page-view behavior GA4 rewards with an "engaged" label. A shopper comparing three product pages before adding one to cart racks up 2+ page views inside a single session, satisfying the engagement bar regardless of whether they buy. That structural advantage shows up clearly in the data: Apparel & Footwear (35.76%) and Ecommerce & Marketplaces (38.61%) post the two lowest bounce rates in the entire 15-industry set.
Travel & Leisure follows closely at 38.84%, likely for a similar reason — comparing flights, hotels or itineraries typically means several page views before a decision. These categories are not necessarily doing anything different in terms of content quality; the browsing-heavy nature of the purchase journey does the work.
Why SaaS and IT services sit at the high end
Information Technology & Services (48.38%) and SaaS (48.27%) post the two highest bounce rates in Databox's dataset, with Technology (48.28%) essentially tied. A likely driver: B2B software research visits are frequently single-purpose — a prospect reads one comparison article, one pricing page, or one piece of documentation, and leaves without a second pageview inside that session, even when they found exactly what they needed and later convert on a different visit or channel entirely.
This is why bounce rate alone should never be read as a content-quality verdict for B2B and technical categories. A high bounce rate paired with a healthy conversion rate on the same page can simply mean the page did its job in one view — closer to a call-to-action click-through than to visitor abandonment.
| Industry | GA4 bounce rate | Likely structural driver | What to check before acting on it |
|---|---|---|---|
| Information Technology & Services | 48.38% | Single-purpose research visits | Check conversion rate and scroll depth on the same pages |
| SaaS | 48.27% | Documentation and pricing pages read in isolation | Segment marketing site vs. logged-in app bounce separately |
| Technology | 48.28% | Comparison-shopping visits ending after one page | Look at session source — organic research traffic bounces differently than paid |
| Consulting & Professional Services | 47.84% | Single-page credibility checks | Confirm the page includes a clear next step (contact, booking); see our conversion rate statistics roundup for the matching benchmark |
| Education | 46.28% | Course-specific landing pages | Compare bounce rate against enrollment starts, not pageviews alone |
| Construction | 45.28% | Local search visits for a single service | Check whether phone clicks are tagged as GA4 conversion events |
Using the median as a sanity check, not a scoreboard
Databox's Content Marketing Benchmarks by Industry report pulls its GA4 figures from its own network of connected accounts grouped by industry, giving a real-world median rather than a single company's case study. The 44.04% all-industry median sits almost exactly between the lowest (35.76%, Apparel & Footwear) and highest (48.38%, IT & Services) categories in the set — a useful midpoint, but one that describes no specific business.
A site owner whose bounce rate sits within a few points of their closest matching industry line is very likely in a normal range; the benchmark becomes actionable only when the gap is large and sustained across multiple weeks, ruling out normal seasonal or traffic-mix noise.
| Bounce rate reading | vs. 44.04% median | Reasonable next step |
|---|---|---|
| Within ±3 points of your industry's line | Normal | No action needed from bounce rate alone |
| 5+ points above your industry's line, page-load slow | Elevated, likely technical | Check Core Web Vitals and mobile load time first |
| 5+ points above your industry's line, load time normal | Elevated, likely content/intent mismatch | Check search query-to-page match and above-the-fold clarity |
| 5+ points below your industry's line, conversion rate flat | Deceptively low | Verify the engagement definition — a 10-second dwell may not mean success |
| 5+ points below your industry's line, conversion rate up | Genuinely engaged | Treat as a positive signal, keep watching trend, not one snapshot |
What device and page type do to the number
Bounce rate also shifts with device mix and page type in ways an industry-level average cannot show. Mobile sessions typically carry a higher bounce rate than desktop sessions on the same site, since shorter mobile attention spans and interruption-prone browsing make the 10-second/2-page engagement bar harder to clear. Single-purpose pages — a phone-number click-to-call page, a single-offer landing page — will also structurally bounce higher than a multi-page blog or resource hub, independent of how well either is performing its actual job.
Before comparing your site's blended bounce rate to an industry median, check whether your traffic mix (mobile share, page-type mix) resembles the businesses that made up that benchmark sample, or the comparison will systematically mislead in one direction. Web Tonic's growth marketing team typically segments a client's bounce rate by device and landing page type before comparing it to any published median — see our related landing page statistics roundup for the conversion side of the same pages.
Older, self-reported figures still float around — know which one you're reading
Not every "average bounce rate" quote in circulation uses GA4's engaged-session math. HubSpot's own 2025 web trends survey reports a self-reported average bounce rate between 35% and 60% across respondent sites — a wider and rougher range than Databox's measured 35.76%–48.38% GA4 spread, because it blends self-reported estimates across analytics tools and site types rather than a single consistent GA4 pull.
Plausible Analytics' own compiled ranges go further and split by page type rather than industry: content websites typically run 65%–90%, landing pages 60%–90%, service-industry sites (legal, automotive) 50%–70%, and B2B sites a much wider 25%–65%. These ranges use an older, stricter single-page-session style definition closer to legacy Universal Analytics than to GA4's engaged-session standard, which is exactly why they read so much higher than the Databox GA4 figures in this article. When a "bounce rate" number looks unusually high or low against everything else here, checking which definition produced it is often the fastest explanation.
Benchmark summary: read bounce rate as a diagnostic input, not a grade
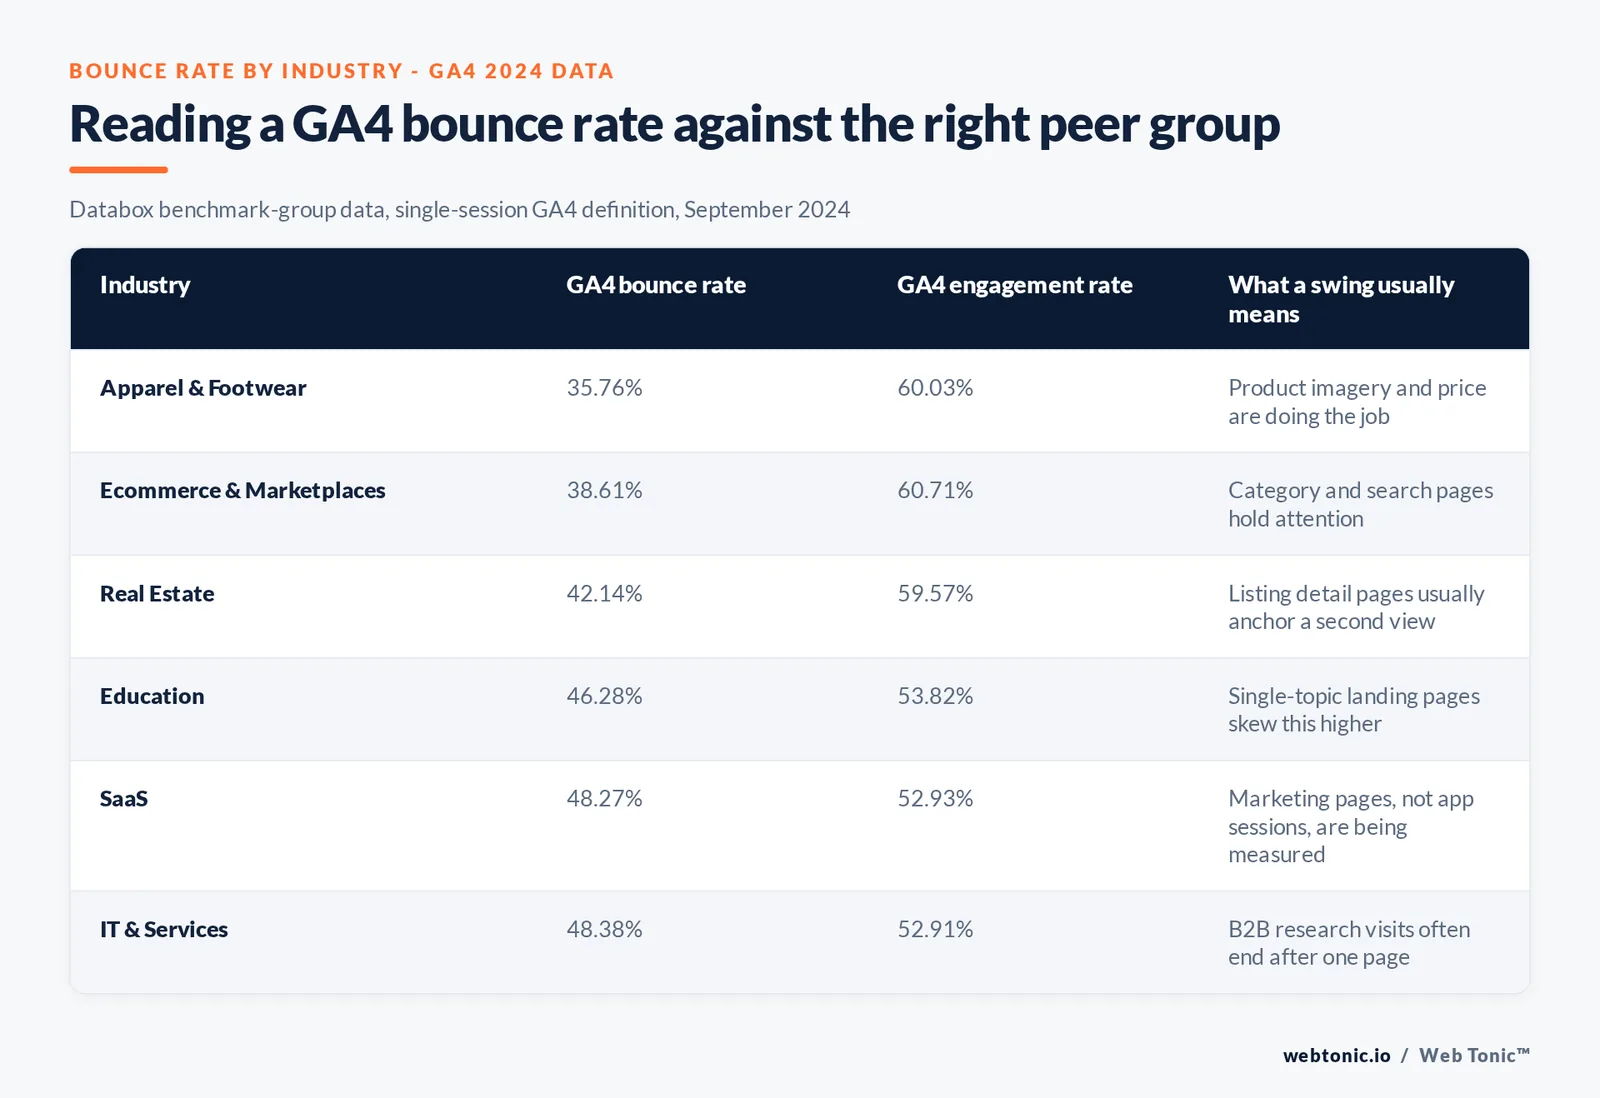
The 44.04% median and the 35.76%–48.38% industry range are useful boundaries for a first-pass health check, but GA4's engaged-session definition means the number reflects session behavior, not visitor satisfaction directly. Pair any bounce-rate benchmark comparison with the same industry's engagement rate and, where available, conversion data on the same pages, before deciding whether a gap from the median actually needs fixing.
Frequently Asked Questions
What counts as a 'bounce' in Google Analytics 4?
GA4 defines bounce rate as the inverse of engagement rate, not the old single-page-session definition from Universal Analytics. Per Google's own documentation, an engaged session is one that lasts 10 seconds or longer, includes a conversion event, or includes 2 or more page or screen views. A session that meets none of those three conditions counts as a bounce. That is a materially different — usually lower — number than the legacy single-pageview bounce rate many marketers still expect.
What is the average bounce rate by industry in GA4?
Across the 15 industries in Databox's benchmark-group dataset (September 2024 GA4 sessions), the median bounce rate was 44.04%. Individual industries ranged from 35.76% for Apparel & Footwear — the lowest, meaning the most engaged sessions — up to 48.38% for Information Technology & Services, the highest in the set. SaaS sat close behind IT at 48.27%.
Why do IT and SaaS sites show higher bounce rates than apparel and ecommerce sites?
The GA4 engaged-session definition rewards multi-page browsing or dwell time past 10 seconds. Apparel and ecommerce sessions often naturally include multiple product-page views in a single visit, which satisfies the engagement bar quickly. B2B software and IT services sites frequently see single-page research visits — someone reads one comparison page or documentation article and leaves — which can trip the bounce definition even when the visitor found exactly what they needed.
Is a lower bounce rate always better?
Not automatically. Because GA4 counts any session with a conversion event as engaged regardless of page count, a landing page that captures a lead or a purchase in a single view can show as engaged even without a second pageview. Conversely, a high bounce rate on a well-optimized single-purpose page — a phone-number click-to-call page, for instance — may simply mean visitors got what they needed fast. Read bounce rate alongside conversion data, not on its own.
How should a site owner compare their bounce rate to an industry benchmark?
Match to the closest available industry category in the dataset — Databox's set covers Apparel & Footwear, Automotive, Construction, Consulting & Professional Services, Ecommerce & Marketplaces, Education, Food, Health Care, Health & Wellness, Information Technology & Services, Industrials & Manufacturing, Real Estate, SaaS, Technology, and Travel & Leisure — then check the same period's engagement rate as a cross-check, since GA4 bounce rate and engagement rate are mathematically complementary and should sum to roughly 100%.
Sources
Databox — Content Marketing Benchmarks by Industry
Google Analytics Help — [GA4] Engagement rate and bounce rate
Google Analytics Help — [UA] Bounce rate (legacy definition)
Google Analytics Help — Comparing metrics: GA4 vs. Universal Analytics
Semrush — What Is Bounce Rate? And How to Reduce It
HubSpot — 2025 Web Trends Report & Website Traffic by Industry
Plausible Analytics — What Is a Good Bounce Rate?