



Table of contents
The median landing page converts at 6.6% across all industries, based on Unbounce's analysis of 464 million pageviews across 41,000 pages - but a "good" rate depends entirely on which industry you're in. This page compares that all-industry baseline against WordStream's per-industry conversion data to give a number you can actually benchmark against.
Key Takeaways
- The median landing page conversion rate is 6.6% across all industries.
- That figure comes from 464 million pageviews across 41,000 pages.
- The dataset covers 57 million recorded conversions.
- A good ecommerce conversion rate starts at 11.4%, the top 25% of the category.
- Top-decile pages convert 2 to 4 times the median for their category.
- Automotive Repair, Service & Parts converts at 14.67% on search ads.
- Animals & Pets converts at 13.07%, among the highest tracked.
- Finance & Insurance converts at just 2.55%, among the lowest.
- Furniture converts at 2.73%, also near the bottom of the range.
- The average cost per lead across Google Ads is USD 70.11.
- Attorneys & Legal Services pay up to USD 131.63 per lead.
- Real Estate converts at 3.28% on search ads, below the all-industry median.
- Restaurants & Food and Animals & Pets carry the lowest CPLs, near USD 30.
The baseline: what "median" actually means here
Unbounce's Conversion Benchmark Report, drawn from 464 million pageviews across 41,000 unique landing pages and 57 million recorded conversions, puts the median landing page conversion rate at 6.6% across all industries. Unbounce is explicit that this is a reference point, not a goal: half of the pages in the dataset convert above it, half below, and neither half is automatically doing something wrong.
Where the number becomes useful is as a first filter. A page converting well under 6.6% with no industry-specific reason to expect lower has a diagnosable problem; a page already above 6.6% needs an industry-specific benchmark, not the all-industry median, to know if it has more room to grow.
| Benchmark (Unbounce Conversion Benchmark Report) | Figure | What it measures |
|---|---|---|
| Median conversion rate, all industries | 6.6% | Middle of the dataset |
| Pageviews analyzed | 464 million | Sample size |
| Landing pages analyzed | 41,000 | Sample size |
| Conversions recorded | 57 million | Sample size |
| Good ecommerce conversion rate | 11.4%+ | Top 25% of ecommerce pages |
Why industry changes the number so much
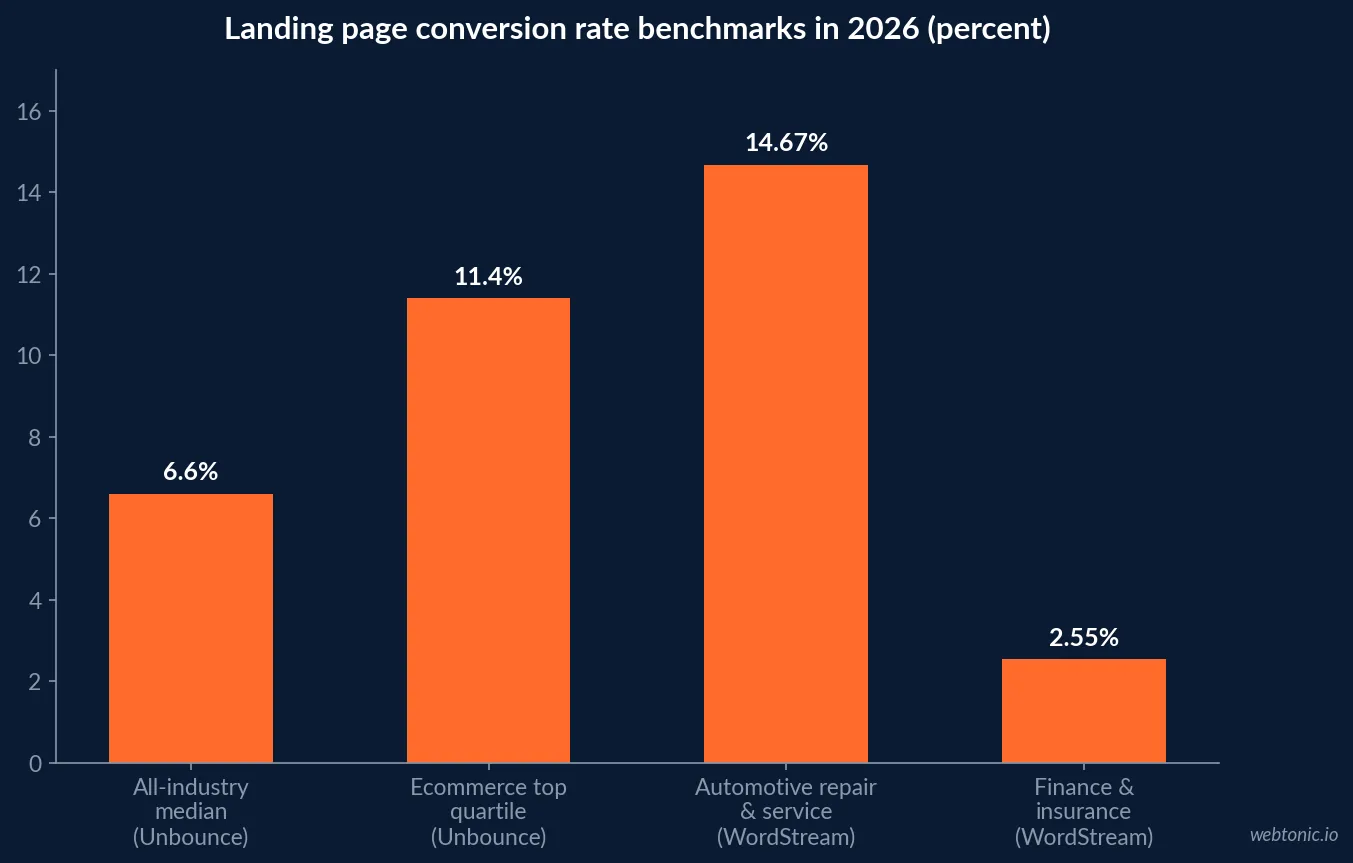
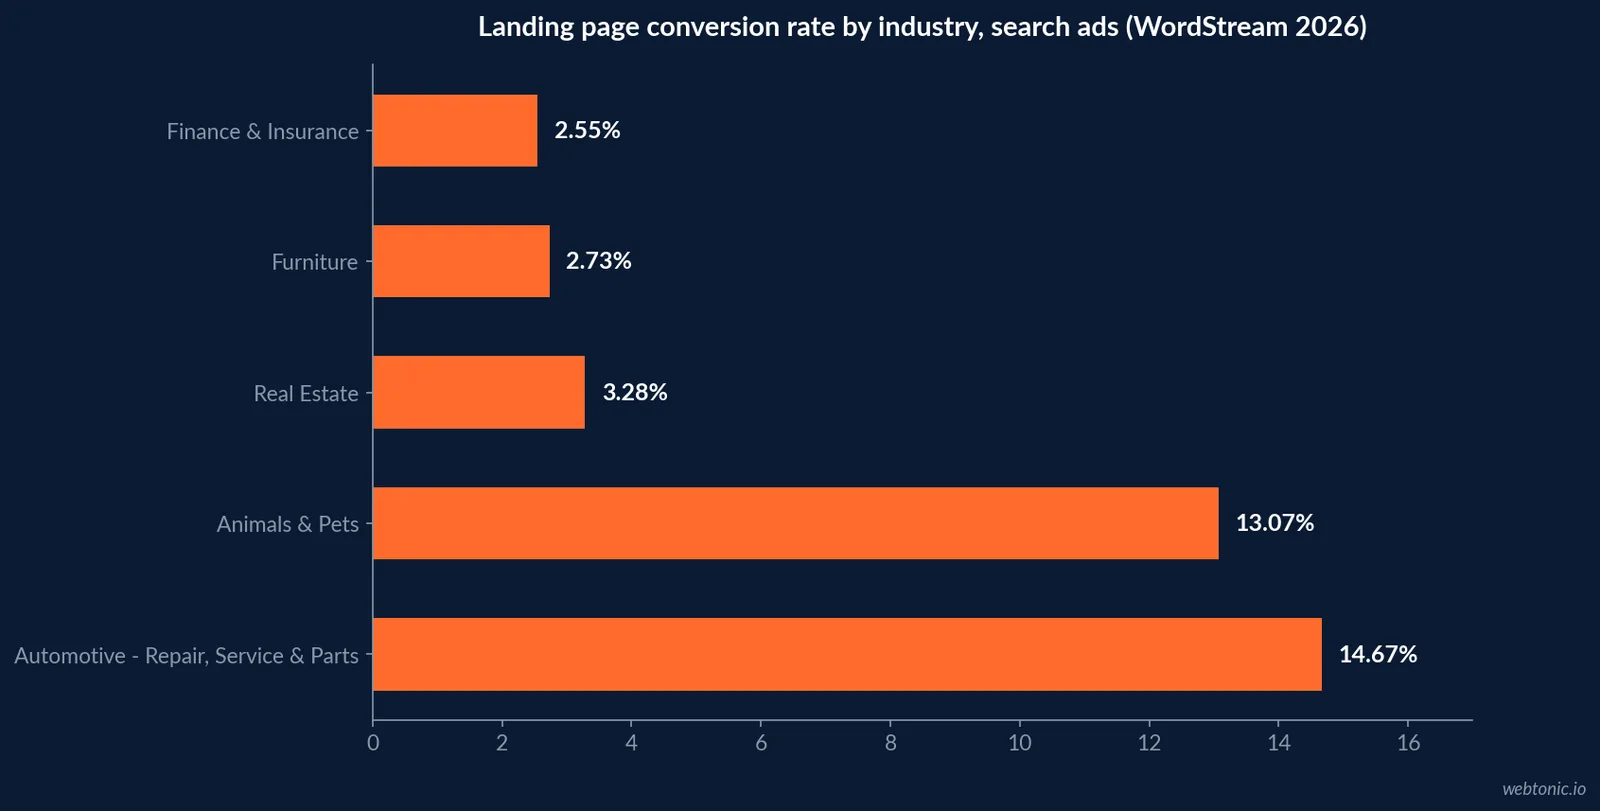
WordStream's search-ad conversion data, covering roughly 20 business categories, shows a spread that swamps the all-industry median in either direction. Automotive Repair, Service & Parts converts at 14.67% and Animals & Pets at 13.07%, both more than double the 6.6% baseline. Finance & Insurance sits at just 2.55% and Furniture at 2.73%, both under half the baseline.
That is more than a five-times gap between the highest- and lowest-converting categories on the same channel type. Benchmarking a landing page against the wrong industry number is the single most common way a genuinely healthy page gets mislabeled as underperforming.
| Industry | Average conversion rate (search ads) | vs 6.6% median | Source |
|---|---|---|---|
| Automotive - Repair, Service & Parts | 14.67% | +8.07 pts | WordStream |
| Animals & Pets | 13.07% | +6.47 pts | WordStream |
| Education & Instruction | 11.38% | +4.78 pts | WordStream |
| Physicians & Surgeons | 11.62% | +5.02 pts | WordStream |
| Personal Services | 9.74% | +3.14 pts | WordStream |
| Real Estate | 3.28% | -3.32 pts | WordStream |
| Furniture | 2.73% | -3.87 pts | WordStream |
| Finance & Insurance | 2.55% | -4.05 pts | WordStream |
What sets the top-tier pages apart
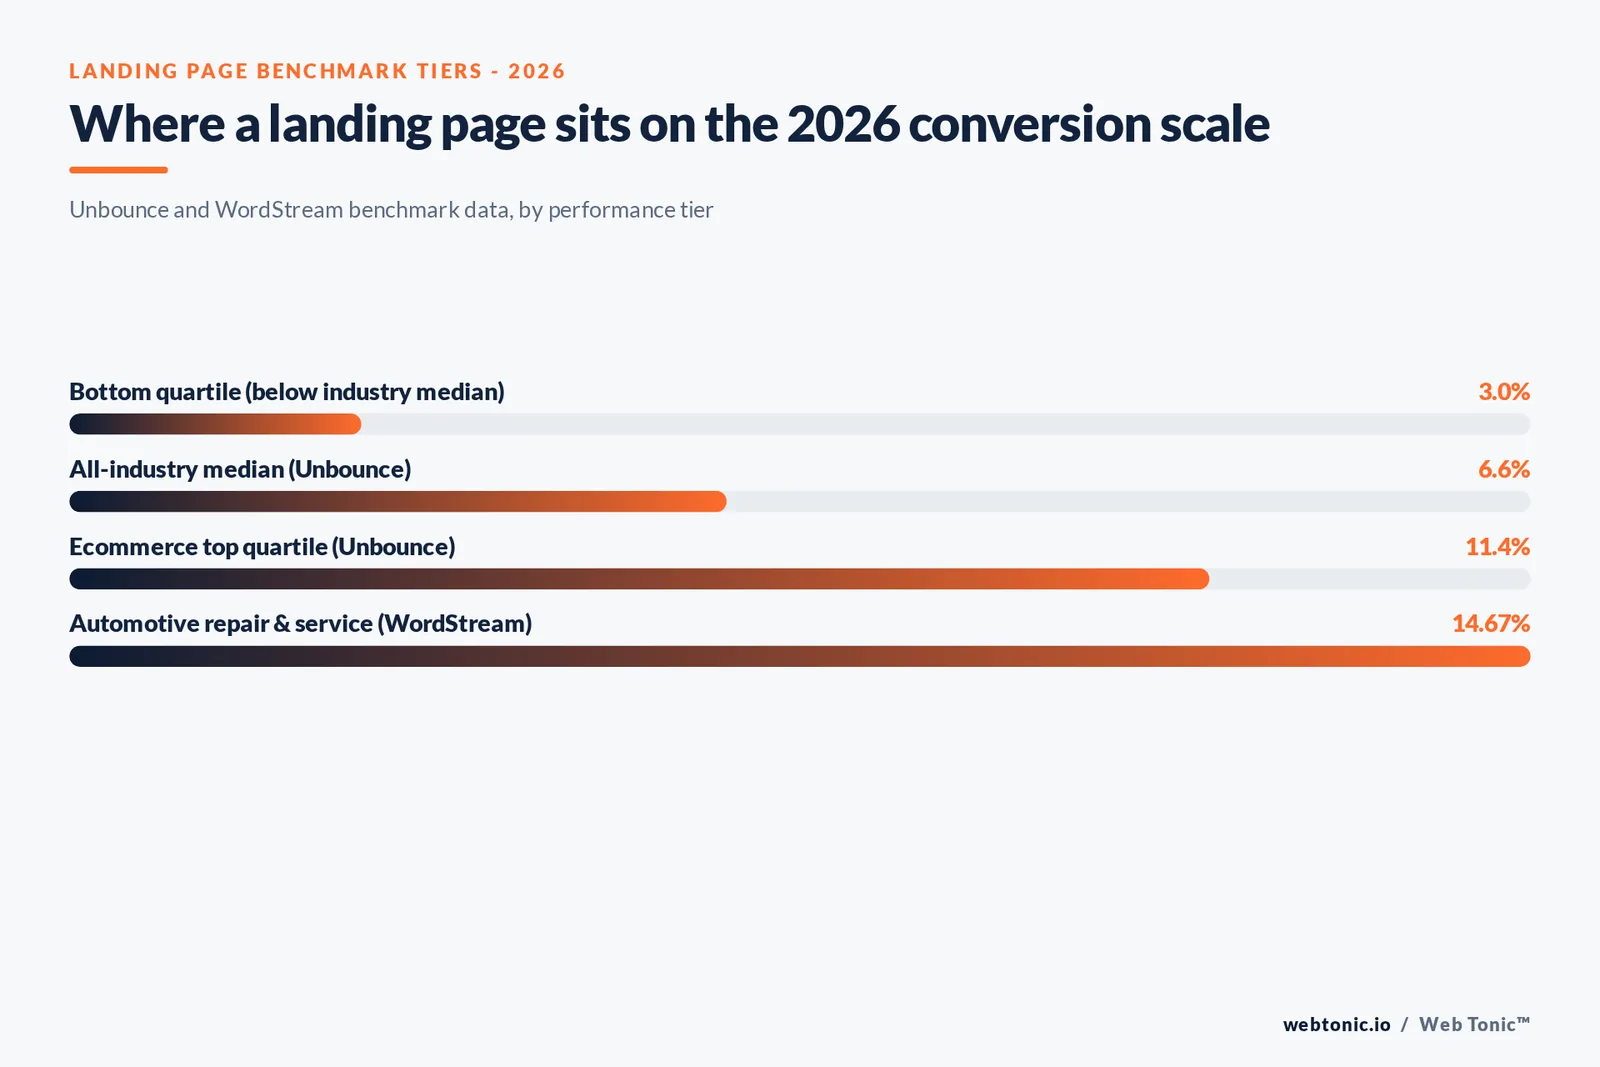
Unbounce's data shows a good ecommerce conversion rate starts at 11.4% or higher, the top 25% of ecommerce pages in its dataset - nearly triple the all-industry median. Across the broader benchmarking literature, top-decile pages in a given category typically convert 2 to 4 times the category median, which is the gap worth closing once a page is already performing at or above its industry's middle.
Getting from the median to that top tier is rarely one fix. It is usually the compounding effect of message match, page load speed, form length and offer clarity working together, not any single lever pulled in isolation.
| Performance tier | Typical conversion range | What separates it | Basis |
|---|---|---|---|
| Bottom quartile | Well under industry median | Message mismatch, slow load, long forms | Cross-study pattern |
| Median | 6.6% all-industry (Unbounce) | Functional page, average execution | Unbounce |
| Top quartile (ecommerce) | 11.4%+ | Clear offer, fast load, tight message match | Unbounce |
| Top decile (general) | 2-4x category median | Compounding small optimizations | Cross-study pattern |
Why cost per lead tells the rest of the story
WordStream's data also tracks cost per lead alongside conversion rate, and the pattern explains why low conversion rates in some categories are not a red flag. The average cost per lead across Google Ads is USD 70.11, but Attorneys & Legal Services pays up to USD 131.63, Furniture pays USD 121.51, and Business Services pays USD 103.54 - all categories with longer sales cycles and, correspondingly, lower conversion rates. Restaurants & Food and Animals & Pets sit at the cheap end, near USD 30 per lead, matching their higher conversion rates.
Conversion rate and cost per lead move together for a reason: a shorter, lower-consideration purchase converts more visitors and costs less per lead, while a longer, higher-stakes purchase converts fewer visitors but each one is worth defending with a bigger acquisition budget.
| Industry | Avg. cost per lead | Conversion rate | Sales-cycle read |
|---|---|---|---|
| Attorneys & Legal Services | USD 131.63 | 5.09% | Long consideration |
| Furniture | USD 121.51 | 2.73% | Long consideration |
| Business Services | USD 103.54 | 5.14% | Long consideration |
| Restaurants & Food | USD 30.27 | 7.09% | Low consideration |
| Animals & Pets | ~USD 31 | 13.07% | Low consideration |
What page speed does to that conversion number
Before optimizing the page's copy or offer, the load time behind it is worth checking first. Google's "Milliseconds Make Millions" study, analyzing mobile site data from 37 retail, travel, luxury and lead generation brands, found that a 0.1-second improvement in mobile load time increased conversions by 8% for retail sites and 10.1% for travel sites, with retail consumers also spending almost 10% more per session.
That is a tenth of a second, not a full redesign. A landing page already matched to the right industry benchmark from the table above can still be leaving conversions on the table purely on load time, before any message or layout change is tested.
| Google mobile speed study (37 brands, EU + US) | Metric improved | Change from 0.1s faster load |
|---|---|---|
| Retail | Conversion rate | +8% |
| Travel | Conversion rate | +10.1% |
| Retail | Average spend per session | +~10% |
| Lead generation | Informational page bounce rate | -8.3% |
| Luxury | Page views per session | +8% |
What the form itself does to that number
Once speed is handled, the form is the next lever with published evidence behind it. HubSpot's analysis of over 40,000 landing pages found that conversion rates decrease as field count rises, but less steeply than expected for simple single-line text fields; the real damage comes from multi-line text areas and dropdown select boxes, both of which the study found have a powerful depressing effect on conversion rate on their own.
The practical read: cutting a form from six fields to three helps, but swapping one open-ended text area for a single-line field or a button choice can move the number more than removing a field entirely.
Why the top of the page still decides most of the outcome
Nielsen Norman Group's eye-tracking research offers a reason the offer and headline above the fold matter more than anything further down: users spend about 57% of their page-viewing time above the fold, and 74% of viewing time happens within the first two screenfuls. A conversion-rate problem is very often a first-screen problem - the message, the form's visibility and the primary call to action - before it is a below-the-fold content problem.
How to set a target for your own page
Start with the industry number closest to your category from the table above, not the 6.6% all-industry median. If your category is not covered directly, treat 6.6% as the floor to clear and 11.4% as the ecommerce top-quartile reference point for what "excellent" looks like once the floor is comfortably cleared.
Our performance creative team builds landing pages against the industry benchmark that actually applies, then tests message match and form length against it rather than an all-industry average that may not describe the buying decision at all.
Where landing page conversion connects to paid traffic cost
A landing page's conversion rate and the paid channel feeding it are the same economic problem viewed from two sides - a stronger page lowers the effective cost per lead on the same ad spend. See our guides on what Google Ads costs and building a Google Ads strategy for how the two numbers move together once a campaign is live.
Getting a second opinion on a page's numbers
If a landing page is underperforming its industry benchmark and the cause is not obvious from the numbers above, talk to us about a page-level review from our performance creative practice before assuming the traffic, not the page, is the problem.
Frequently Asked Questions
What is a good landing page conversion rate?
Unbounce's Conversion Benchmark Report, built from **464 million pageviews across 41,000 landing pages and 57 million conversions**, puts the **median conversion rate at 6.6% across all industries**. That is a baseline, not a target - Unbounce itself calls it the number most pages sit around, not the number a page should aim for. A page converting near or above 6.6% is performing at the market's middle; a page well under that number has a specific, fixable problem.
What conversion rate puts a landing page in the top tier?
Around **11.4% or higher** for ecommerce specifically, which Unbounce identifies as the **top 25%** of performers in that category - nearly double the all-industry median. Top-decile pages across several public studies typically convert **2 to 4 times** the median rate for their category, which is the more useful benchmark once a page is already clearing the median comfortably.
Do conversion rates vary a lot by industry?
Yes, by a wide margin. WordStream's search-ad conversion data across roughly 20 industries shows **Automotive Repair, Service and Parts at 14.67%** and **Animals and Pets at 13.07%** on the high end, against **Finance and Insurance at 2.55%** and **Furniture at 2.73%** on the low end - a gap of more than five times between the best- and worst-converting categories on the same channel.
Why do some industries convert so much lower than others?
Mostly sales-cycle length, not landing page quality. WordStream's data shows the lowest-converting categories - Finance and Insurance, Furniture, Career and Employment - also carry the **highest cost per lead**, up to **USD 131.63** for Attorneys and Legal Services, because those purchases involve more consideration before a form gets submitted. A 2.5% conversion rate in one of those categories can still be a well-built page.
Should I compare my conversion rate against the 6.6% median or my own industry?
Your own industry, whenever the data exists. The 6.6% all-industry median in Unbounce's report is useful only as a first sanity check; a real estate page converting at 3.28%, in line with WordStream's real estate benchmark, is not underperforming even though it sits well under the cross-industry median - it is performing normally for a category with a longer, higher-consideration buying decision.
Sources
Unbounce - What's a good conversion rate? (41,000-landing-page benchmark)
Unbounce - Conversion Benchmark Report
WordStream - Conversion rate benchmarks for your industry
Think with Google - Milliseconds Make Millions report
HubSpot - Which types of form fields lower landing page conversions
Nielsen Norman Group - Scrolling and attention


