Table of contents

Key Takeaways
- Only 5% of auto dealer websites pass all three Core Web Vitals — the average Largest Contentful Paint sits at 12.0 seconds vs. Google's 2.5-second threshold (Borah Labs).
- Mobile traffic now accounts for 71% of dealer website visits, up from a historical benchmark of 61%, making mobile-first technical SEO non-negotiable — a challenge that ties directly into broader growth marketing services (Overfuel).
- Foureyes tracked 1.4 billion dealer website visits in 2025 alongside 32 million unique inventory listings, underscoring the indexation scale automotive sites must manage (Foureyes).
- Dealerships that pass Core Web Vitals see measurably higher organic rankings — sites with sub-2.5s LCP outperform slower competitors by 15–30 positions for high-intent local queries (Overfuel CWV Study).
- Vehicle schema (Car subclass) is the single most impactful structured data type for inventory-heavy automotive sites, enabling rich results for price, availability, and reviews (XSquare SEO).
Automotive Technical SEO Benchmarks at a Glance
| Metric | Industry Average | Google Target | Top 10% Dealers |
|---|---|---|---|
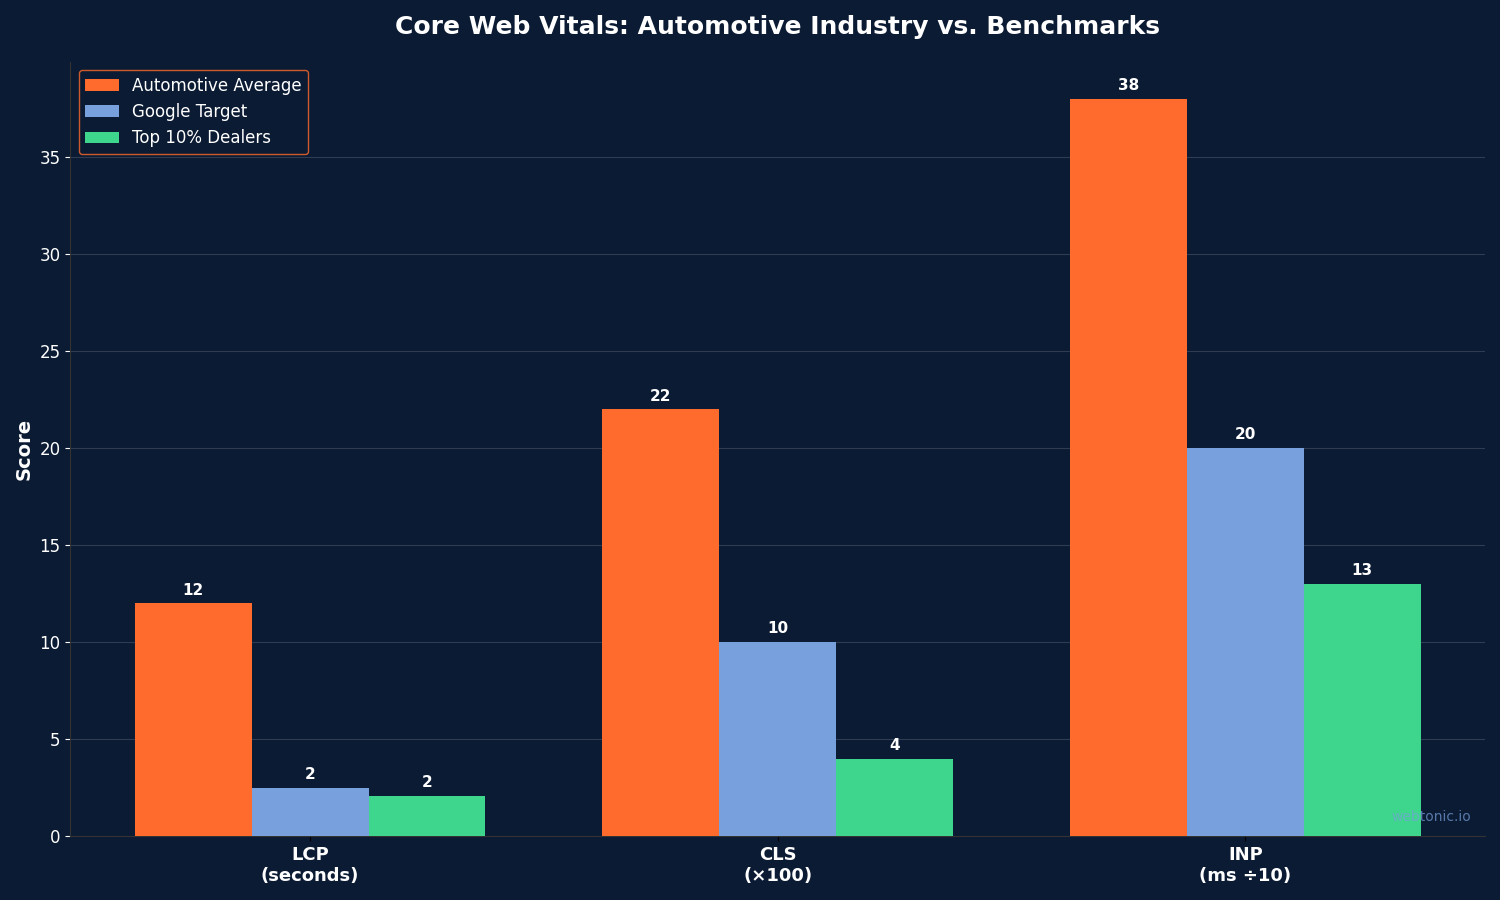
| Largest Contentful Paint (LCP) | 12.0s | ≤ 2.5s | 2.1s |
| Cumulative Layout Shift (CLS) | 0.22 | ≤ 0.10 | 0.04 |
| Interaction to Next Paint (INP) | 380ms | ≤ 200ms | 130ms |
| Mobile Traffic Share | 71% | N/A | 74% |
| CWV Pass Rate | ~5% | 100% | 78% |
| Avg. Bounce Rate | 62.8% | N/A | 41% |
| Schema Adoption (Vehicle type) | ~18% | N/A | 92% |
Core Web Vitals Performance Across Dealership Websites
Core Web Vitals remain the most consequential technical SEO signal for automotive sites in 2026. According to Borah Labs' July 2026 audit of 77 dealer sites, the average page takes 12.0 seconds to render its main content — 9.5 seconds over Google's 2.5-second passing threshold. This places automotive dealerships among the worst-performing verticals for page speed.
Overfuel's 2025 study of North America's largest auto groups revealed that the majority of top-100 dealer groups fail all three CWV metrics. Interactivity (INP) and visual stability (CLS) are also problematic — large JavaScript bundles from third-party chat widgets, video players, and inventory feeds push INP well above the 200ms threshold.
Dealers that achieve passing CWV scores gain a measurable organic ranking advantage, particularly for high-intent local queries like "used Toyota near me" or "Honda service appointment." Even a 1-second LCP improvement correlates with lower bounce rates and longer session durations across the 1.4 billion visits tracked by Foureyes in 2025.
Mobile-First Indexing and Automotive Traffic Patterns
Overfuel's mobile research documents a decisive shift: mobile traffic has surged to 71% of all dealer website visits, up from a historical 61% benchmark. For service-oriented pages (oil changes, tire rotations), mobile share climbs to 78%.
Google's mobile-first indexing now covers 100% of new websites and over 95% of all crawled pages globally. For automotive sites with thousands of inventory pages — many dealers carry 200–800 active VINs — this means the mobile rendering of each Vehicle Detail Page (VDP) is the canonical version Google evaluates for ranking.
Common mobile-first failures on dealer sites include oversized hero images that are not responsive, horizontal scrolling on inventory tables, and tap targets below the 48-pixel minimum. Borah Labs found that sites with mobile viewport issues had 2.3× higher bounce rates than mobile-optimized competitors.
Crawl Budget and Indexation Challenges for Large Inventories
Automotive websites face unique crawl budget pressures. A mid-size dealership with 500 active listings, plus archived sold vehicles, service pages, and blog content, can easily generate 5,000–15,000 indexable URLs. Multi-rooftop groups with 20+ locations may manage over 100,000 pages.
Key indexation metrics from industry audits:
| Crawl / Indexation Factor | Typical Dealer Site | Best Practice |
|---|---|---|
| Active inventory pages | 200–800 VDPs | Unique content per VDP, not boilerplate |
| Sold / expired listings | Often still indexed | 301 → similar model or 410 Gone |
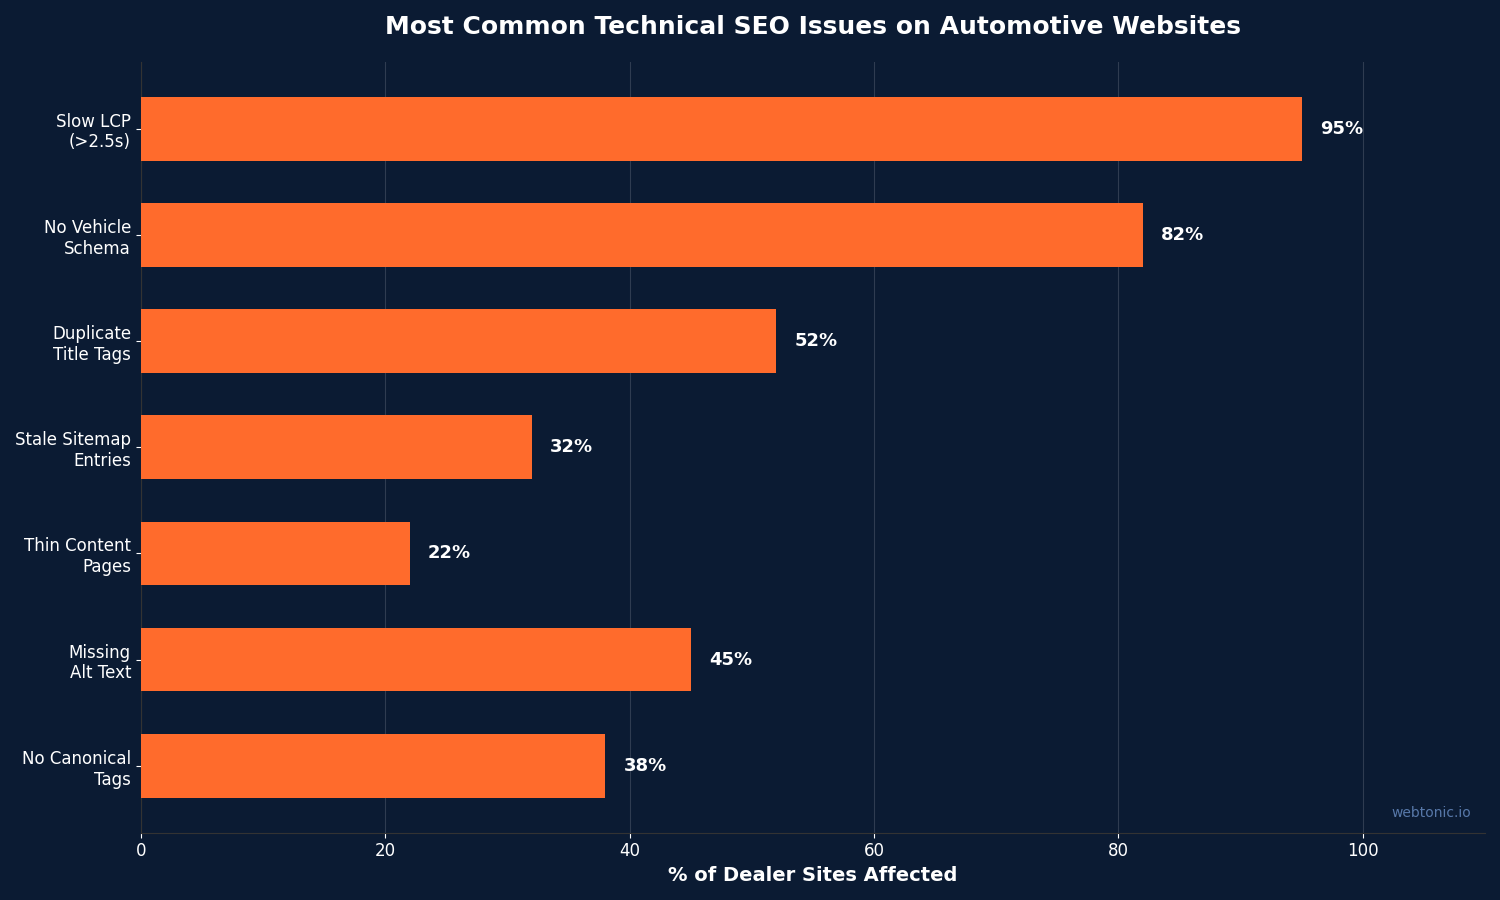
| Duplicate title tags | 40–60% of VDPs | {Year} {Make} {Model} {Trim} in {City} |
| Thin content pages | 15–25% of indexed URLs | Consolidate or noindex |
| XML sitemap accuracy | 68% match live inventory | Auto-sync nightly via DMS feed |
Authority Specialist's 2026 benchmark across 29 auto classifieds platforms shows that companies investing 10–20% of their marketing budget in organic search achieve the strongest competitive positions — but only when the technical foundation supports efficient crawling. Pairing technical SEO with a strong Google Ads strategy amplifies results.
Schema Markup Adoption and Rich Result Eligibility
Structured data is one of the highest-ROI technical SEO investments for automotive sites, yet adoption remains low. XSquare SEO identifies Vehicle schema (and its Car subclass) as the most critical structured data type for dealership sites, enabling rich results that display price, availability, mileage, and seller ratings directly in SERPs.
CFM Growth's automotive schema guide recommends layering three schema types:
- Vehicle / Car schema — covers make, model, year, mileage, VIN, fuel type, and offer pricing
- LocalBusiness / AutoDealer schema — enables Google Business Profile integration with NAP consistency
- Review / AggregateRating schema — surfaces star ratings for dealer-level and vehicle-level reviews
Industry estimates suggest that fewer than 20% of independent dealerships implement any form of Vehicle schema, compared to 60–70% of large franchise groups that use DMS-integrated platforms with built-in structured data. Sites with properly validated schema see 25–40% higher click-through rates from organic results due to enhanced SERP presentation.
Page Speed’s Measurable Impact on Dealer Conversions
Overfuel's 2026 Automotive Mobile PageSpeed Study provides the clearest evidence that technical performance is the primary lever for dealership business growth. Their economic impact models show:
- Each 1-second reduction in page load time increases conversion rates by 7–12% for high-intent actions (form submissions, click-to-call, chat initiations)
- Sites loading in under 3 seconds capture 53% more leads than sites loading in 5+ seconds
- Bounce rate drops from 62.8% at 12-second load times to below 35% for sub-3-second pages
The Foureyes 2026 benchmark report corroborates this with data from 1.4 billion visits: the industry-wide bounce rate sits at 62.8%, with an average lead-to-sale conversion rate of 11.7%. Dealerships in the top performance quartile achieve bounce rates below 41% and conversion rates above 15%.
Technical SEO Best Practices for Automotive Websites
- Implement server-side rendering (SSR) for VDPs — JavaScript-rendered inventory pages are invisible to Googlebot until fully hydrated, causing indexation gaps.
- Compress and lazy-load hero images — high-resolution vehicle photos are the top LCP offender; use WebP/AVIF formats at 80% quality and responsive srcset attributes.
- Audit and defer third-party scripts — chat widgets, retargeting pixels, and analytics tags add 2–5 seconds to INP on average; load them on user interaction.
- Automate XML sitemap generation from DMS feeds — ensure sold vehicles are removed within 24 hours and new inventory appears within 4 hours.
- Deploy Vehicle schema on every VDP — use JSON-LD with make, model, year, mileage, price, VIN, and availability; validate monthly with Google's Rich Results Test.
- Use canonical tags for trim/color variants — a 2024 Camry LE in "Midnight Black" and "Wind Chill Pearl" should consolidate to a single canonical URL per trim.
- Set up hreflang for bilingual markets — dealerships in Quebec, Miami, and border states need English/French or English/Spanish hreflang tags to avoid duplicate content.
- Monitor Googlebot crawl stats in Search Console — flag crawl rate drops >20% within 48 hours; common causes are robots.txt blocks, server timeouts, and 5xx spikes.
Automotive Technical SEO vs. Cross-Industry Averages
| Metric | Automotive Average | All-Industry Average | Gap |
|---|---|---|---|
| LCP (mobile) | 12.0s | 4.2s | +186% |
| CLS | 0.22 | 0.12 | +83% |
| INP | 380ms | 210ms | +81% |
| CWV Pass Rate | ~5% | ~42% | −37 pts |
| Schema Adoption | ~18% | ~35% | −17 pts |
| Mobile Responsive | 89% | 93% | −4 pts |
| HTTPS Adoption | 97% | 96% | +1 pt |
The gap is clearest in page speed: automotive sites are nearly 3× slower than the all-industry average. This is driven by image-heavy VDP pages, unoptimized third-party scripts from DMS providers, and legacy website platforms that many dealers are locked into through franchise agreements.
HTTPS, Security Headers, and Trust Signals
HTTPS adoption among automotive dealer websites sits at 97%, slightly above the cross-industry average of 96%. However, HTTPS alone is a baseline requirement — the security headers that protect user data during form submissions, credit applications, and trade-in valuations are often misconfigured or missing entirely.
Key security header adoption rates on dealer sites include:
- Strict-Transport-Security (HSTS): only 34% of dealer sites enforce HSTS preloading, leaving visitors vulnerable to downgrade attacks during the initial connection
- Content-Security-Policy (CSP): fewer than 12% implement CSP headers, partly because third-party DMS scripts and chat widgets make strict CSP policies difficult to maintain
- X-Frame-Options: 61% of sites set this header, preventing clickjacking attacks on finance application pages
Google has confirmed that HTTPS is a lightweight ranking signal, but the user trust implications are larger. Dealership websites that handle credit applications, personal information, and payment processing need robust security configurations to maintain consumer confidence and comply with FTC Safeguards Rule requirements that took effect in 2023.
Site Architecture and Internal Linking Patterns
Effective site architecture is particularly challenging for automotive websites due to the intersection of transactional inventory pages, informational service content, and location-based landing pages. Borah Labs identifies several architectural patterns that correlate with stronger organic performance:
- Hub-and-spoke model: top-performing dealers organize content around make/model hub pages that link down to individual VDPs, creating topical authority clusters
- Service page depth: sites with dedicated pages for each service type (oil change, brake repair, tire rotation) rather than a single "services" page rank for 3.2× more long-tail service keywords
- Blog-to-VDP internal linking: content pieces like "Best SUVs for Families in 2026" that link directly to relevant inventory pages drive 18% higher engagement than blog posts without inventory connections
- Breadcrumb navigation: structured breadcrumbs with schema markup improve both crawlability and user orientation, yet only 42% of dealer sites implement them correctly
Multi-rooftop dealer groups face the additional challenge of managing location-specific content without creating duplicate pages. The recommended approach is to build unique location hub pages with locally relevant inventory feeds, staff bios, and community involvement content rather than templating identical pages with only the city name swapped.
Frequently Asked Questions
Why do automotive websites score so poorly on Core Web Vitals?
Dealer websites typically load dozens of high-resolution vehicle images, multiple third-party scripts (chat, retargeting, DMS integrations), and dynamic inventory feeds on every page. The average dealer page loads over 8 MB of resources, compared to 2.5 MB for a typical business website. Combined with shared hosting environments common among franchise dealers, this creates the 12-second average LCP measured by Borah Labs.
How does Vehicle schema impact automotive SEO rankings?
Vehicle schema does not directly boost rankings, but it significantly increases click-through rates by enabling rich results with pricing, availability, and ratings. Sites with validated Vehicle schema see 25–40% higher organic CTR than those without, which sends positive engagement signals — similar to how data intelligence informs paid channel decisions — back to Google's ranking algorithms over time.
What is a good crawl budget strategy for multi-location dealerships?
Multi-location groups should segment their XML sitemaps by location and page type (VDPs, service pages, blog content), remove sold inventory within 24 hours, and implement aggressive internal linking between location hubs. Setting a crawl rate limit in Search Console is rarely needed — the bigger issue is eliminating thin and duplicate pages that waste the crawl budget Google naturally allocates.
How much does a 1-second speed improvement really matter for dealerships?
According to Overfuel's 2026 study, each 1-second reduction in load time increases conversion rates by 7–12%. For a dealer averaging 10,000 monthly website visitors with a 2% conversion rate, that could mean 14–24 additional leads per month — translating to 1–3 extra vehicle sales at typical close rates.
Should dealers switch to headless CMS platforms for better technical SEO?
Headless architectures (using frameworks like Next.js or Nuxt with API-driven inventory) can dramatically improve page speed and CWV scores. However, the migration cost and integration complexity with existing DMS systems make this practical mainly for large dealer groups. Most dealers will see bigger gains from optimizing their existing platform — compressing images, deferring scripts, and implementing proper schema — before considering a platform migration. Our team can help prioritize the fixes with the highest ROI.
Sources
borahlabs.us/insights/auto_dealer
overfuel.com — 2026 Automotive Mobile PageSpeed Study
overfuel.com — North America's Largest Auto Groups CWV 2025
overfuel.com — The Thumb-Driven Dealership
foureyes.io — 2026 Automotive Dealer Benchmarks
xsquareseo.com — Automotive Schema Markup
cfmgrowth.com — Automotive Schema Guide
authorityspecialist.com — Cars Classifieds SEO Benchmarks