Table of contents

Key Takeaways
- 82.8% of contractor websites have a poor mobile LCP score, with remodeling sites averaging 10.16 seconds — over 4× Google's 2.5-second threshold for Core Web Vitals.
- 47.6% of page-one Google results pass Core Web Vitals versus 44.2% on page two, and the top 3 positions pass at 50.8%, confirming technical health correlates with rankings.
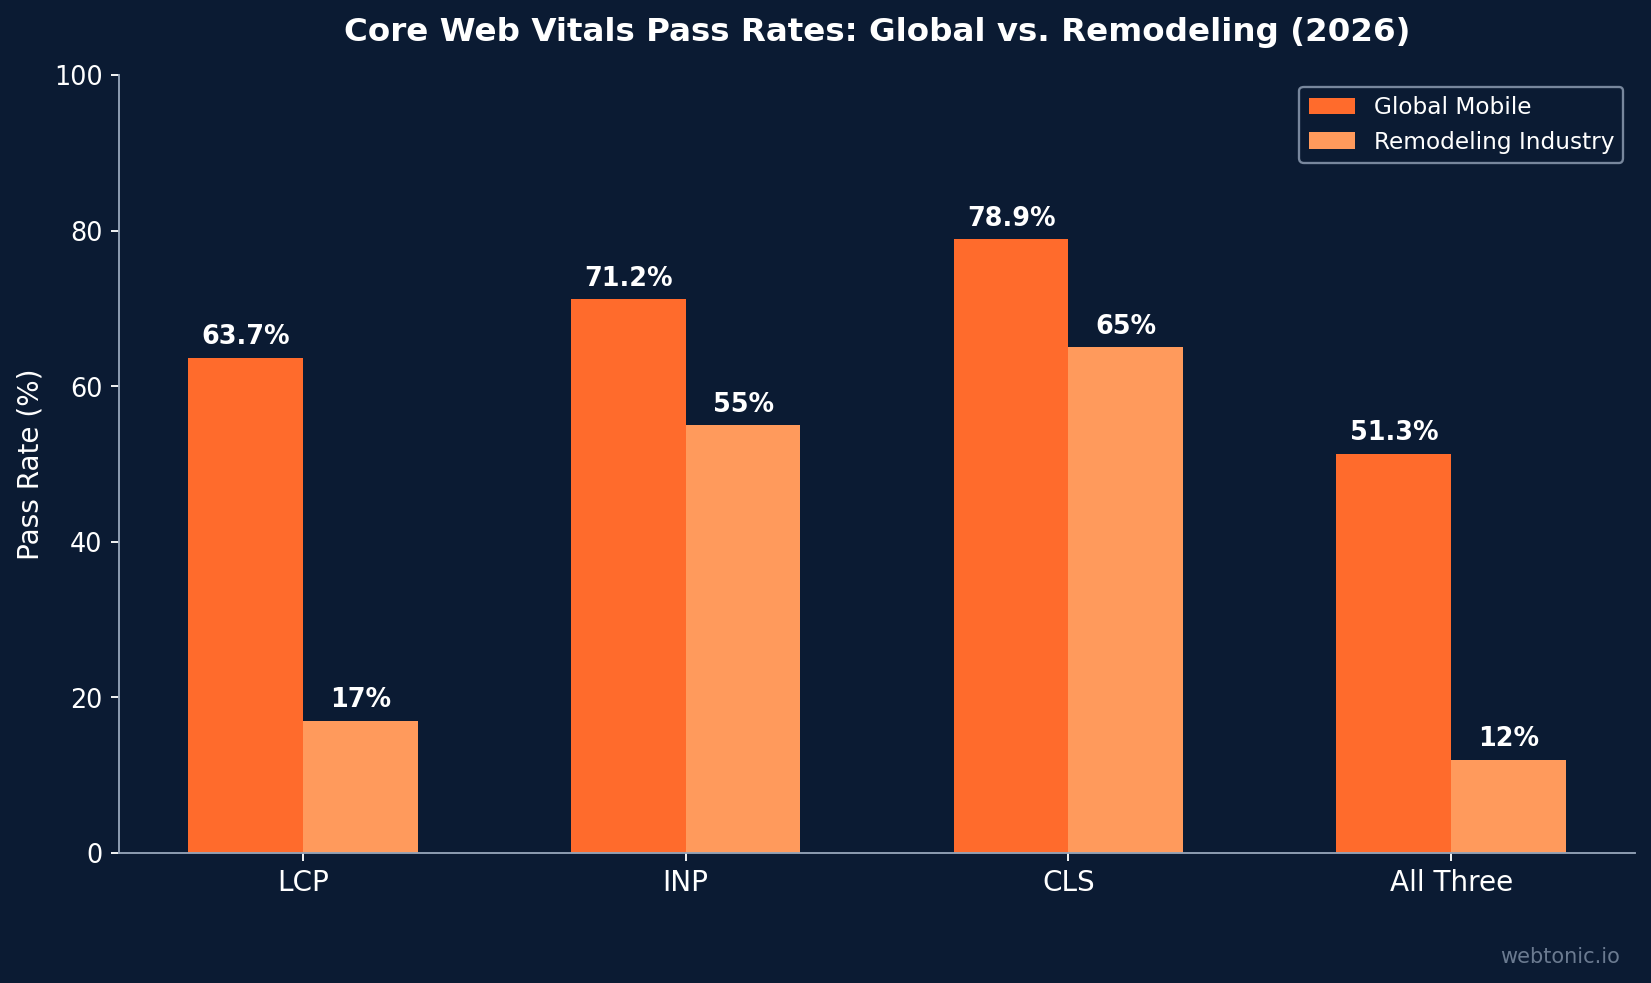
- Only 51.3% of sites pass all three Core Web Vitals on mobile (LCP 63.7%, INP 71.2%, CLS 78.9%), leaving nearly half of countertop websites technically underperforming.
- Countertop websites with page loads under 2.5 seconds convert at 6.8% compared to 2.1% for sites loading above 4.5 seconds — a 3.2× conversion difference driven by speed.
- Portfolio-heavy countertop sites pay a "gallery tax" — unoptimized hero images and large stone slab galleries are the primary cause of slow LCP scores across the remodeling sector.
Core Web Vitals Benchmarks for Countertop Websites
Technical SEO begins with Core Web Vitals — the three metrics Google uses to evaluate page experience. Here is how countertop and remodeling websites perform against these thresholds in 2026.
| CWV Metric | Google Threshold | Global Mobile Pass Rate | Remodeling Industry |
|---|---|---|---|
| LCP (Largest Contentful Paint) | Under 2.5s | 63.7% | ~17% (mean 10.16s) |
| INP (Interaction to Next Paint) | Under 200ms | 71.2% | ~55% (estimated) |
| CLS (Cumulative Layout Shift) | Under 0.1 | 78.9% | ~65% (estimated) |
| All Three (Combined Pass) | Pass all 3 | 51.3% | ~12% (estimated) |
Sources: JustAnalytics, 2026 (global), Fervor Studio, 2026 (remodeling). The gap between the global 51.3% mobile pass rate and the remodeling industry's estimated 12% represents an enormous competitive opportunity for countertop businesses willing to invest in technical optimization.
Page Speed Performance Across Remodeling Websites
Page speed remains the most critical technical SEO factor for countertop websites. The data reveals a stark picture: the median mobile LCP for remodeling contractor websites is 7.57 seconds, and the mean reaches 10.16 seconds — both far exceeding Google's 2.5-second "Good" threshold (Fervor Studio, 2026).
This speed deficit directly impacts business outcomes. A 200-site conversion study found that pages loading under 2.5 seconds achieved a 6.8% conversion rate, while those loading above 4.5 seconds converted at just 2.1% — a 3.2× difference. Every additional second of load time drops conversion rates by approximately 7% for contractor websites (PipelineOn, 2026).
| Speed Range | Conversion Rate | Bounce Rate Impact | Typical Site Profile |
|---|---|---|---|
| Under 2.5s (Good) | 6.8% | Baseline | Optimized images, CDN, lazy loading |
| 2.5–4.5s (Needs Work) | 4.2% | +15–20% | Some optimization, large galleries |
| 4.5–7.5s (Poor) | 2.1% | +35–50% | Unoptimized hero images, no CDN |
| Above 7.5s (Critical) | Under 1.5% | +60%+ | Heavy JS, uncompressed portfolio |
For countertop fabricators whose websites rely on high-resolution stone slab photography, the "gallery tax" is the primary technical bottleneck. Portfolio-heavy remodeling sites ship oversized hero images and unoptimized gallery pages that account for the majority of the LCP deficit.
The speed-to-conversion relationship follows a clear curve: sites in the 2.5–4.5 second range convert at approximately 4.2%, representing a middle ground that many countertop businesses can achieve with basic optimization. However, the leap from 4.2% to 6.8% conversion rate requires more aggressive technical investment — image CDNs, next-gen formats like WebP and AVIF, and critical CSS inlining. For countertop businesses where a single project averages $3,000–$8,000, even a 1% conversion rate improvement translates to thousands of dollars in monthly revenue, making technical speed optimization one of the highest-ROI investments available through professional digital marketing services.
Core Web Vitals Impact on Search Rankings
The relationship between technical SEO metrics and search rankings has been quantified in several large-scale studies. A 37,036-site analysis found that 47.6% of page-one results pass Core Web Vitals versus 44.2% on page two, with the top 3 positions passing at 50.8% (PageSpeedMatters, 2026).
Additional ranking correlation data includes:
- 73% of pages with good CWV scores rank in the top 10 versus 53% of pages with poor scores (Searchlab, 2026).
- Fewer than 45% of pages on large JavaScript-heavy domains pass all three CWV thresholds — a particular risk for countertop sites using heavy gallery frameworks (Authority Specialist, 2026).
- Mobile pages load 87% slower than desktop pages on average (3.8s vs 2.1s median LCP), meaning mobile-first countertop shoppers experience significantly worse performance.
- 52% of page-one results still fail Core Web Vitals — confirming that CWV is a tiebreaker signal, not an absolute ranking requirement.
For countertop businesses, these statistics mean that fixing technical SEO creates a measurable competitive advantage in local search results, where most competitors have portfolio-heavy, slow-loading websites that fail CWV thresholds.
Mobile Performance Data for Home Improvement Sites
Mobile traffic dominates countertop website visits. 58.4% of countertop manufacturing website traffic comes from mobile devices (CuFinder, 2026), yet mobile experiences remain significantly worse than desktop across the entire home services sector.
Key mobile performance statistics for remodeling and home improvement sites include:
- 82.8% of contractor sites have poor mobile LCP (above Google's 4-second "poor" threshold), based on a 380-site benchmark study spanning roofing, remodeling, and HVAC sites (Fervor Studio, 2026).
- 65–75% of all countertop-related searches originate on mobile devices, making mobile page speed a direct revenue driver.
- Desktop conversion rates average 4.2% versus 1.8% on mobile for countertop manufacturers — a gap largely attributable to slow mobile load times and poor mobile UX.
- Furniture and home goods websites average 12.0 seconds to render main content, 9.5 seconds over Google's passing threshold (Borah Labs, 2026).
The mobile performance gap represents a direct business cost: every second of mobile delay increases abandonment rates, and for countertop businesses where a single project averages $3,000–$8,000, each lost mobile visitor represents substantial revenue leakage.
Technical SEO Case Studies in the Countertop Industry
Several countertop companies have demonstrated the impact of technical SEO improvements on business outcomes. These case studies illustrate the ROI of investing in site speed, crawlability, and schema implementation.
| Company / Study | SEO Improvement | Result | Timeframe |
|---|---|---|---|
| Metro Atlanta Countertop Co. | Full SEO + technical overhaul | 350% increase in qualified leads, 420% organic traffic growth | 12 months |
| Local Fabricator (Launch Local) | New site + SEO strategy | 127% increase in organic traffic | 4 months |
| Granite & Marble Treasure Coast | Technical + local SEO | Page 1 rankings for high-value local terms | 6 months |
| Webflow vs WordPress (200-site study) | Platform comparison | 67% Webflow CWV pass vs 35% WordPress | Cross-sectional |
Sources: Yeah Local, SlabWise. The 350% qualified lead increase from a full technical SEO overhaul demonstrates that for countertop businesses, search visibility improvements compound over time — unlike paid ads, organic traffic from technical SEO gains persists without ongoing ad spend.

Technical SEO Priorities for Countertop Websites
- Optimize hero images and gallery pages — compress stone slab photos to WebP format, implement lazy loading, and use responsive srcset attributes. This single fix typically reduces LCP by 40–60% on portfolio-heavy sites.
- Implement proper schema markup — LocalBusiness + Product schema for countertop fabricators enables rich results. Schema implementation drives up to 40% higher click-through rates in search results (Authority Specialist, 2026).
- Fix mobile viewport and tap target issues — with 58.4% of traffic coming from mobile, ensure all CTAs meet Google's 48×48px minimum tap target size and text remains readable without zooming.
- Deploy a CDN for image-heavy pages — countertop portfolio galleries with 20–50 high-resolution images benefit most from edge caching and image optimization services.
- Improve server response time — target TTFB under 200ms. Many countertop websites on shared hosting show TTFB above 800ms, adding unnecessary delay before any content rendering begins.
- Ensure proper indexation — sites with fewer than 15 indexed pages tend to underperform in local search. Create dedicated pages for each countertop material, service area, and project type to build indexable depth.
- Implement internal linking between material pages — connect granite, quartz, marble, and quartzite pages to create topical authority clusters that support data-driven SEO strategies.
Website Platform Performance for Countertop Sites
The choice of website platform significantly impacts technical SEO outcomes. A comparative study found that Webflow-built contractor sites pass Core Web Vitals at 67% versus just 35% for WordPress sites, a nearly 2× advantage driven by Webflow's built-in image optimization and global CDN.
| Platform | CWV Pass Rate | Avg Mobile LCP | Best For |
|---|---|---|---|
| Webflow | 67% | ~3.5s | Design-forward portfolios |
| WordPress (optimized) | 35–50% | ~5.2s | Plugin ecosystem, custom features |
| Shopify | 40–55% | ~4.8s | E-commerce (sample sales, remnants) |
| Custom/Static | Varies widely | 2.0–15.0s | Full control, requires dev resources |
For countertop fabricators choosing a platform, the key consideration is image handling. The average countertop portfolio page contains 15–30 high-resolution slab images, each potentially 2–5MB uncompressed. Platforms with built-in image optimization and lazy loading dramatically outperform those requiring manual configuration.
The local map pack captures 40–50% of all clicks for countertop searches (SlabWise), meaning technical SEO improvements that boost organic rankings also improve map pack visibility through stronger overall domain authority signals. Combined with well-structured Google Ads campaigns, technical SEO creates a compounding visibility advantage for countertop fabricators competing in local markets.
Technical SEO Audit Benchmarks for Countertop Companies
A comprehensive technical SEO audit for countertop websites should evaluate performance across several key dimensions. The following benchmarks represent industry standards that fabricators should target.
| Audit Category | Industry Average | Target Benchmark | Priority |
|---|---|---|---|
| Mobile LCP | 7.57s (median) | Under 2.5s | Critical |
| Mobile Performance Score | 56/100 | Above 80/100 | High |
| Desktop Performance Score | 75/100 | Above 90/100 | Medium |
| Indexed Pages | 12–25 pages | 15+ unique pages | High |
| Domain Authority | DA 32 (contractor avg) | DA 25+ for local | Medium |
| Backlink Profile | 1,744 (contractor avg) | 500+ relevant links | Medium |
| Schema Implementation | Under 20% of sites | LocalBusiness + Product | High |
Source: Fervor Studio Contractor CRO Index, 2026. The average contractor website has a Domain Authority of 32 with 1,744 backlinks, but countertop fabricators in competitive metro areas need stronger profiles to rank against national aggregators and home improvement giants.
Of particular concern for countertop sites is the gap between desktop and mobile performance scores. With desktop averaging 75/100 and mobile at just 56/100, the mobile experience is 25% worse than desktop — directly impacting the 58.4% of visitors arriving on smartphones. This gap is primarily caused by unoptimized image delivery and render-blocking JavaScript on gallery pages.
Organic Traffic ROI for Countertop Businesses
Technical SEO improvements compound over time, making organic traffic one of the highest-ROI marketing channels for countertop businesses. SEO delivers an average 681% ROI for construction and home improvement businesses, significantly outperforming paid advertising channels on a cost-per-lead basis over time.
- 42% of global website traffic comes from organic search for manufacturing businesses, making it the single largest traffic source ahead of direct (24.5%) and paid channels (CuFinder, 2026).
- The local map pack captures 40–50% of all clicks for countertop-related searches, meaning technical SEO improvements that boost domain signals also improve local pack visibility (SlabWise).
- Countertop businesses with optimized websites average $88 per lead from search versus $65 from social media — but organic search leads close at higher rates due to stronger purchase intent.
- 90% of contractors report being satisfied after investing in SEO as a channel, with the majority seeing meaningful results within 4–6 months of technical improvements.
The compound nature of organic traffic means that every technical SEO fix provides lasting value — unlike paid advertising where traffic stops when budgets are paused. For countertop fabricators, fixing a slow portfolio page today continues generating leads for years, making technical SEO the foundation of sustainable digital growth.
Frequently Asked Questions
What is a good page speed for a countertop website?
A good page speed target for countertop websites is LCP under 2.5 seconds on mobile. Currently, the median remodeling website loads in 7.57 seconds on mobile, and sites loading under 2.5 seconds convert at 6.8% versus 2.1% for sites above 4.5 seconds. Achieving this threshold typically requires image compression, lazy loading, and CDN deployment.
How do Core Web Vitals affect countertop website rankings?
Core Web Vitals serve as a ranking tiebreaker in Google's algorithm. 47.6% of page-one results pass CWV versus 44.2% on page two, with the top 3 positions passing at 50.8%. For countertop businesses in competitive local markets, passing all three CWV metrics can provide the edge needed to outrank technically inferior competitors.
Why are countertop websites so slow?
Countertop websites are slow primarily because of unoptimized portfolio galleries featuring large stone slab images. The remodeling industry's mean mobile LCP of 10.16 seconds is driven by heavy hero images, uncompressed gallery photos, and JavaScript-heavy gallery frameworks. Switching to optimized creative assets with WebP format and lazy loading typically solves 60–80% of speed issues.
Does website speed affect countertop lead generation?
Yes — dramatically. Every second of load time delay reduces conversion rates by approximately 7% for contractor websites. For a countertop business generating 50 leads per month from a site loading in 5 seconds, improving to 2.5 seconds could add an estimated 15–20 additional leads monthly, based on the 3.2× conversion differential observed in industry studies.
What technical SEO should countertop companies prioritize first?
The highest-impact first step is image optimization across portfolio and gallery pages. Compressing images to WebP, implementing lazy loading, and adding responsive srcset attributes typically reduces LCP by 40–60%. Second priority is LocalBusiness schema markup, which can increase click-through rates by up to 40%. Third is mobile viewport fixes to address the 58.4% of traffic coming from mobile devices.
Sources
justanalytics.app/blog/core-web-vitals-statistics-2026
fervorstudio.ca/contractor/cro-index/state-of-the-industry
fervorstudio.ca/news/remodeling-website-speed
pagespeedmatters.com/resources/data-studies/speed-vs-google-rankings
searchlab.nl/en/statistics/technical-seo-statistics-2026
authorityspecialist.com/resources/technical-seo-tools/technical-seo-statistics
pipelineon.com/blog/contractor-website-speed-optimization
cufinder.io/blog/benchmarks/countertop-manufacturing
slabwise.com/guide/seo
borahlabs.us/insights/furniture