Table of contents

Key Takeaways
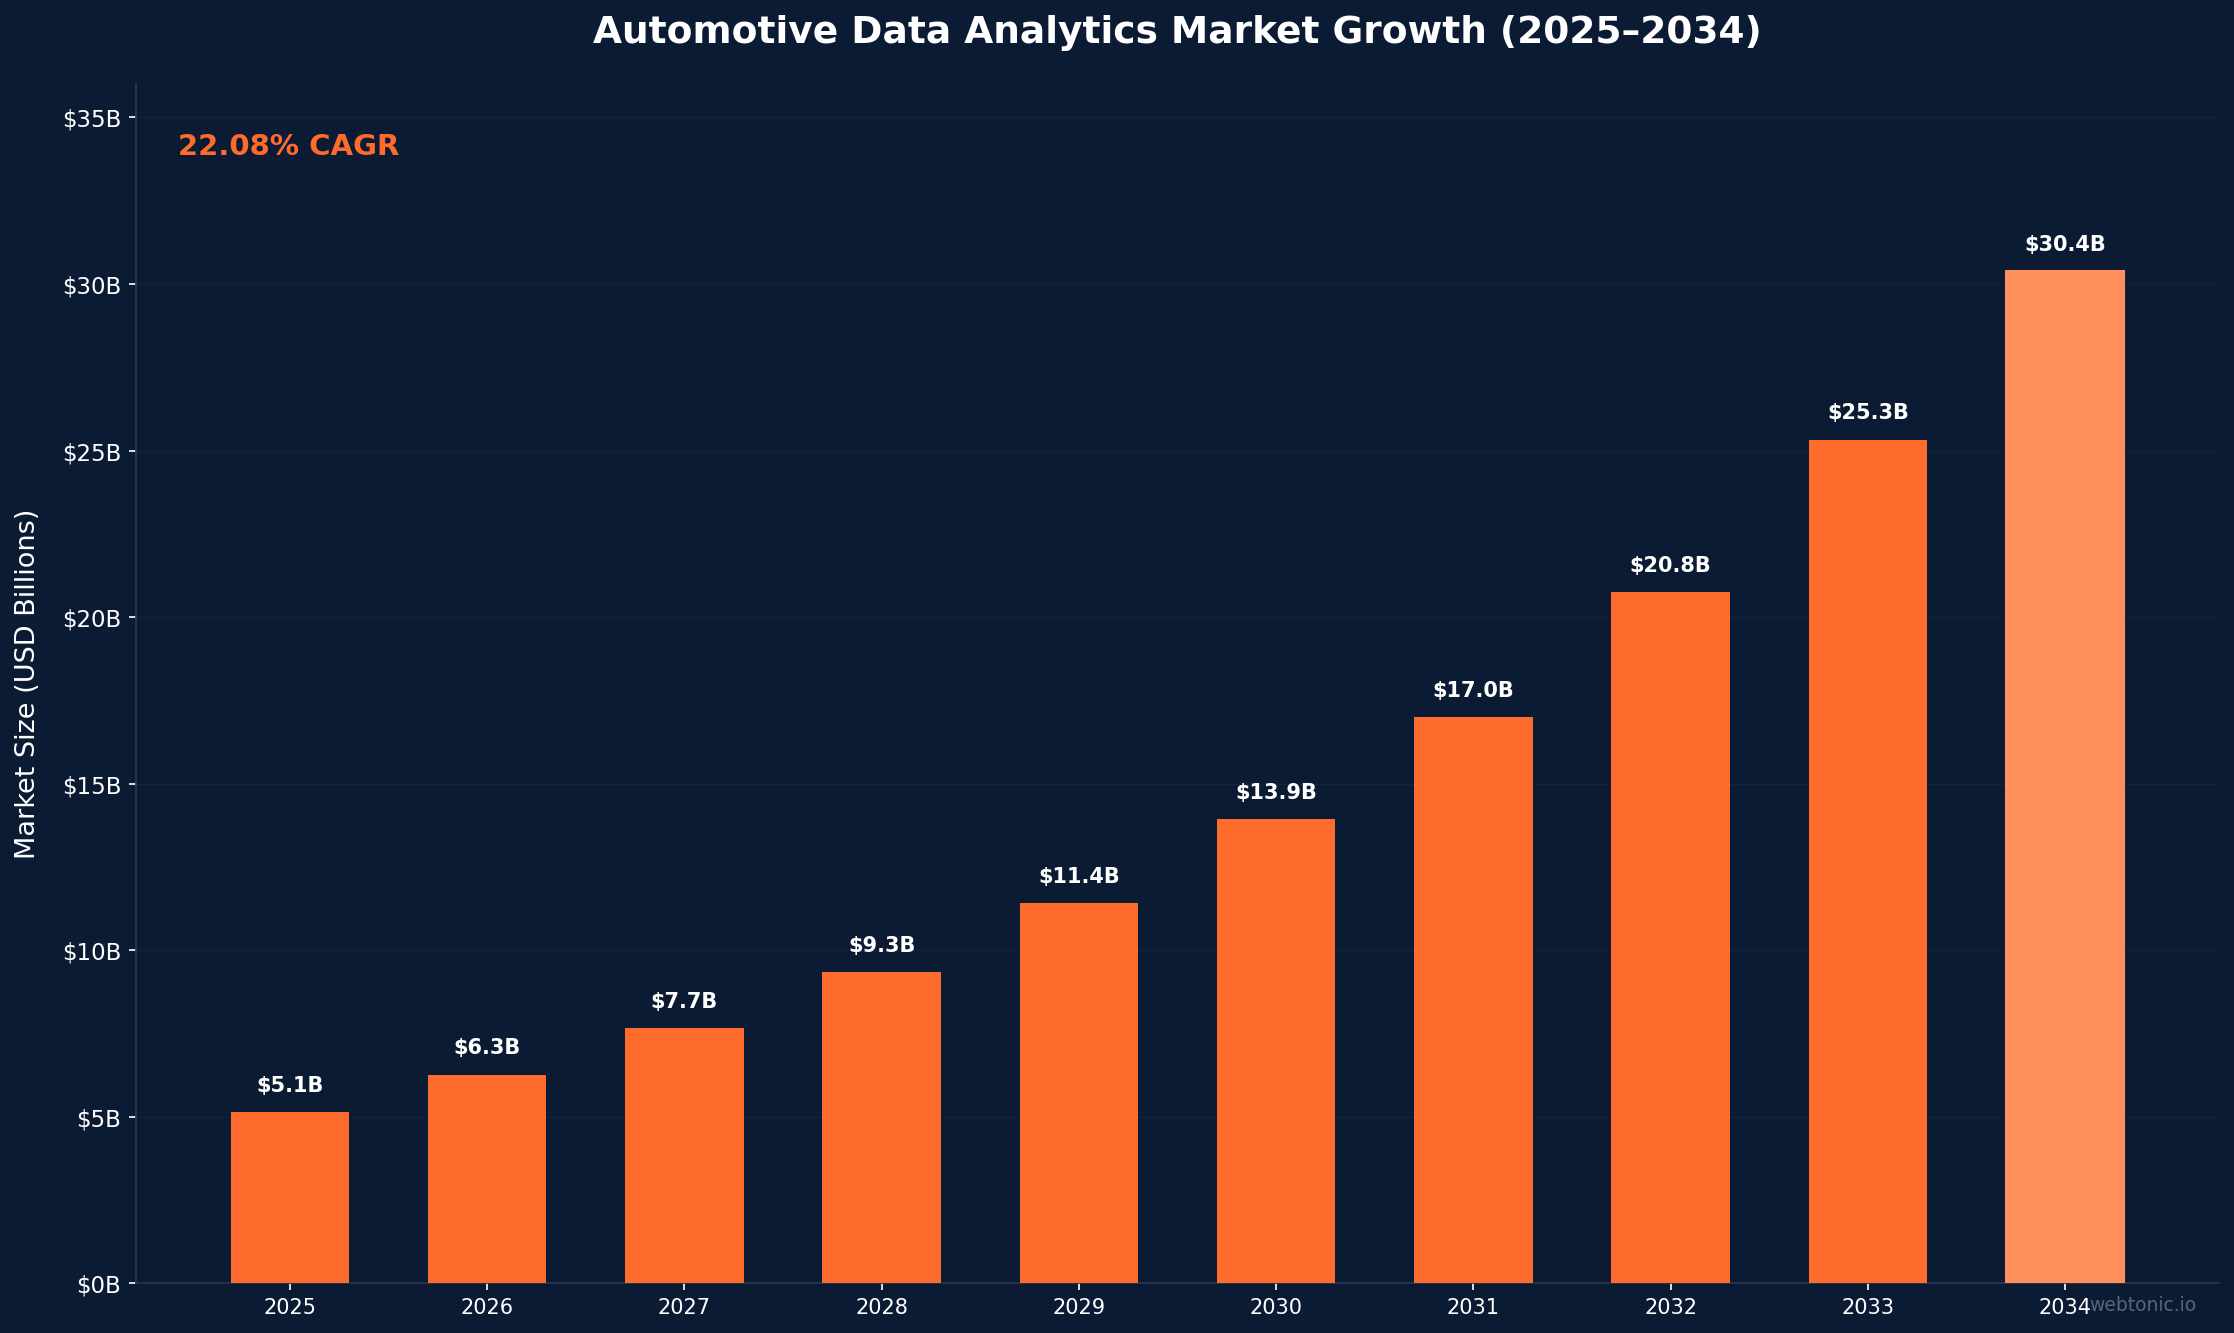
- The global automotive data analytics market is valued at $5.14 billion in 2025 and is projected to reach $30.4 billion by 2034 at a 22.08% CAGR.
- The average U.S. dealership's tech stack depth is 3.8 out of 15 available categories, meaning most dealers use only 25% of available MarTech solutions.
- Dealership digital ad conversions surged 37% year-over-year in early Q2 2026, with cost per lead reaching its lowest point in 12 months.
- 92% of auto sales cannot be traced to a single touchpoint, making multi-touch attribution dashboards essential for ROI measurement.
- The automotive DMS market is expected to grow from $5.5 billion in 2026 to $12.9 billion by 2036 at an 8.8% CAGR.
- Dealers using unified marketing dashboards see 2.3× faster market share growth compared to those relying on siloed reporting.
- Car buyers navigate an average of 62 touchpoints over 95 days before purchasing, requiring advanced dashboard tracking to capture the full journey.
Automotive Marketing Dashboard Benchmarks at a Glance
Modern automotive dealerships generate data across dozens of platforms, from Google Ads and Meta campaigns to CRM systems and dealer management software. These dashboard benchmarks provide a snapshot of where the industry stands in terms of marketing analytics maturity and performance tracking capabilities.
| Metric | Benchmark | Source |
|---|---|---|
| Avg. Dealer Tech Stack Depth | 3.8 / 15 categories | DealerSignals 2026 |
| Digital Ad Conversion Lift (YoY) | +37% | Fullpath Q2 2026 |
| Cost Per Lead (Lowest in 12 Mo) | Record low | Fullpath Q2 2026 |
| Lead-to-Sale Conversion Rate | 11.7% | Foureyes 2026 |
| Sales Untraceable to Single Touch | 92% | Cox Automotive |
| Avg. Car Buyer Touchpoints | 62 over 95 days | Demand Local |
| Dealer.com KPI Library | 180+ KPIs | Dealer.com |
| Automotive Data Analytics Market | $5.14B (2025) | GII Research |
Automotive Data Analytics Market Size and Growth
The automotive analytics ecosystem is expanding rapidly as dealerships and OEMs invest in data-driven decision-making. The global automotive data analytics market was valued at $5.14 billion in 2025 and is expected to reach $30.4 billion by 2034, representing a 22.08% compound annual growth rate (GII Research). This expansion is fueled by the increasing adoption of AI, machine learning, and real-time analytics across the entire automotive value chain, from manufacturing to retail.
On the dealer management side, the automotive DMS market is projected to expand from $5.5 billion in 2026 to $12.9 billion by 2036 at an 8.8% CAGR (Future Market Insights). Cloud-based deployment models now dominate new DMS installations, enabling real-time data synchronization between marketing, sales, and service departments. The shift from on-premise to cloud is accelerating as multi-location dealer groups demand centralized dashboard views across all their stores.
The broader auto dealer software market is expected to reach $10.78 billion by 2034, up from $5.72 billion in 2025. This includes CRM platforms, inventory management systems, digital retailing tools, and the analytics dashboards that tie them all together. Dealerships that invest in integrated analytics platforms consistently report higher marketing ROI, faster inventory turnover, and stronger customer retention rates than those using disconnected spreadsheet-based reporting.
Dealer Technology Adoption and MarTech Stack
Despite the explosive growth of marketing technology, most dealerships significantly underutilize available tools. According to DealerSignals' 2026 State of Dealer Technology report, the average U.S. dealer's stack depth is just 3.8 out of 15 available categories, meaning dealerships are leveraging only about 25% of the MarTech solutions available to them.
Key findings from the DealerSignals analysis of 1,760 dealers across 22 states with 3,079 web pages scanned include:
- 79% of dealers have adopted a CRM system, making it the most widely used technology category across franchise and independent dealerships
- Digital advertising tools are the second-most adopted category, though many dealers still rely on vendor-provided reporting rather than independent dashboards with cross-channel visibility
- Data and analytics tools have the lowest adoption rates among the 15 categories, indicating a significant gap between data generation and data utilization in the industry
- Independent dealers lag franchise dealers in tech adoption by approximately 1.2 stack depth points on average, with the gap widest in analytics and attribution categories
- Inventory management and listing platforms are the third most adopted category, though integration with marketing dashboards remains inconsistent across the industry
The Dealer.com analytics platform alone tracks over 180 key performance indicators across digital marketing channels, yet many dealerships only monitor a fraction of these metrics, missing critical optimization opportunities that could reduce wasted ad spend and improve conversion rates.
Dealership Marketing Performance Benchmarks
Automotive marketing dashboards are only as valuable as the benchmarks they track and the actions they enable. The 2026 Automotive Dealer Benchmarks Report from Foureyes, which analyzed 1.4 billion dealer website visits, reveals several critical performance trends that shape how dealers should configure their dashboards:
| KPI | 2025 Benchmark | Trend |
|---|---|---|
| Lead-to-Sale Conversion | 11.7% | Up from 10.2% (prior year) |
| Website Bounce Rate | 62.8% | Slight improvement YoY |
| Digital Ad Conv. Surge | +37% YoY | Strongest in 12 months |
| Cost Per Lead (Q2 2026) | 12-month low | Decreasing steadily |
| VDP-to-Lead Rate | 3.5–5.2% | Stable across segments |
Fullpath's Auto Intelligence Index reported that dealership digital ad conversions surged 37% year-over-year in early Q2 2026, with cost per lead reaching its lowest point in 12 months (PR Newswire). This trend strongly suggests that data-driven campaign optimization through marketing dashboards is actively reducing waste and improving efficiency across the entire industry. Dealerships that track these benchmarks in real-time dashboards can spot downturns before they erode profitability.
Multi-Touch Attribution and the Dashboard Imperative
The automotive purchase journey is among the most complex in all of consumer marketing. According to Cox Automotive research, 92% of auto sales cannot be traced to a single marketing touchpoint, with only 3.5% of touchpoints accurately tracked by traditional last-click attribution models. Meanwhile, the average car buyer navigates 62 touchpoints over a 95-day journey, spending 14 hours and 19 minutes researching online before stepping into a dealership.
These statistics make an overwhelming case for multi-touch attribution dashboards:
- 71% of car buyers begin their journey on mobile, making cross-device tracking essential for accurate attribution across the research-to-purchase funnel
- Autotrader influences 55% of purchase decisions but receives only 4% of last-touch credit in traditional models, exposing massive measurement gaps that only multi-touch dashboards can reveal
- Dealerships using unified attribution dashboards see 2.3× faster market share growth than those using siloed, single-channel reporting (Lifesight)
- 65% of incremental revenue is identified only with unified media mix modeling (MMM), completely invisible to platform-reported dashboards that operate in isolation
- Orbee's automotive attribution platform now enables DMS sales records to flow back to Google, Meta, and programmatic platforms, allowing dashboards to display actual VIN-level sold metrics rather than just form fills or phone calls (Orbee)
For automotive businesses looking to understand their full marketing impact, implementing data intelligence solutions with proper multi-touch attribution is no longer optional — it is the foundation of competitive marketing. Without it, dealerships are effectively making decisions based on less than 8% of their actual data.

Marketing ROI Measurement in Automotive Retail
Measuring true marketing ROI in automotive retail requires going far beyond vanity metrics like impressions and clicks. According to Keyloop, there is a meaningful difference between marketing reporting and genuine performance management — a report tells you what happened, while performance management tells you why it happened and what to do about it.
Key ROI dashboard metrics that top-performing dealerships track include:
- Campaign-attributed revenue — tying ad spend directly to vehicle sales, not just leads generated or form submissions received
- Cost per sale (CPS) rather than cost per lead — the average dealer spends $631,000 annually on marketing, making waste identification critical for profitability
- Digital retailing engagement metrics — tracking how many website visitors complete credit applications, trade-in valuations, and payment calculators before contacting the dealership
- Inventory-specific ROAS — matching ad spend to specific vehicle listings and measuring VDP views per model, trim, and price point
- Service department marketing ROI — tracking retention campaigns that bring sold customers back for service and parts purchases
Digital dealership ad waste is estimated at $48,000 annually per store without proper dashboard monitoring. Across the U.S., the total local automotive ad market is valued at $13.04 billion, meaning even a small percentage improvement in dashboard-driven optimization represents billions in recovered spend industry-wide.
Best Practices for Automotive Marketing Dashboards
Building an effective marketing dashboard for automotive retail requires balancing granularity with actionability. Based on industry data and dealer performance patterns, these practices consistently drive better outcomes for both single-location dealerships and multi-store groups:
- Consolidate data sources into a single dashboard — dealers using 3+ disconnected reporting tools miss 40–60% of cross-channel insights that only appear when data is unified
- Track lead-to-sale conversion, not just lead volume — the 11.7% industry benchmark from Foureyes provides a clear, measurable target for optimization
- Implement VIN-level attribution — connect marketing spend to actual vehicles sold using DMS integration platforms like Orbee
- Set real-time alerts for anomalies — dashboard alerts for CPL spikes, conversion drops, or budget pacing issues enable rapid response before performance degrades significantly
- Benchmark against industry KPIs monthly — use platforms like Foureyes or Dealer.com that provide competitive benchmarking from aggregated dealer data across your market area
- Include offline conversion data — phone calls, showroom visits, and service department interactions represent significant unmeasured touchpoints that inflate apparent CPL when excluded
- Review dashboard accuracy quarterly — attribution models drift over time as consumer behavior evolves and require recalibration against actual DMS sales data
For dealerships looking to implement these practices, growth marketing services can provide the strategic framework and technical implementation needed to build dashboards that actually drive revenue. The key is moving from passive reporting to active performance management where every dollar of ad spend is accountable to business outcomes.
Automotive vs. Other Industries: Analytics Adoption
Automotive marketing analytics adoption lags behind several other industries despite having one of the highest customer acquisition costs in consumer marketing. This comparison contextualizes where automotive stands relative to industries with more mature analytics practices:
| Industry | Avg. MarTech Depth | Attribution Adoption | Real-Time Dashboard |
|---|---|---|---|
| Automotive (Dealer) | 3.8 / 15 | 18–22% | 35% |
| E-commerce / DTC | 7.2 / 15 | 65–70% | 82% |
| SaaS / Technology | 8.5 / 15 | 72% | 88% |
| Financial Services | 6.1 / 15 | 55% | 67% |
| Healthcare | 4.3 / 15 | 28% | 41% |
The data reveals that automotive dealerships have the lowest MarTech stack depth among major industries, creating significant room for dashboard tool adoption and competitive differentiation. E-commerce brands, by contrast, have nearly 2× the stack depth and 3× the attribution model adoption rate, reflecting years of deeper investment in data maturity. For automotive businesses looking to close this gap, professional ad management combined with proper dashboard infrastructure can accelerate the journey from basic reporting to advanced analytics in months rather than years.
FAQ
What is the most important KPI for automotive marketing dashboards?
Lead-to-sale conversion rate is widely considered the most actionable KPI for dealership marketing dashboards. The current industry benchmark sits at 11.7% according to the Foureyes 2026 report, up from 10.2% the previous year. This metric directly connects marketing activity to revenue, unlike vanity metrics such as impressions or clicks. Pairing lead-to-sale conversion with cost per sale rather than cost per lead gives dealerships a complete picture of their marketing efficiency and identifies which channels produce buyers, not just leads.
Why do most dealerships underutilize marketing analytics?
With an average stack depth of 3.8 out of 15 categories, most dealerships lack the infrastructure to collect, unify, and visualize their marketing data effectively. Common barriers include vendor lock-in where each platform provides its own siloed reports, lack of in-house analytics talent, budget constraints, and the sheer complexity of automotive purchase journeys that span 62+ touchpoints over 95 days. Integrated dashboard solutions are specifically designed to solve these challenges by consolidating multiple data streams into a single, actionable view.
How much does a typical dealership spend on marketing annually?
The average U.S. dealership spends approximately $631,000 per year on marketing. The total U.S. local automotive ad market is valued at $13.04 billion. Without proper dashboard tracking and attribution, an estimated $48,000 per dealership goes to wasted ad spend annually — nearly 8% of the average marketing budget — making ROI dashboards a cost-saving investment rather than an additional expense.
What is multi-touch attribution and why does it matter for auto dealers?
Multi-touch attribution distributes credit for a sale across all the marketing touchpoints a buyer interacted with during their purchase journey, rather than giving 100% credit to the last click. Since 92% of auto sales cannot be traced to a single touchpoint, last-click models dramatically undervalue upper-funnel channels like display, video, and social media. Dealerships using multi-touch attribution dashboards report 2.3× faster market share growth and uncover 65% more incremental revenue from previously invisible channels.
How is AI changing automotive marketing dashboards?
AI is transforming automotive dashboards from passive reporting tools into predictive decision engines. The automotive data analytics market's 22.08% CAGR growth is largely driven by AI capabilities including predictive lead scoring, automated budget reallocation, anomaly detection, and natural language querying. Modern platforms can now match marketing exposure to actual vehicle purchases at the VIN level, enabling real-time optimization that was impossible with traditional static dashboards and manual reporting workflows.
Sources
GII Research — Global Automotive Data Analytics Market
DealerSignals — 2026 State of Dealer Technology
Foureyes — 2026 Automotive Dealer Benchmarks Report
PR Newswire — Fullpath Auto Intelligence Index Q2 2026
Future Market Insights — Automotive DMS Market
Keyloop — Measuring ROI in Automotive Retail
Orbee — Automotive Attribution & Measurement
Dealer.com — Performance Analytics Platform
Lifesight — Unified Marketing Measurement