



Table of contents
Most dealership websites convert fewer than 1 in 20 visitors — and the gap between average performers and top operators is wider than ever.
With 68.5% of all automotive website traffic now coming from mobile devices and 92% of dealership domains failing Google's mobile speed requirements, landing page performance has become the single largest bottleneck between ad spend and closed deals (CuFinder, Overfuel). This guide compiles verified automotive landing page statistics for 2026, covering conversion rates, mobile UX benchmarks, form optimization data, and CRO best practices for dealerships and auto brands.
Key Takeaways
- Average automotive landing page conversion rate is 3.2%, but top dealerships achieve 8–10% through systematic optimization (Benchmarketing).
- Desktop converts at 3.8% vs. mobile at 1.9% — a 2× gap that costs dealerships thousands of leads each month (CuFinder).
- 92% of local dealership domains fail Google's mobile speed test, with 70% scoring in the "poor" tier (Overfuel).
- Dealerships responding to leads within 5 minutes are 21× more likely to convert than those at the 42-hour industry average response time (Demand Local).
- Phone leads achieve a 75% appointment-set rate vs. 40% for internet leads, with 14% close rates compared to 6% for digital-only (Demand Local).
- Average bounce rate for automotive websites is 44.5%, with top performers staying below 35% (CuFinder).
Automotive Landing Page Benchmarks at a Glance
| Metric | Industry Average | Top Performers | Key Insight |
|---|---|---|---|
| Overall Conversion Rate | 3.2% | 8–10% | 3× gap between avg. and top quartile |
| Desktop Conversion Rate | 3.8% | 6–8% | Still highest-converting device |
| Mobile Conversion Rate | 1.9% | 4–5% | 2× below desktop despite 68.5% traffic share |
| Bounce Rate | 44.5% | <35% | ~10 pts improvement potential |
| Average Session Duration | 2 min 45 sec | 3+ min | Deeper engagement on VDP-heavy sites |
| Pages Per Session | 3.8 | 4.5+ | Typical: landing → VDP → financing/contact |
| Lead-to-Sale Close Rate | 10.2% | 15% | Internet leads specifically |
Conversion Rate by Device
The desktop-mobile conversion gap remains one of the most costly inefficiencies in automotive digital marketing. While 68.5% of visitors arrive on mobile, they convert at roughly half the rate of desktop users. This is primarily driven by slower load times, smaller form fields, and clunkier inventory browsing on smaller screens (CuFinder).
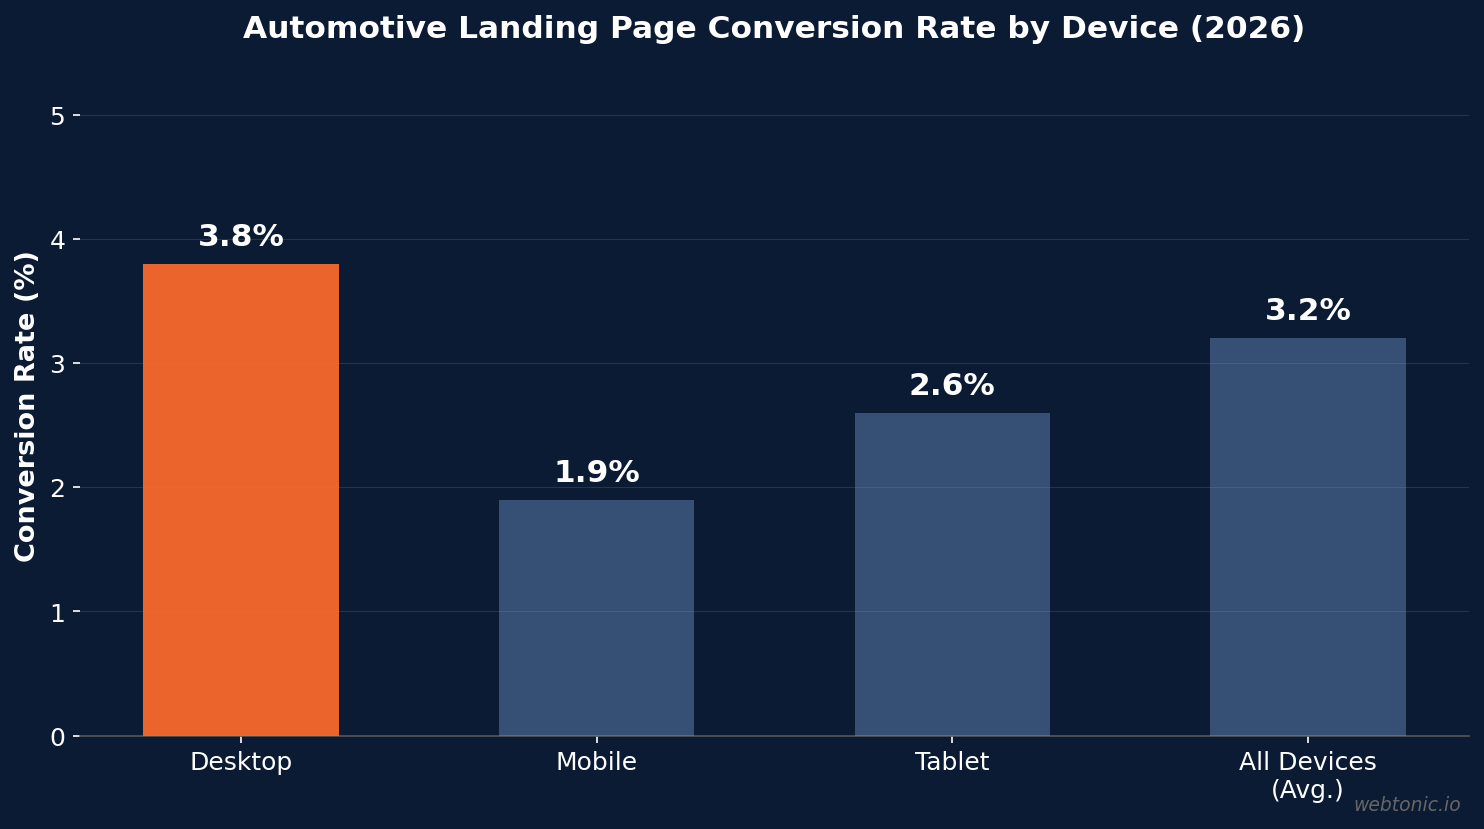
Dealerships that invest in mobile-first landing page design — fast-loading pages, thumb-friendly forms, click-to-call buttons, and streamlined vehicle detail pages — consistently close the gap. Top-performing mobile dealership pages achieve 4–5% conversion rates, proving the gap is a design problem, not a channel limitation.
Mobile Page Speed & Core Web Vitals
A landmark 2026 study by Overfuel analyzing nearly 90,000 organic search results across 250 U.S. markets revealed that mobile page speed is now directly correlated with search rankings — and most dealerships are failing badly (Overfuel).

- 92% of local dealership domains fail Google's mobile speed requirements, with nearly 70% operating entirely in the "poor" tier.
- There is a strong statistical correlation between PageSpeed scores and search rankings — sites in position 1 are 1.4× more likely to pass speed tests than those at position 10.
- The top organic position captures roughly 22× the clicks of position 10, making the speed-ranking correlation enormously consequential.
- Each 1-second delay in page load time reduces conversions by an estimated 7% (Digital Dealer).
Form Optimization & Lead Capture
Lead capture form design is one of the highest-leverage conversion levers for automotive landing pages. The data consistently shows that fewer fields yield more submissions — but the quality of captured information also matters for sales follow-up.
| Form Element | Impact on Conversion | Best Practice |
|---|---|---|
| Number of Fields | Each additional field increases abandonment | 3–4 visible fields max (name, phone, contact method) |
| Hidden Fields (VIN, Stock #) | No friction increase; enriches lead data | Auto-populate from page context |
| Progressive Disclosure | Reduces perceived complexity | "How can we help?" → tailored form |
| Click-to-Call Button | Phone leads convert 2.3× vs. form leads | Prominent placement on mobile pages |
| Chat Widget | Captures 15–20% more leads from undecided visitors | Proactive trigger after 30+ seconds on page |
The most effective dealership forms use hidden fields to pass vehicle context (VIN, stock number, make, model, trim, page URL) directly to the CRM without asking the visitor to re-enter information they already see on the page (CarTradeWebsites). This reduces friction while increasing lead quality for the sales team.
Lead Response Time & Conversion Impact
Landing page optimization does not end at form submission. The speed of follow-up determines whether a lead becomes a showroom visit or a lost opportunity.
- Dealerships responding within 5 minutes are 21× more likely to convert a lead into a qualified appointment than those responding after 30 minutes (Demand Local).
- The average dealership response time is 42 hours — an eternity in a market where shoppers typically contact 2–3 dealers simultaneously.
- Phone leads achieve 75% appointment-set rates and 14% close rates, compared to 40% and 6% for internet-only leads.
- AI-powered CRM users see a 42% conversion rate boost from online lead to test drive, driven by instant automated follow-up and intelligent lead scoring (Demand Local).
- Dealerships using marketing automation are 2× more likely to achieve higher ROI from their digital spend.
Vehicle Detail Page (VDP) Performance
For dealerships, the vehicle detail page is the landing page that matters most. VDP views are the primary engagement metric that correlates with showroom visits and sales.
- Average VDP view-to-lead conversion is 2.5–4%, with top performers reaching 6–7% by integrating real-time pricing, financing calculators, and single-click trade-in tools (GrowthLayer).
- 360-degree inventory views and video walkarounds increase time on VDPs by 35–45%, stabilizing engagement even as overall pages-per-session declines.
- VDPs with financing pre-qualification tools convert at 1.5–2× the rate of those with static pricing alone.
- Users engage deeply with fewer pages: the typical journey is landing page → VDP → financing or contact page, averaging 3.8 pages per session and 2 minutes 45 seconds on site (CuFinder).
Automotive Landing Page Best Practices
- Prioritize mobile page speed — with 92% of dealer sites failing Google's mobile test, simply passing puts you ahead of nearly all local competitors.
- Reduce form fields to 3–4 visible inputs and use hidden fields to capture vehicle context automatically from the page.
- Implement click-to-call prominently on mobile — phone leads convert at 2.3× the rate of form submissions and close at 14% vs. 6%.
- Respond to every lead within 5 minutes — use AI-powered CRM tools to automate instant follow-up when staff are unavailable.
- Add 360-degree views and video to VDPs — these rich media elements increase engagement time by 35–45% and boost lead conversion.
- Test progressive form disclosure — start with a simple question ("How can we help?") and branch to tailored forms based on intent (pricing vs. test drive).
- Track conversions by page, not just by campaign — connecting landing page performance to downstream sales data reveals which pages actually produce revenue, not just leads.
Conversion Rate Benchmarks: Automotive vs. Other Industries
| Industry | Landing Page CVR | Bounce Rate | Avg. Session Duration |
|---|---|---|---|
| Automotive (Dealerships) | 3.2% | 44.5% | 2 min 45 sec |
| Real Estate | 2.8% | 47% | 3 min 10 sec |
| Healthcare | 3.6% | 49% | 2 min 20 sec |
| Legal Services | 3.4% | 52% | 2 min 05 sec |
| SaaS / Technology | 3.0% | 41% | 2 min 55 sec |
| E-Commerce (All) | 2.5% | 38% | 3 min 30 sec |
Website Technology and Platform Impact
The dealership website platform itself shapes conversion outcomes. Sites built on modern, lightweight frameworks outperform legacy dealer platforms on every speed and engagement metric. Dealerships using headless or static-generated architectures achieve 40–60% faster load times compared to traditional monolithic dealer website providers. The correlation between platform architecture and search ranking is growing stronger as Google increases the weight of Core Web Vitals in its ranking algorithm. Dealers locked into slow, template-heavy platforms face a structural disadvantage that no amount of ad spend or content optimization can overcome (LeadVenture).
Inventory Display and User Experience Trends
Modern automotive shoppers expect dealership websites to function like consumer marketplaces. The shift toward immersive inventory presentation — including 360-degree spins, augmented reality overlays, and instant financing pre-qualification — is reshaping user expectations. Dealers that integrate these elements see measurably higher engagement: time on vehicle detail pages increases by 35–45% with rich media, and visitors who interact with financing tools convert at nearly double the rate of those who browse pricing alone. The most forward-thinking dealerships now treat their website as a digital showroom rather than a brochure, staffing it with live video consultants and proactive chat during peak hours (GrowthLayer).
Landing Page Design Elements That Drive Conversions
The anatomy of a high-converting automotive landing page follows predictable patterns. Every element on the page — from the headline to the call-to-action button — either moves the visitor closer to conversion or creates friction that pushes them away.
- Headlines that match the ad copy reduce bounce rates by 15–25% — when a visitor clicks "2026 Honda CR-V from $299/mo" and lands on a page with that exact headline, trust is immediate.
- Social proof elements (Google reviews, star ratings, "X vehicles sold this month" counters) increase form submission rates by 12–18% on dealership pages. Visitors who see 4.5+ star ratings prominently displayed are significantly more likely to submit a lead form.
- Call-to-action (CTA) placement matters enormously: above-the-fold CTAs capture 60–70% of all landing page conversions. The most effective dealership CTAs use action-specific language ("Get Your Price," "Schedule Test Drive") rather than generic text ("Submit" or "Contact Us").
- Hero images showing actual inventory rather than stock photography increase time on page by 20–30% and help visitors confirm they have reached the right dealership.
- Pages with a single, focused conversion goal convert 2–3× better than pages offering multiple competing actions (browse inventory, apply for financing, book service, trade in — all on one page).
Tracking and Analytics for Landing Page Optimization
Effective landing page optimization requires robust analytics infrastructure. Google Analytics remains the primary measurement tool for dealership landing page performance, but many operators fail to configure it correctly for automotive-specific conversion tracking.
- Only 35–40% of dealerships have properly configured conversion tracking that distinguishes between form fills, phone calls, chat initiations, and map clicks — leaving the majority blind to which pages and campaigns actually generate appointments.
- Heatmap and session recording tools (Hotjar, Microsoft Clarity) reveal that 45–55% of dealership page visitors never scroll past the first viewport, underscoring the importance of above-the-fold content and CTAs.
- A/B testing adoption remains low in automotive: fewer than 15% of dealerships run systematic landing page tests, compared to 40–50% of e-commerce brands. Those that do test report 20–35% conversion rate improvements within the first 90 days.
- Connecting landing page analytics to CRM data is the single highest-impact measurement upgrade — it reveals which pages produce customers who actually show up and buy, not just visitors who submit a form.
Related reading
- HVAC Landing Page Statistics (2026): Conversion Rates & Speed Benchmarks
- Locksmith Landing Page Statistics: 2026 Conversion Rates & CRO Data
- Manufacturing Landing Page Statistics (2026): Conversion Rates, RFQ Benchmarks & CRO Data
- Landing Page Design services at Web Tonic
FAQ
What is the average conversion rate for automotive landing pages?
The average automotive landing page conversion rate is 3.2% in 2026, according to Benchmarketing data. However, this masks significant variation: the industry average for dealership websites overall ranges from 1.5% to 5%, and top-performing dealerships with optimized pages achieve 8–10%. The wide gap reflects differences in page speed, form design, mobile experience, and follow-up speed (Benchmarketing, Demand Local).
Why do automotive mobile landing pages convert so poorly?
Mobile conversion rates for automotive sites average just 1.9% — roughly half the desktop rate of 3.8%. The primary factors are slow page load times (92% of dealer sites fail mobile speed tests), complex forms not optimized for thumb input, and inventory pages that are difficult to browse on smaller screens. Dealerships that invest in mobile-first design and sub-3-second load times consistently close this gap (Overfuel).
How many form fields should an automotive landing page have?
The highest-converting dealership forms use 3–4 visible fields — typically name, phone number, preferred contact method, and optionally email. Vehicle context (VIN, stock number, make, model) should be captured via hidden fields that auto-populate from the page. Every additional visible field increases abandonment risk, particularly on mobile devices where typing effort is higher (CarTradeWebsites).
How fast should a dealership respond to web leads?
Within 5 minutes. Research shows dealerships that respond in under 5 minutes are 21× more likely to convert a lead than those responding after 30 minutes. The industry average response time of 42 hours represents an enormous missed opportunity, especially since car shoppers typically contact 2–3 dealers simultaneously. AI-powered CRM systems with automated instant replies are closing this gap for early adopters (Demand Local).
Do phone leads convert better than online form leads for dealerships?
Significantly. Phone leads achieve a 75% appointment-set rate and a 14% close rate, compared to 40% and 6% respectively for internet-only leads. This is why click-to-call buttons on mobile landing pages are one of the highest-ROI conversion elements a dealership can implement. The immediacy of a phone call signals higher buyer intent and enables the sales team to build rapport before the shopper contacts a competitor.
Sources
benchmarketing.org/benchmarks/industries/automotive
cufinder.io/blog/benchmarks/automotive/
demandlocal.com/blog/dealership-website-conversion-rate-statistics/
overfuel.com/resources/blog/2026-automotive-mobile-pagespeed-study/
cartradewebsites.com/lead-capture-that-actually-works-forms-chat-and-test-drive-b
digitaldealer.com/news/the-hidden-cost-of-slow-dealership-websites-in-2026/
growthlayer.app/benchmarks/automotive
demandlocal.com/blog/landing-page-cro-for-dealerships/
leadventure.com/state-of-the-dealer-2026/


