



Table of contents
Manufacturing Landing Page Statistics (2026)
Manufacturing landing pages convert at 2.1–2.6% on average, but dedicated campaign pages with clear CTAs regularly exceed 6.6%. Below are 65+ verified benchmarks covering conversion rates, RFQ form performance, A/B testing impact, mobile optimization, and CRO strategies for industrial and B2B manufacturing websites.
Key Takeaways
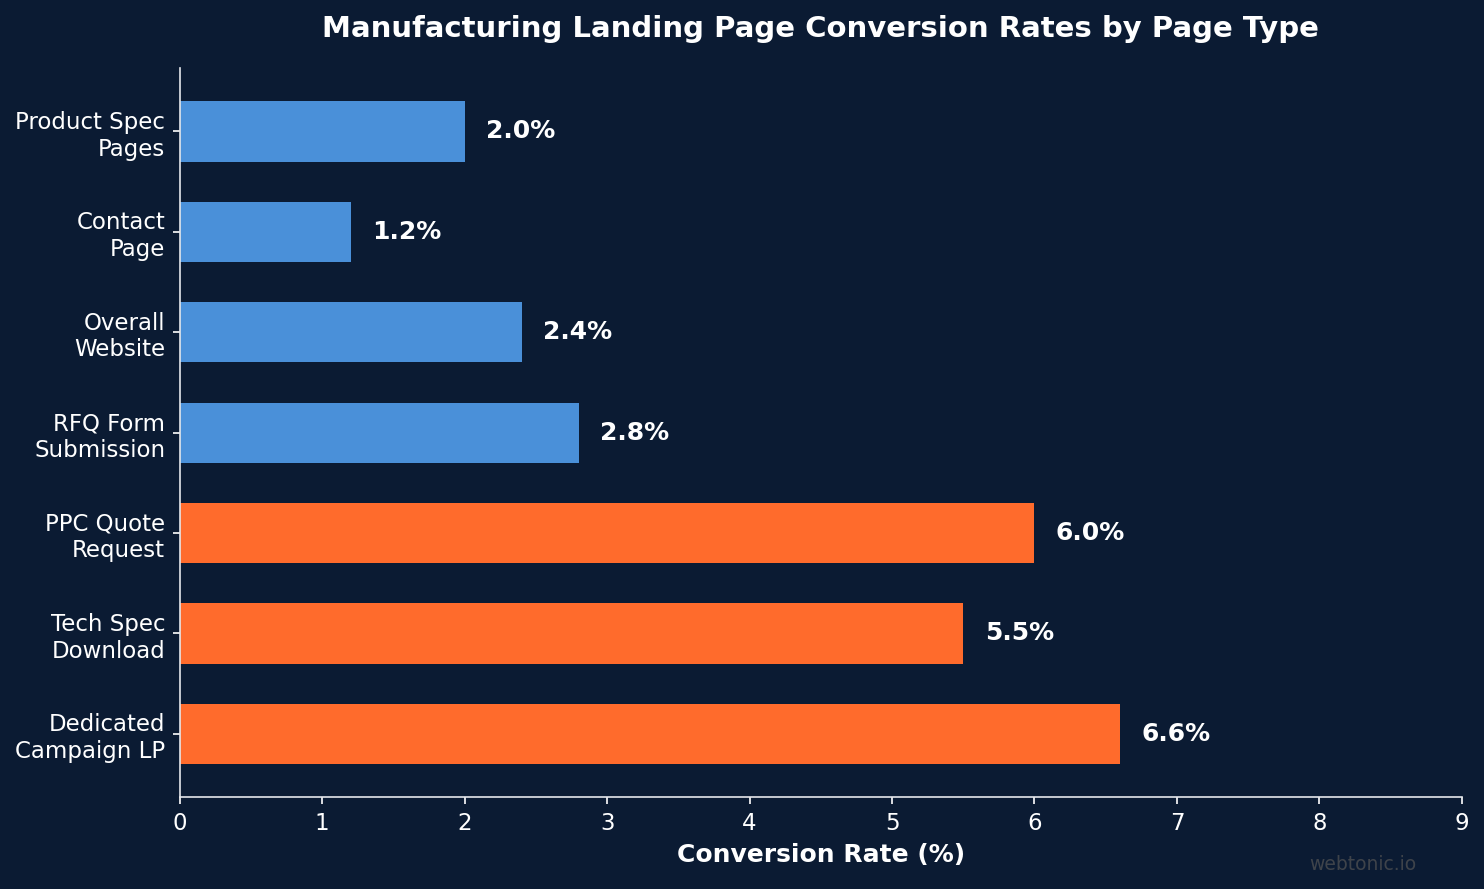
- Manufacturing website conversion rate averages 2.2% across all page types, with RFQ-specific pages converting at 2.8% and technical spec downloads at 5.5%. (CuFinder)
- Median landing page CVR across industries is 6.6% per Unbounce's benchmark data — dedicated manufacturing campaign pages should aim to match or beat this target. (ManufacturingLeadGeneration)
- Instant scheduling boosts form-to-meeting conversion from 30% to 66.7% — letting prospects book immediately after submitting an RFQ form more than doubles follow-through. (ManufacturingLeadGeneration)
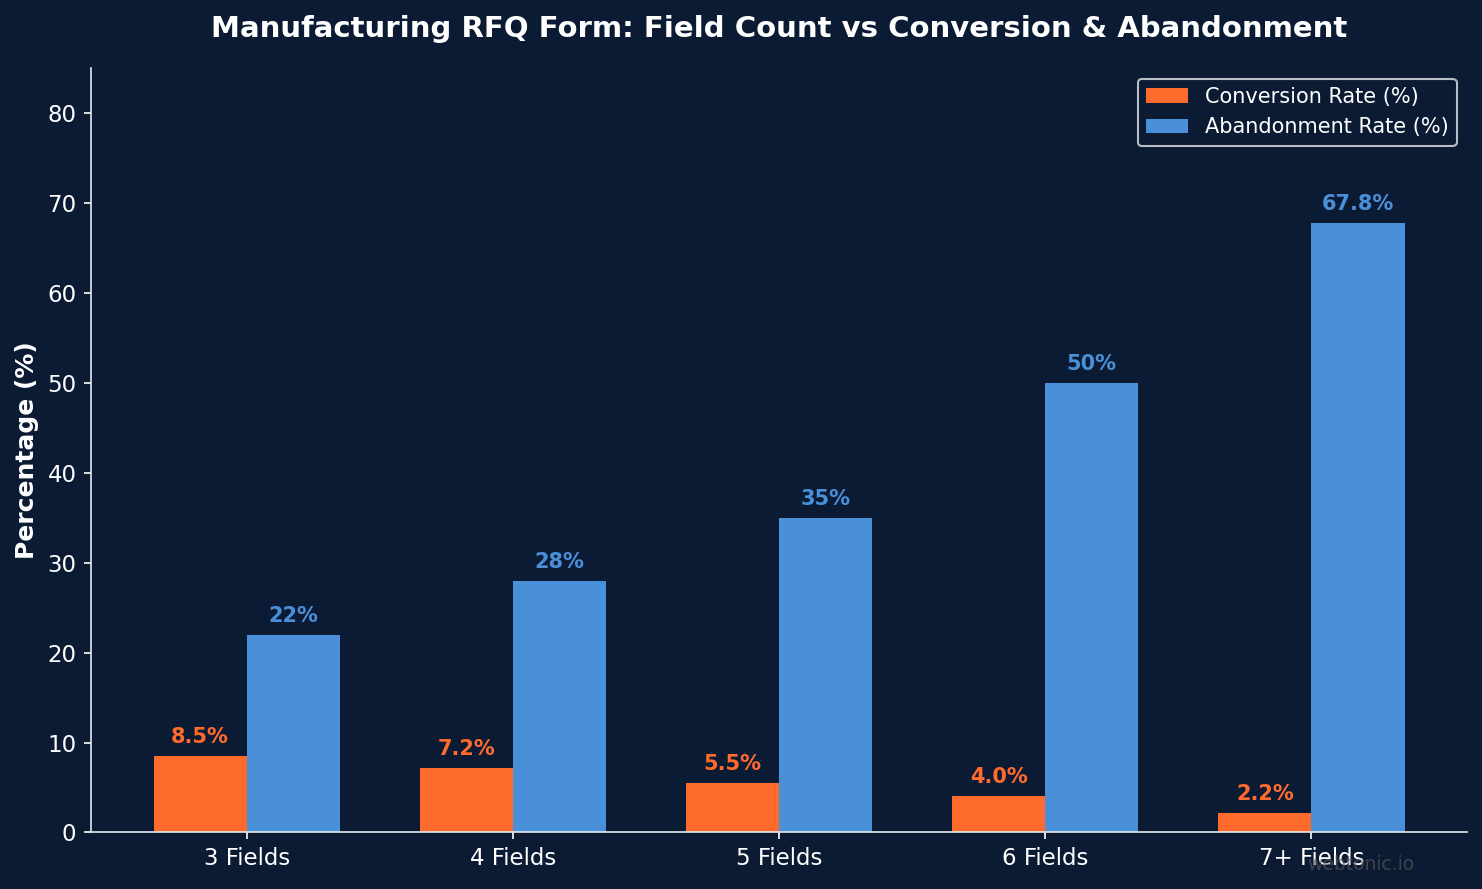
- Forms exceeding 7 fields see 67.8% abandonment, while reducing from 5+ to 3–4 fields lifts conversion rates by approximately 30%. (ManufacturingLeadGeneration)
- An enterprise manufacturer grew conversions 289% while cutting ad spend 46% by pairing tiered conversion-value bidding with CRO-optimized landing pages. (MfgWebDesign)
Manufacturing Landing Page Benchmarks at a Glance
| Metric | Manufacturing Benchmark | All-Industry Median |
|---|---|---|
| Overall Website CVR | 2.2–2.6% | 3.3% |
| RFQ Form Submission Rate | 2.8% | 3.5% |
| Tech Spec Download CVR | 5.5% | 4.2% |
| Contact Page Submission | 1.2% | 2.1% |
| Dedicated LP CVR Target | 6.6%+ | 6.6% |
| Quote Request Pages (PPC) | 4–8% | 5.2% |
| Product Spec Pages | 1–3% | 2.5% |
| Form-to-Meeting Rate | 30–66.7% | 40% |
| Bounce Rate (Overall) | 54.5% | 47% |
| Mobile Bounce Rate | 61.2% | 53% |
Sources: CuFinder 2026, ManufacturingLeadGeneration, LowCode Agency, Boom Qosmos
RFQ and Lead Form Performance Benchmarks
Request-for-quote pages are the primary conversion mechanism for most manufacturers. The data shows a clear relationship between form length, response speed, and ultimately whether a form fill turns into a sales conversation.
| Form Metric | Benchmark | Impact |
|---|---|---|
| Optimal Field Count | 3–5 fields | 30% higher CVR vs 5+ fields |
| 7+ Field Abandonment | 67.8% | Critical drop-off threshold |
| File Upload on RFQ | Recommended | Self-qualifies engineering leads |
| Instant Scheduling CVR | 66.7% | 2.2× vs generic thank-you page |
| Without Instant Booking | 30% | Baseline form-to-meeting rate |
| Lead Response Under 5 Min | 391% lift | vs next-morning follow-up |
| Response Within 1 Hour | 7× qualification lift | Harvard Business Review data |
| Multi-Step RFQ Portal | 3–5× CVR | vs single-page contact form |
Manufacturing RFQ forms should include name, work email, company, phone, process needed, and optional file upload. Adding material type, target tolerance, expected annual volume, and lead time as optional fields can self-qualify leads without adding friction for early-stage prospects. (Manufacturing SEO Agency)
Speed matters enormously in manufacturing lead conversion. Responding within the first minute can increase conversions by 391%, and firms that reply within an hour are nearly 7× more likely to qualify a lead than those waiting longer. For manufacturers selling CNC machining, custom fabrication, or contract manufacturing, the benchmark should be median first-response time under five minutes during business hours. (ManufacturingLeadGeneration)
Conversion Rate Breakdown by Page Type
Not all manufacturing pages convert at the same rate. Understanding where visitors convert — and where they drop off — helps teams allocate CRO effort where it matters most.
- Overall manufacturing website CVR: 2.2% per First Page Sage data, confirmed by CuFinder at 2.6%. Use this as the floor for overall site performance. (First Page Sage)
- Dedicated campaign landing pages: target 6.6%+. Unbounce's benchmark data shows the median across industries sits at 6.6%, with Google Ads traffic on focused pages consistently outperforming site-wide averages.
- Quote request pages (PPC traffic): 4–8% for manufacturing. These pages benefit from single-intent design with a clear CTA and minimal navigation. (LowCode Agency)
- Product specification pages: 1–3%. Visitors here are research-mode engineers comparing vendors — conversion typically happens on a second or third visit. (LowCode Agency)
- B2B SEO conversion rate: 2.6% for organic landing pages, application guides, and capability pages. (ManufacturingLeadGeneration)
- PCB Design and Manufacturing: 1.1% — one of the lowest manufacturing sub-verticals due to ultra-specialized audiences and long evaluation cycles. (First Page Sage)
Mobile Optimization and Page Speed Impact
While desktop still dominates manufacturing web traffic at 56.4%, mobile's 39.2% share is surging fast. Plant managers, maintenance supervisors, and procurement teams increasingly begin supplier research on mobile devices — during commutes, on the shop floor, or between meetings.
| Mobile Metric | Manufacturing Data | Impact |
|---|---|---|
| Desktop Traffic Share | 56.4% | Still primary decision device |
| Mobile Traffic Share | 39.2% | Fastest-growing segment |
| Tablet Traffic Share | 4.4% | Shop-floor reference use |
| Mobile Bounce Rate | 61.2% | vs 54.5% overall |
| 1s→10s Load Time | 123% bounce increase | Google mobile speed research |
| Target Money Page Load | Under 3 seconds | Quote forms, process pages |
| 400→6,000 Page Elements | 95% CVR drop | Bloated scripts and PDFs |
Source: CuFinder 2026, ManufacturingLeadGeneration
The practical benchmark for manufacturers: keep quote forms, process pages, and high-value blog landing pages under three seconds on mobile. Giant hero images, bloated scripts, and oversized PDF downloads on capability pages are the most common speed killers in the sector.
CRO Case Studies in Manufacturing
Real-world case studies show what becomes possible when manufacturers invest in structured data-driven landing page optimization.
- Enterprise industrial equipment manufacturer: 289% conversion growth while cutting ad spend by 46%. The key was training bidding algorithms with tiered conversion values and building dedicated landing pages per buyer segment (excluding off-the-shelf buyers). (MfgWebDesign)
- Multi-step RFQ portals convert 3–5× better than single-page contact forms. Corporate-email gating on CAD downloads self-qualifies buyers before they reach estimators, reducing wasted engineering time. (Connascent)
- Manufacturers with 15% to 20% mobile traffic share that optimize mobile landing pages see the largest marginal gains — these visitors are often the most urgent buyers (searching from the shop floor for emergency replacement parts or services). (ManufacturingLeadGeneration)
- B2B landing pages outperform B2C in aggregate benchmark datasets (13.3% vs 9.9%), driven by higher-intent, more-specific search queries. Manufacturing sits below this B2B average because of longer sales cycles, but focused campaign pages close the gap. (Boom Qosmos)
Landing Page Best Practices for Manufacturers
Data from CuFinder, ManufacturingLeadGeneration, and LowCode Agency points to a consistent set of CRO principles that move manufacturing pages from sub-2% to the 5–8% range:
- Single-intent page design: one CTA per page, matching the ad or keyword promise exactly. Message mismatch is the #1 reason paid traffic fails to convert on manufacturing sites.
- RFQ forms with 3–5 fields max: name, work email, company, phone, and process/capability needed. Optional fields for material, tolerance, and volume let serious buyers self-qualify.
- Instant scheduling integration: embed a calendar booking widget on the thank-you page to capture 66.7% form-to-meeting conversion instead of the 30% baseline.
- Sub-3-second mobile load: compress hero images, defer non-critical scripts, and replace PDF spec sheets with HTML tables that load instantly.
- Social proof from the industry: certifications (ISO 9001, AS9100, ITAR), client logos, and case studies with specific metrics (cost savings, lead times, tolerances achieved) convert better than generic testimonials.
- Lead response under 5 minutes: automated confirmation plus sales team response within 5 minutes during business hours — 391% conversion lift versus next-morning follow-up.
- Process-specific pages: a CNC machining landing page should not share a URL with injection molding. Engineers search by process, and dedicated pages allow precise keyword–content–CTA alignment.
Manufacturing CRO vs Other B2B Industries
| Industry | Website CVR | Top Quartile | Key CRO Challenge |
|---|---|---|---|
| Manufacturing | 2.1–2.6% | 6–8% | Long sales cycles, spec-heavy research |
| B2B SaaS | 1.5–3.0% | 8–15% | Free trial vs demo friction |
| Professional Services | 3.0–8.0% | 12–20% | Trust and differentiation |
| B2B eCommerce | 1.8–3.0% | 5–8% | Catalog complexity |
| PCB Design/Mfg | 1.1% | 3–5% | Ultra-specialized audience |
Sources: First Page Sage, Boom Qosmos
A/B Testing and Optimization Data for Manufacturing
Structured CRO programs deliver measurable gains for manufacturing websites, but the sector lags behind B2B SaaS and eCommerce in testing adoption. Key data points for manufacturers considering A/B testing programs:
- Top-performing landing pages (top 10%) convert above 11% — roughly 3× the broad cross-industry average of 4–5%, confirming that systematic testing can lift manufacturing pages well beyond the 2.2% baseline. (Boom Qosmos)
- Sub-1% conversion rate is a diagnostic red flag, not a small optimization opportunity. It typically signals message mismatch (ad/keyword promise ≠ page content), excessive friction, or missing trust signals like certifications and client logos. (Boom Qosmos)
- CMS adoption among manufacturers remains low: many industrial websites still run on legacy platforms with limited A/B testing capability. Moving to a modern CMS with built-in experimentation tools is often the prerequisite for any serious CRO program.
- Unbounce reports median LP CVR of 6.6% — the benchmark that separates "needs work" from "performing." Manufacturing teams running Google Ads PPC campaigns should compare their dedicated landing page CVR against this number, not against their overall site average.
Engagement and Traffic Quality Metrics
Conversion rate alone does not tell the full story. Manufacturing analytics teams should also track engagement metrics that signal whether landing page traffic is qualified:
- Pages per session: 3.8 across manufacturing sites, indicating visitors explore multiple capability pages before converting. (CuFinder)
- Average time on page: 2 minutes 15 seconds — significantly above the 52-second all-industry average, reflecting the research-heavy nature of industrial buying. (CuFinder)
- Organic search drives 48.5% of manufacturing site traffic globally, with paid search contributing 18% in the U.S. (CuFinder)
- Monthly unique visitors for manufacturing SMEs: 4,500–12,000, providing a baseline for traffic expectations before CRO optimization begins. (CuFinder)
Frequently Asked Questions
What is a good landing page conversion rate for manufacturing companies?
A good manufacturing landing page conversion rate depends on the page type. For overall website performance, 2.2–2.6% is the industry baseline. Dedicated campaign landing pages with single-intent design should target 6.6% or higher, matching the cross-industry median from Unbounce's benchmark data. Quote-request pages receiving PPC traffic typically achieve 4–8% when properly optimized with short forms and strong CTAs.
How many form fields should an RFQ page have?
Keep RFQ forms to 3–5 required fields: name, work email, company name, phone number, and the process or capability needed. Forms exceeding 7 fields experience 67.8% abandonment rates. Optional fields for material type, target tolerance, and expected annual volume let serious buyers self-qualify without adding friction for early-stage prospects.
How fast should manufacturers respond to landing page leads?
Under five minutes during business hours is the benchmark. Research shows that responding within the first minute increases conversions by 391%, and firms replying within one hour are 7× more likely to qualify a lead than those waiting longer. Automated confirmation emails plus CRM alerts help manufacturing teams hit this target.
Does mobile optimization matter for manufacturing landing pages?
Yes. Mobile now accounts for 39.2% of manufacturing web traffic, up significantly year over year. Mobile bounce rates run at 61.2% compared to 54.5% overall. As page load time increases from 1 to 10 seconds, bounce probability rises 123%. The target for key landing pages is sub-3-second mobile load time.
What is the average CPA for manufacturing landing pages?
Manufacturing Google Ads search CPA averages $135, with display CPA at $85. The overall cost per qualified manufacturing lead ranges from $79–$135 depending on channel, but CRO-optimized landing pages can cut these costs dramatically — one case study showed a 289% conversion increase while reducing ad spend 46%.
Sources
https://cufinder.io/blog/benchmarks/specialized-manufacturing/
https://manufacturingleadgeneration.com/proven-manufacturing-website-conversion-benchmarks/
https://manufacturingleadgeneration.com/manufacturing-lead-generation-statistics/
https://manufacturingleadgeneration.com/rfq-page-optimization-manufacturers/
https://mfgwebdesign.com/blog/manufacturing-website-lead-generation-benchmarks
https://manufacturing-seo.agency/blog/improve-manufacturing-website-conversion-rate
https://firstpagesage.com/seo-blog/b2b-landing-page-conversion-rates/
https://www.lowcode.agency/blog/b2b-website-conversion-rate-benchmarks-and-how-to-beat-them
https://boom.qosmos.ai/blog/landing-page-conversion-rate-statistics-by-industry-2026-data-and-benchmarks
https://connascent.com/blog/manufacturing-seo-guide-2026


