



Table of contents

Quick answer: Optimise on 7-day click for most ecommerce and lead gen, add 1-day view only for high-consideration or app products, and report to finance on blended revenue over total spend. Changing the window changes the number, never the sales.
Last verified: 2026-08-21
What a window is and is not
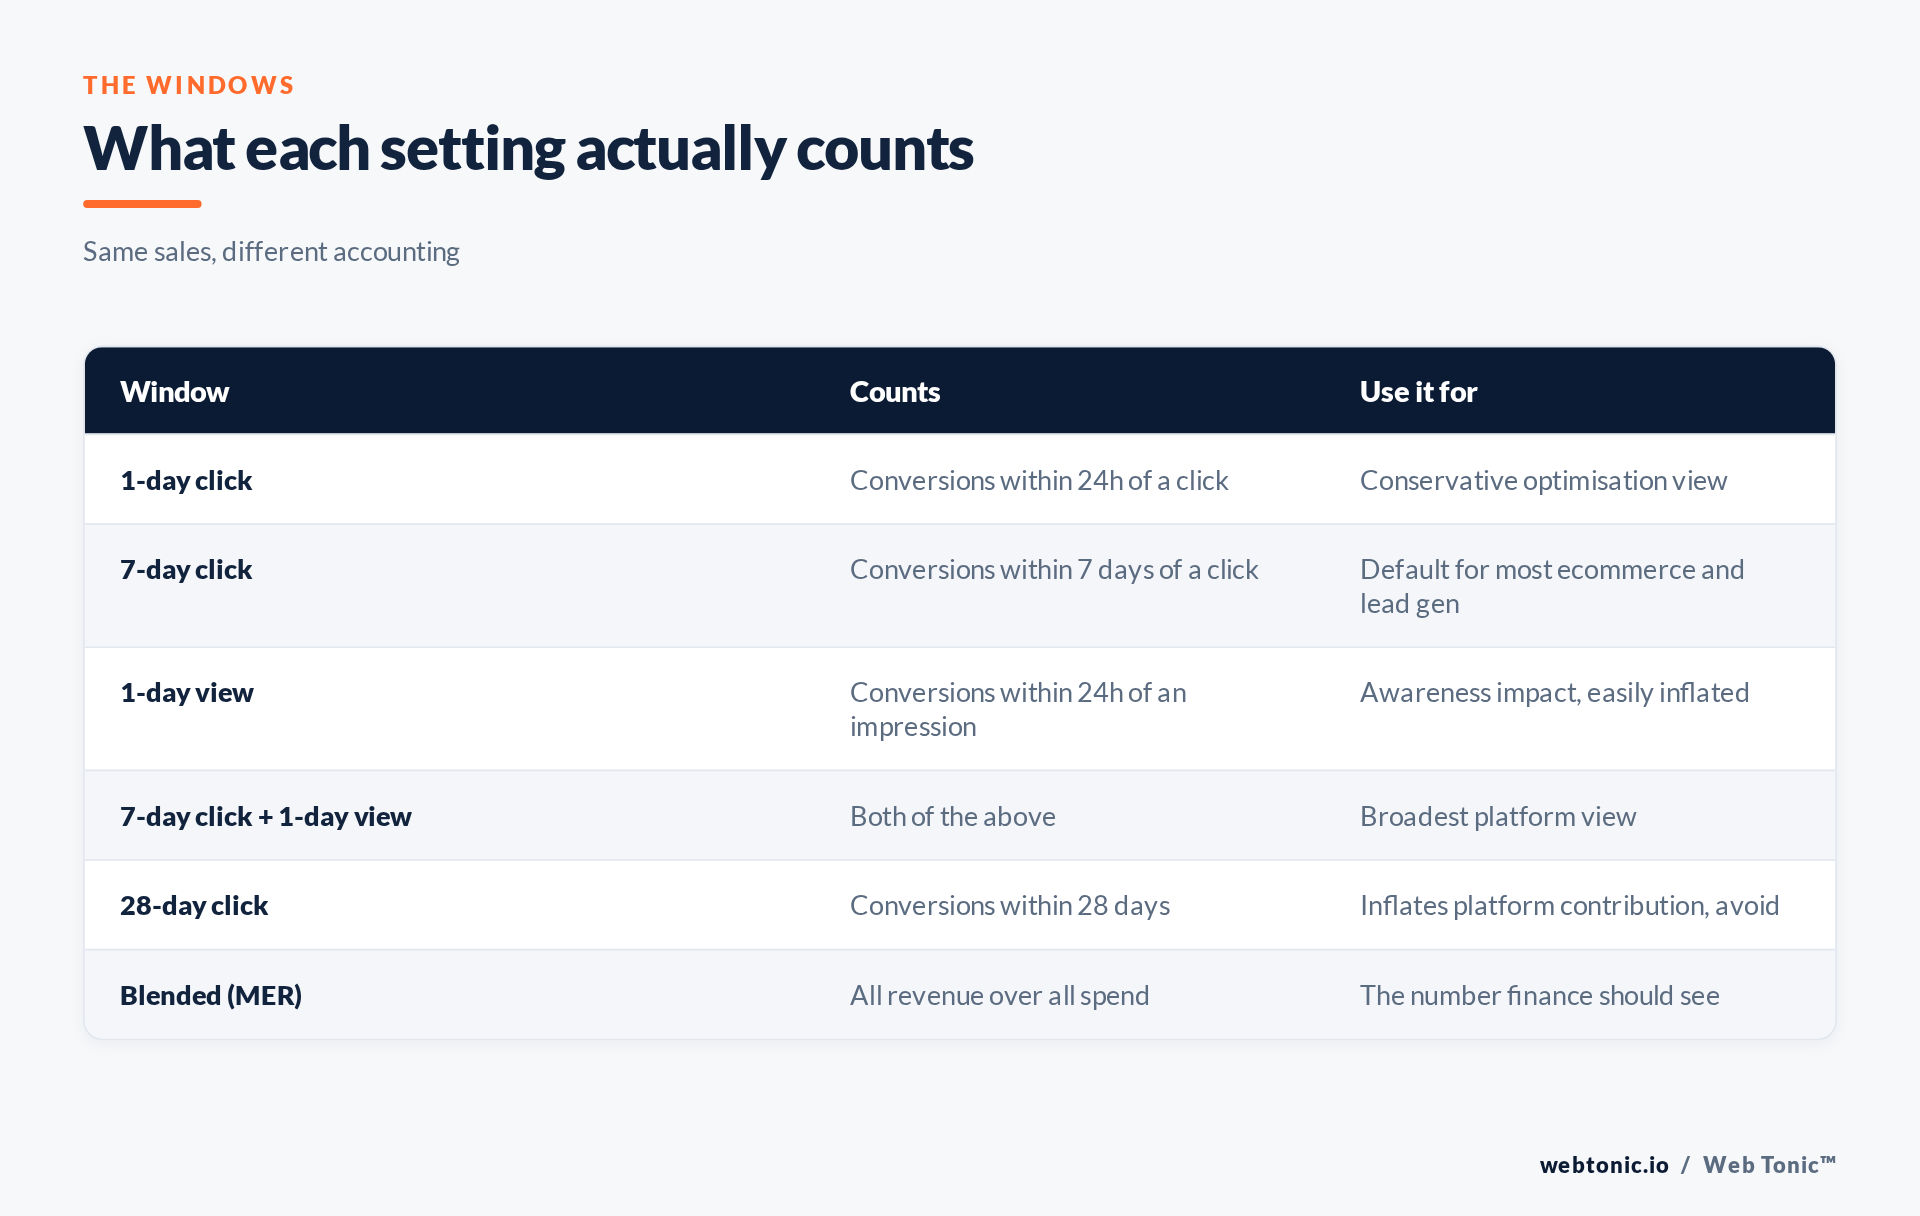
An attribution window is a rule for assigning credit, not a measurement of causation. A 7-day click window says: if someone clicked the ad and converted within seven days, count it here. A 1-day view window says: if someone saw the ad, did not click, and converted within a day, count it here too. The underlying purchases are identical in both cases. Only the bookkeeping changes.
This is why window arguments get heated and go nowhere. Switching from 7-day click to 7-day click plus 1-day view can lift reported conversions substantially overnight while the bank balance does not move at all. Anyone reporting that jump as growth is reporting an accounting change. The general problem is old and well documented under marketing attribution.
View-through credit deserves particular scepticism. An impression is not an engagement, and a share of view-attributed conversions would have happened anyway — people who were already going to buy also happen to scroll past ads. It is not worthless, but it is the least defensible currency to hand a finance team.
Choosing the window you optimise on
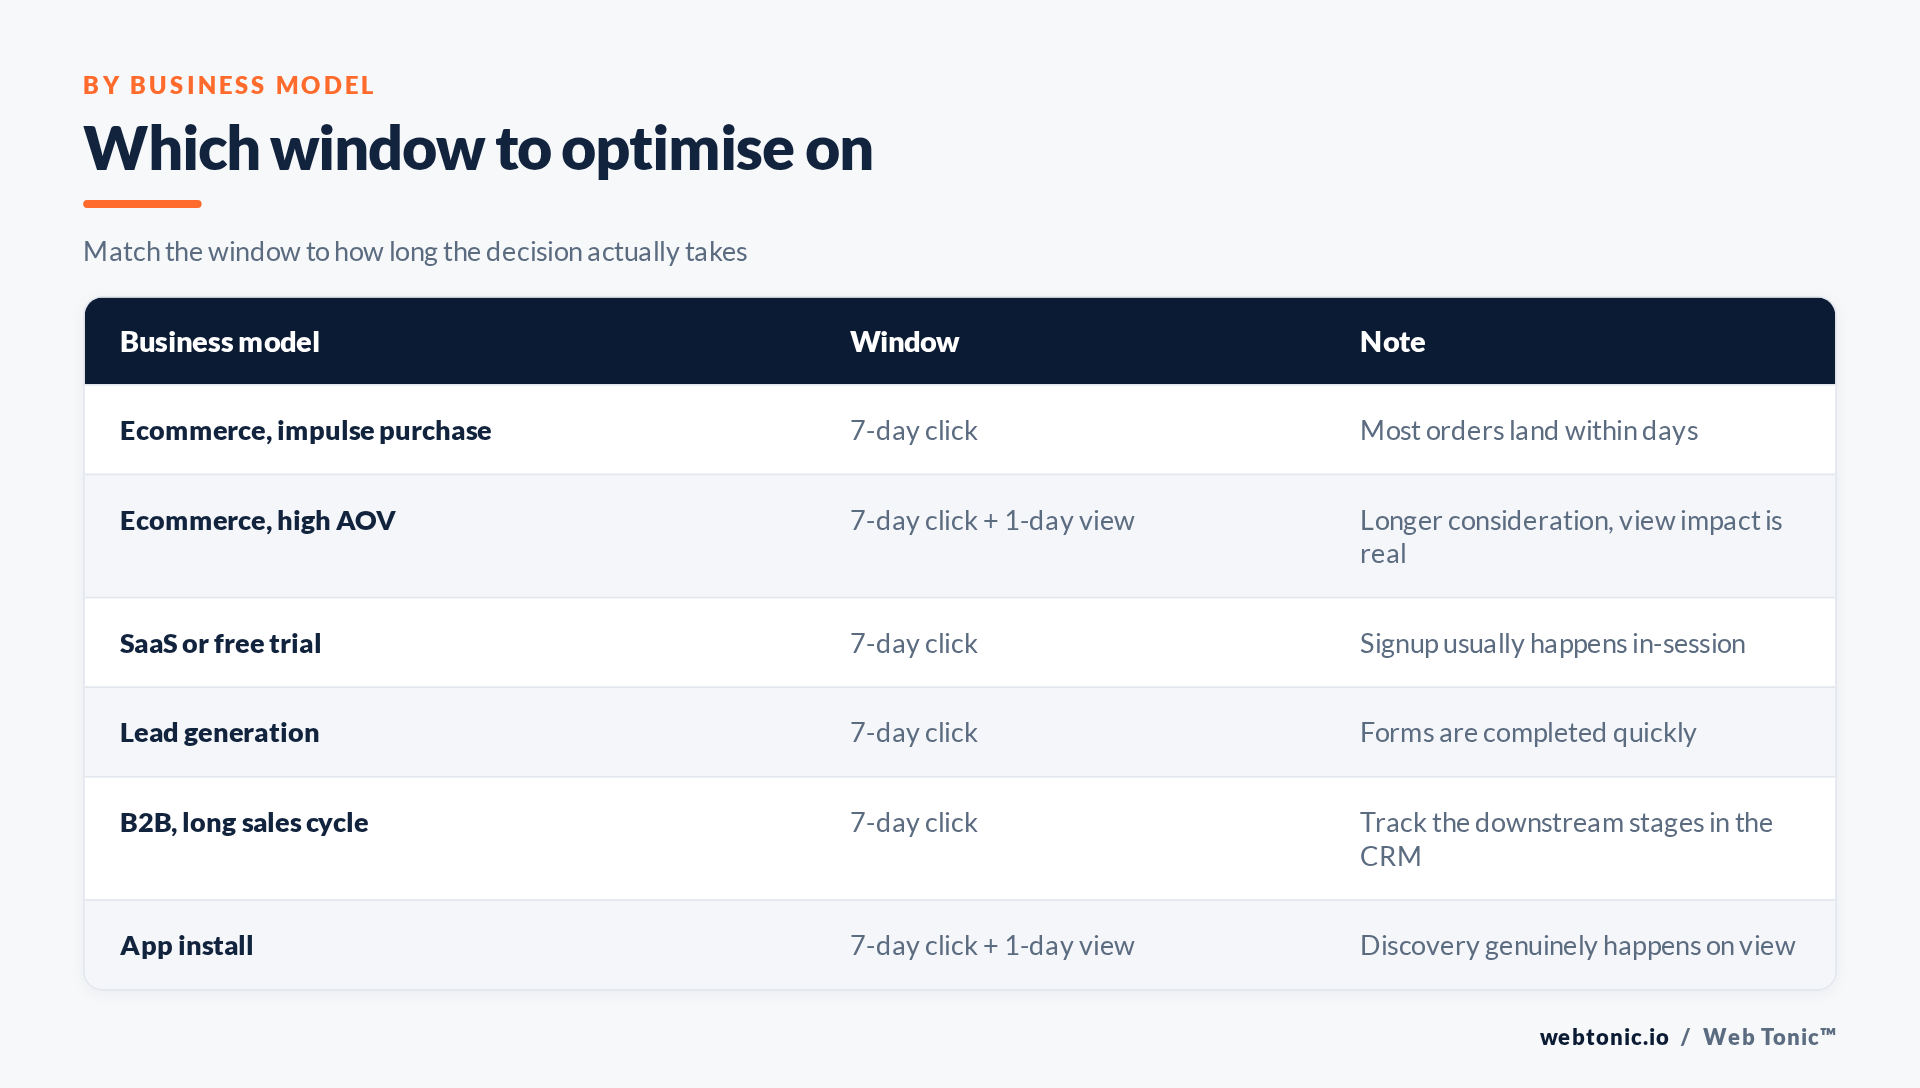
- Measure how long your purchase decision really takes. Compare 1-day click against 7-day click conversions for the same period. If 7-day is barely higher, your customers decide fast and a short window loses nothing.
- Treat a very large gap as a warning. If 7-day click is three or more times 1-day click, a meaningful share of that credit is delayed activity you may not have caused.
- Add 1-day view only with a reason. High average order value, considered purchases and app discovery justify it. Everyday ecommerce mostly does not.
- Avoid 28-day click. It flatters the channel and makes cross-channel reconciliation nearly impossible.
- Keep the window fixed while you judge anything else. Changing the window mid-test invalidates every before-and-after comparison in the account.
- Document the window on every report. A ROAS figure without its window is an unlabelled unit.
| Decision | Recommendation | Reason |
|---|---|---|
| Default optimisation window | 7-day click | Enough data without excessive credit |
| Conservative internal view | 1-day click | Closest to observable causation |
| Adding view-through | Only for high AOV or apps | Otherwise inflates the channel |
| Board or finance reporting | Blended revenue over spend | Cannot double-count across channels |
| Comparing platforms | Never compare raw platform numbers | Each uses its own rules |
| Changing the window | Annotate the date, keep both series | Otherwise the trend line lies |
Why the same sale gets counted twice
Every ad platform runs its own attribution in isolation, using only the touchpoints it can observe. A buyer who saw a Meta ad on Monday, searched the brand on Wednesday and bought through a Google ad on Thursday appears as one conversion in each platform. Neither is lying; both are answering a narrow question about their own touchpoint. Summing them produces a total that exceeds the number of orders in the shop, and the discrepancy grows with the number of channels running.
The practical consequence is that platform numbers are for steering, not for scorekeeping. Inside the account they tell you which ad set is doing better than another under one consistent rule, which is exactly what bidding needs. Outside the account they need a single source of truth that cannot double-count — the shop, the CRM or the finance ledger.
Two habits make that separation survivable. Keep the window fixed for long stretches so trends remain comparable, and label every reported figure with its window and its source system. Reports that mix a platform ROAS from one month with a blended figure from the next produce arguments no amount of analysis can settle.
What to actually report
Run two layers and never mix them. The optimisation layer is the platform's own number in a fixed window, used to make in-account decisions like pausing, scaling and bidding. The business layer is total revenue over total marketing spend, taken from the shop or CRM, used to judge whether marketing as a whole is working. Google's guidance on attribution models and its reporting documentation describe the same separation from the analytics side.
Adding every platform's claimed conversions together always overstates results, because two platforms will each claim the same sale. Where the stakes justify it, incrementality testing or marketing mix modelling answers the causal question that no window can.
Consent also changes the picture. When users decline tracking, conversions go unobserved and platforms model the gap; the mechanics are set out in Google's consent mode documentation, and a banner change can shift reported volume without any change in sales — exactly the scenario in GA4 traffic dropping after a consent banner change.
None of this works on broken plumbing. Duplicate events inflate every window at once, as covered in pixel and CAPI deduplication. Getting this layer right is the core of how we build analytics and conversion tracking for Meta Ads clients. More on the blog.
Frequently Asked Questions
Which attribution window should most accounts use?
7-day click. It captures realistic decision time for ecommerce and lead generation without handing the channel credit for impressions nobody engaged with.
Does changing the window change actual performance?
It changes reported performance immediately and real performance indirectly, because bidding optimises toward the events it is credited with. Change it deliberately and annotate the date.
Why do platform numbers exceed the shop's order count?
Because each platform counts a conversion it can claim under its own rules, and the same order can be claimed by several. Reconcile against the shop or CRM, never by addition.
Is view-through attribution useless?
No, but it is the weakest evidence available. Use it to understand upper-funnel contribution, not to justify budget to a finance team.
How do we prove the channel actually caused sales?
Only through incrementality work: geo holdouts, structured pauses or media mix modelling. No attribution window can establish causation on its own.
Sources: Google Analytics — attribution models; Google Analytics reporting; consent mode; marketing attribution; marketing mix modelling. Meta's own attribution setting documentation was consulted directly for window definitions. Last verified 2026-08-21.


