



Table of contents

Attribution analytics is the practice of assigning conversion credit to marketing touchpoints along the customer journey. The problem: platform-reported ROAS is 2.3× higher than ground truth on average, and 57% of marketers predict attribution will get harder as privacy regulations tighten.
Key Takeaways
- Platform-reported ROAS is 2.3× higher than actual marginal ROAS measured via incrementality tests across 150 brands (GrowWithBa, 2026).
- Meta over-reports ROAS by 2.1–3.5× versus ground truth; Google Ads by 1.4–2.2×; Performance Max by 2.8–4.1×.
- 32% average signal loss on Meta post-iOS 17, with some accounts losing up to 48% of conversion data.
- Data-driven attribution requires 400+ monthly conversions to produce statistically stable results — below that, rule-based models outperform algorithms.
- 23% of brands actively run marketing mix modeling (MMM), up from 8% in 2024.
- 68% of brands that ran incrementality tests found at least one channel with negative incrementality — meaning the channel was getting credit for conversions that would have happened anyway.
- 24% of brands cut spend on branded search after running incrementality tests.
- 84% of teams use blended MER (marketing efficiency ratio: revenue ÷ all marketing spend) as their primary attribution metric.
- 20–40% of B2B buyer touchpoints are never tracked by any click-based attribution model.
- Last-click attribution overcredits bottom-funnel channels by 30–50%, pulling budget away from awareness efforts that fuel growth.
- Multi-touch attribution overstates digital and undervalues brand spend because it only measures what it can track.
- Average cost of an incrementality test is $8,000–$25,000 — but one test often pays for itself by eliminating wasted spend.
What Is Attribution Analytics?
Attribution analytics is the discipline of assigning revenue credit to marketing touchpoints across the customer journey. A customer might click a Google ad, read a blog post, receive three emails, visit your site directly, and then convert. Attribution analytics answers the question: which touchpoints actually caused the conversion?
The answer matters because it determines where you spend your marketing budget. If your attribution model overcredits branded search (as last-click models typically do), you will over-invest in bottom-funnel channels and starve the top-of-funnel campaigns that actually drive growth.
Marketing attribution methods fall into three categories:
- Single-touch models (first-touch, last-touch) — assign 100% of credit to one touchpoint. Simple but misleading.
- Multi-touch models (linear, time-decay, U-shaped, W-shaped, data-driven) — distribute credit across multiple touchpoints in the customer journey.
- Aggregate methods (marketing mix modeling, incrementality testing) — measure channel impact without relying on individual user tracking.
Attribution Models Explained
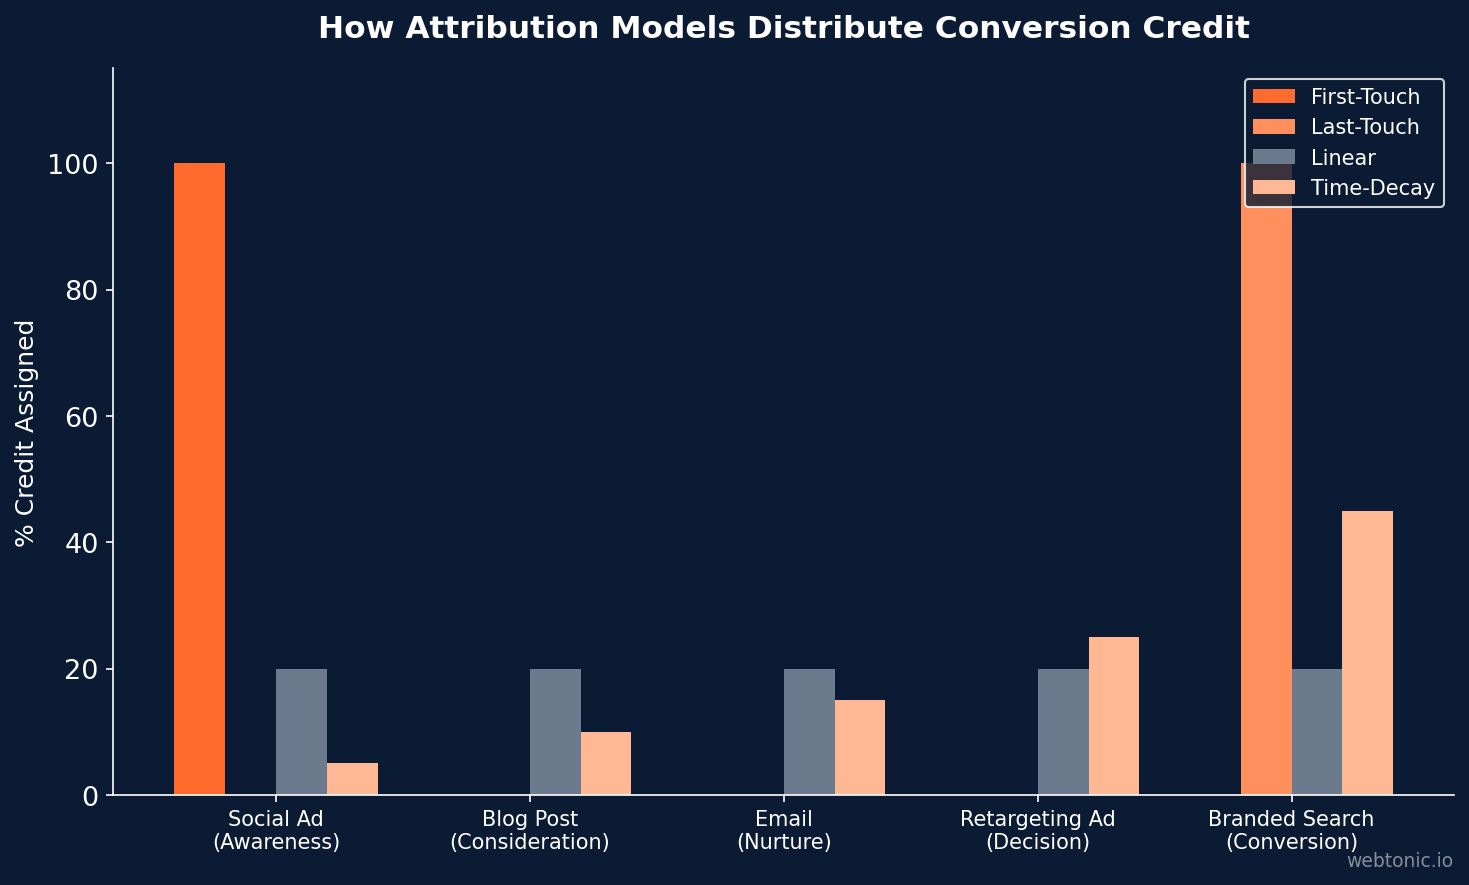
Each attribution model distributes conversion credit differently. Understanding how each model assigns credit helps you choose the right one for your business — and understand why no single model tells the complete truth.
| Model | How Credit Is Assigned | Best For | Key Limitation |
|---|---|---|---|
| First-Touch | 100% to first touchpoint | Measuring awareness channel impact | Ignores everything after initial contact |
| Last-Touch | 100% to last touchpoint | CRM defaults, simple reporting | Overcredits bottom-funnel by 30–50% |
| Linear | Equal credit to all touchpoints | Long sales cycles with many interactions | Treats all touches as equally valuable |
| Time-Decay | More credit to recent touchpoints | DTC e-commerce with short purchase cycles | Undervalues early awareness efforts |
| U-Shaped | 40% first, 40% last, 20% middle | B2B with identifiable lead creation events | Arbitrary weighting assumptions |
| Data-Driven | ML-calculated marginal contribution | High-volume accounts (400+ conversions/month) | Requires large data volume to be stable |
First-Touch Attribution
First-touch attribution gives 100% of credit to the first marketing touchpoint — the initial ad click, organic search visit, or content download that brought the customer into your funnel. Every subsequent interaction is ignored. This model is useful for understanding which channels drive top-of-funnel awareness, but it tells you nothing about what converted the customer.
Last-Touch Attribution
Last-touch attribution assigns all credit to the final touchpoint before conversion — typically a branded search query, direct site visit, or retargeting ad click. It is the default model in most CRMs and legacy analytics platforms. The problem: it overcredits bottom-funnel channels by 30–50%, driving budget away from the awareness campaigns that created demand in the first place.
Multi-Touch Attribution
Multi-touch attribution distributes credit across every tracked touchpoint in the customer journey. Linear models split credit equally, time-decay models weight recent touchpoints more heavily, and position-based models assign fixed percentages to key positions (first touch, lead creation, last touch). Multi-touch is more accurate than single-touch, but it still only measures what it can track — and 20–40% of B2B touchpoints are invisible to click-based tracking.
Data-Driven Attribution
Data-driven attribution uses machine learning to calculate the actual marginal contribution of each touchpoint to conversion probability. Google Analytics 4 uses a Shapley value framework to distribute credit based on cooperative game theory — comparing journeys that converted against journeys that did not. When it works, data-driven attribution is the most accurate click-based model available. The catch: it requires 400+ monthly conversions to produce statistically stable outputs. Below that threshold, rule-based models outperform algorithms.
The Attribution Crisis: Platform Reporting vs. Reality
A 2026 study of 150 brands revealed how far platform-reported metrics have drifted from reality. The study compared platform ROAS against ground truth measured via incrementality tests and holdout groups:
| Platform | Signal Loss (Post-iOS 17) | ROAS Over-Reporting |
|---|---|---|
| Meta (Facebook/Instagram) | 32% average (range 18–48%) | 2.1–3.5× |
| Google Ads | 11% average (range 5–22%) | 1.4–2.2× |
| Performance Max | Included in Google total | 2.8–4.1× (worst offender) |
| TikTok | 24% average (range 14–35%) | 1.8–2.8× |
| Email (Klaviyo) | 6% signal loss | Minimal — fully first-party |
Performance Max campaigns are the worst offender, over-reporting ROAS by 2.8–4.1× because they blend branded search, shopping, display, and YouTube into a single black box. When you cannot separate branded search conversions (which would have happened organically) from incremental conversions driven by the ad, the reported numbers become meaningless for budget allocation.


Marketing Mix Modeling and Incrementality Testing
The brands hitting profitable growth in 2026 use 3+ attribution lenses rather than relying on a single source of truth. The operating standard is triangulation: marketing mix modeling for strategic allocation, incrementality tests for tactical decisions, and platform metrics as directional input.
Marketing Mix Modeling (MMM)
MMM is a statistical regression method that measures how each marketing channel contributes to revenue using aggregate data — not individual user tracking. This makes it the only attribution method robust to privacy changes, because it does not depend on cookies or pixel data. Adoption is accelerating: 23% of brands now actively run MMM (up from 8% in 2024), with Meta and Google offering free tools (Meta Marketing Mix Modeling and Google Meridian). Average cost for paid MMM platforms: $3,500–$15,000/month.
Incrementality Testing
Incrementality testing (holdout tests, geo-lift tests) is the only attribution method that can prove causation, not just correlation. You turn off a channel in one geography or for one audience segment and measure whether conversions actually drop. Among brands that have run these tests, 68% found at least one channel with negative incrementality — meaning the channel was getting credit for conversions that would have happened without any ad spend. 24% cut branded search spend after testing. Average cost: $8,000–$25,000 per test, but one test often pays for itself by eliminating wasted budget.
Attribution Analytics Tools and Software
The marketing attribution software landscape ranges from free analytics tools to enterprise platforms costing $15,000+/month. Choosing the right attribution analytics tool depends on your spend level, technical capabilities, and measurement maturity.
| Tool | Best For | Attribution Method | Price |
|---|---|---|---|
| Google Analytics 4 | All advertisers (baseline) | Data-driven (Shapley value) | Free |
| Triple Whale | DTC e-commerce | Pixel + server-side hybrid | $129–$279/mo |
| Madgicx | Meta-heavy advertisers | AI-powered + server-side | $44–$799/mo |
| Northbeam | Multi-channel DTC | ML multi-touch | Custom |
| Meta MMM (Robyn) | Strategic allocation | Marketing mix modeling | Free (open source) |
| Google Meridian | Strategic allocation | Marketing mix modeling | Free (open source) |
Google Analytics 4 provides data-driven attribution at no cost and is a solid baseline for every account. However, it is biased toward Google channels and struggles with accurate cross-platform attribution — especially for Facebook and TikTok campaigns. For DTC brands spending $50,000+/month on paid media, a dedicated attribution tool like Triple Whale or Northbeam provides a materially more accurate picture of channel performance.

Privacy, Cookies, and the Future of Attribution
The attribution landscape is in permanent transition. Third-party cookies are fading, privacy regulations are expanding (GDPR, CCPA, and new state-level laws), and platform-side signal loss continues to grow. Here is what this means for your attribution analytics strategy:
- First-party data is now essential. Customer lists, CRM records, and server-side conversion tracking (CAPI) provide the most reliable data for attribution — and they are fully compliant with privacy regulations.
- Consent-driven experiences build better data trails. Brands that invest in transparent consent flows collect higher-quality data than those relying on cookie banners and dark patterns.
- Server-side tracking is table stakes. Top-performing measurement teams have server-side tracking on 100% of conversions, first-party data in a CDP (Segment, RudderStack), and weekly incrementality tests rotating by channel.
- Post-purchase surveys fill attribution gaps. 48% of DTC brands use post-purchase "How did you hear about us?" surveys as an attribution data source — imperfect, but it captures channels that digital tracking misses entirely (word of mouth, podcasts, influencers).
Building an Attribution Analytics Dashboard
An effective marketing attribution dashboard surfaces the metrics that actually drive budget decisions. Here is what top-performing teams track:
- Blended MER (Marketing Efficiency Ratio): Total revenue ÷ total marketing spend. Used by 84% of teams as their primary metric. It sidesteps the attribution debate entirely by measuring total efficiency.
- New Customer CAC: Cost to acquire a first-time customer, tracked by 67% of teams. Separate this from returning customer CAC to understand true growth efficiency.
- Platform-reported ROAS: Still tracked by 72% of teams, but trusted less than before. Use as a directional signal, not a budget-making number.
- Channel incrementality scores: Results from holdout/geo-lift tests that show which channels actually drive incremental conversions. The gold standard for budget reallocation.
- Time-lagged conversion curves: How long conversions take to appear after the initial touchpoint. This reveals whether you are cutting campaigns too early — a common problem with short attribution windows.
Related reading
- Mortgage Marketing Attribution & BI: 2026 Statistics on What Actually Gets Credited
- Painting Marketing Attribution Statistics 2026: The Data Is Wrong Before the Model Is
- Personal Injury Law Marketing Attribution Statistics: 44+ Benchmarks for 2026
- Marketing Attribution services at Web Tonic
Frequently Asked Questions
What is attribution analytics and why is it important?
Attribution analytics is the practice of assigning conversion credit to marketing touchpoints across the customer journey. It matters because it determines where you allocate your marketing budget. Without accurate attribution, you risk over-investing in channels that get credit for conversions they did not cause — and under-investing in the channels that actually drive growth. Studies show platform-reported ROAS is 2.3× higher than ground truth on average.
Which attribution models are most effective for different marketing goals?
For DTC e-commerce, time-decay or data-driven attribution models work best because purchase cycles are short and recent touchpoints carry more weight. For B2B companies with longer sales cycles, U-shaped or W-shaped models capture the critical lead-creation moments. Data-driven attribution is the most accurate click-based model but requires 400+ monthly conversions to produce stable outputs. Below that volume, rule-based models outperform algorithms.
What tools or software can help with marketing attribution analytics?
Google Analytics 4 provides free data-driven attribution and is a solid starting point. For DTC brands spending over $50,000/month, dedicated tools like Triple Whale, Northbeam, or Madgicx offer more accurate cross-platform views. For strategic budget allocation, open-source MMM tools like Meta's Robyn or Google Meridian are free and privacy-compliant. The right tool depends on your spend level and measurement maturity.
How does the timing of touchpoints affect attribution credit?
In time-decay attribution, touchpoints closer to the conversion receive more credit than earlier interactions. This works well for short-cycle DTC purchases but undervalues awareness campaigns that plant seeds weeks or months before the sale. Lookback windows (typically 7–28 days) also affect credit distribution — a 7-day window ignores any touchpoint older than a week, which can completely erase the contribution of upper-funnel channels from your attribution data.
How can attribution analytics improve marketing ROI?
Attribution analytics improves ROI by revealing which channels actually drive incremental conversions versus which channels take credit for conversions that would have happened anyway. Brands that run incrementality tests often discover at least one channel with negative incrementality — meaning they are paying for conversions they would have gotten for free. Reallocating that wasted budget to truly incremental channels compounds returns. The key is moving beyond platform-reported numbers to ground-truth measurement via holdout tests and marketing mix modeling.
Sources
getfairview.com/attribution
getfairview.com – Attribution Model Comparison
growwithba.com – The Attribution Crisis: 150-Brand Study
madgicx.com – Attribution Modeling Platforms
openmalo.com – Multi-Touch Attribution Models
syrenis.com – Rethinking Attribution


