Table of contents

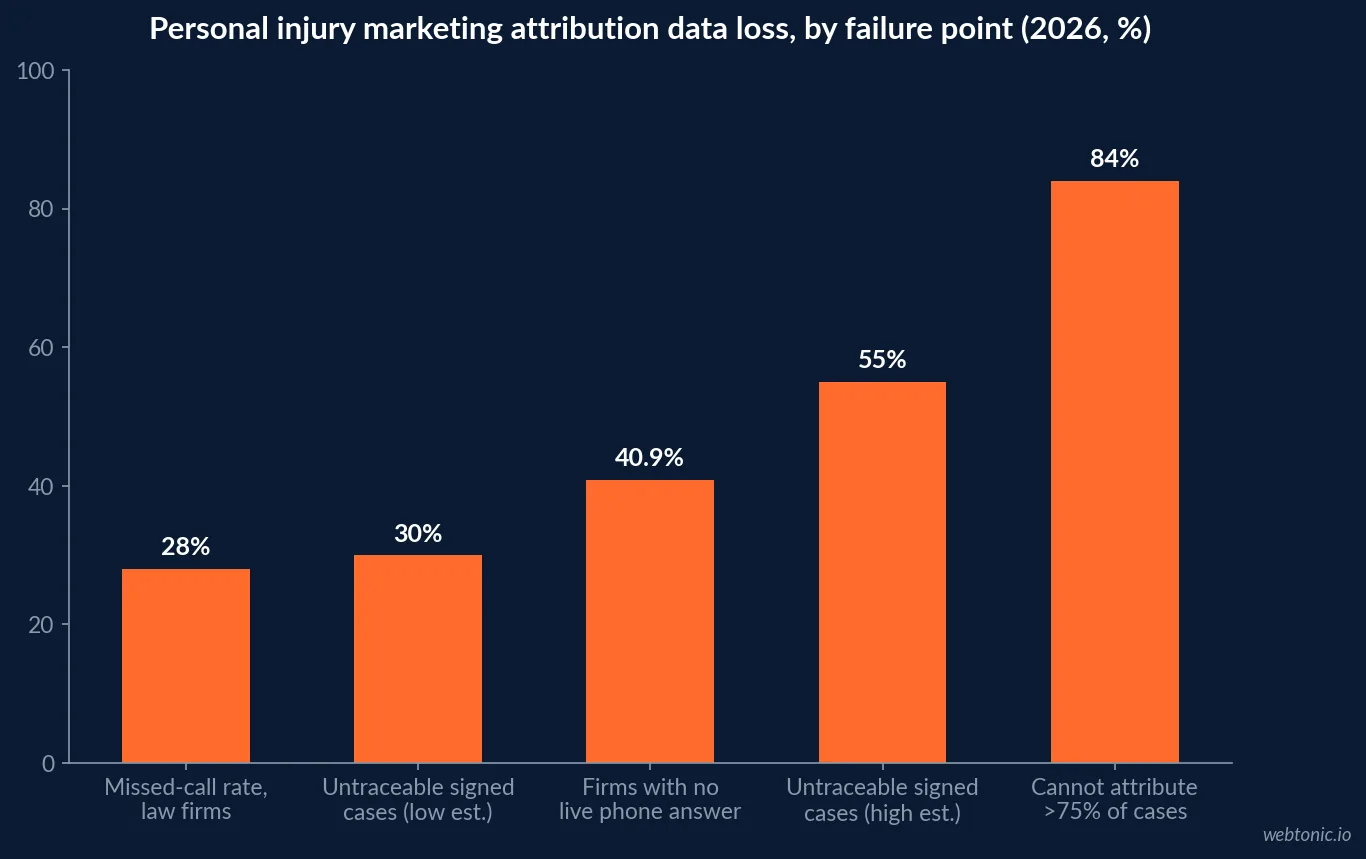
Personal injury firms buy the most expensive clicks in paid search and then measure them with a lead-source dropdown. The result is predictable: 84% of law firms cannot attribute more than 75% of their signed cases to a channel. These are the 2026 numbers that show where the data leaks and what to measure instead.
Key Takeaways
- 84% of law firms cannot attribute more than 75% of signed cases to a channel.
- About one in four firms has effectively no attribution at all.
- Practitioners estimate 30–55% of signed PI cases are untraceable without call tracking and CRM tagging.
- 68% of legal consumers contact a firm by phone first, so untagged calls are lost cases.
- Law firms run a 28% missed-call rate; 80% of voicemail callers hang up.
- In a 2026 mystery-shop study, 40.9% of firms gave no live answer at all.
- Even among firms advertising 24-hour availability, 29.2% failed to answer the phone.
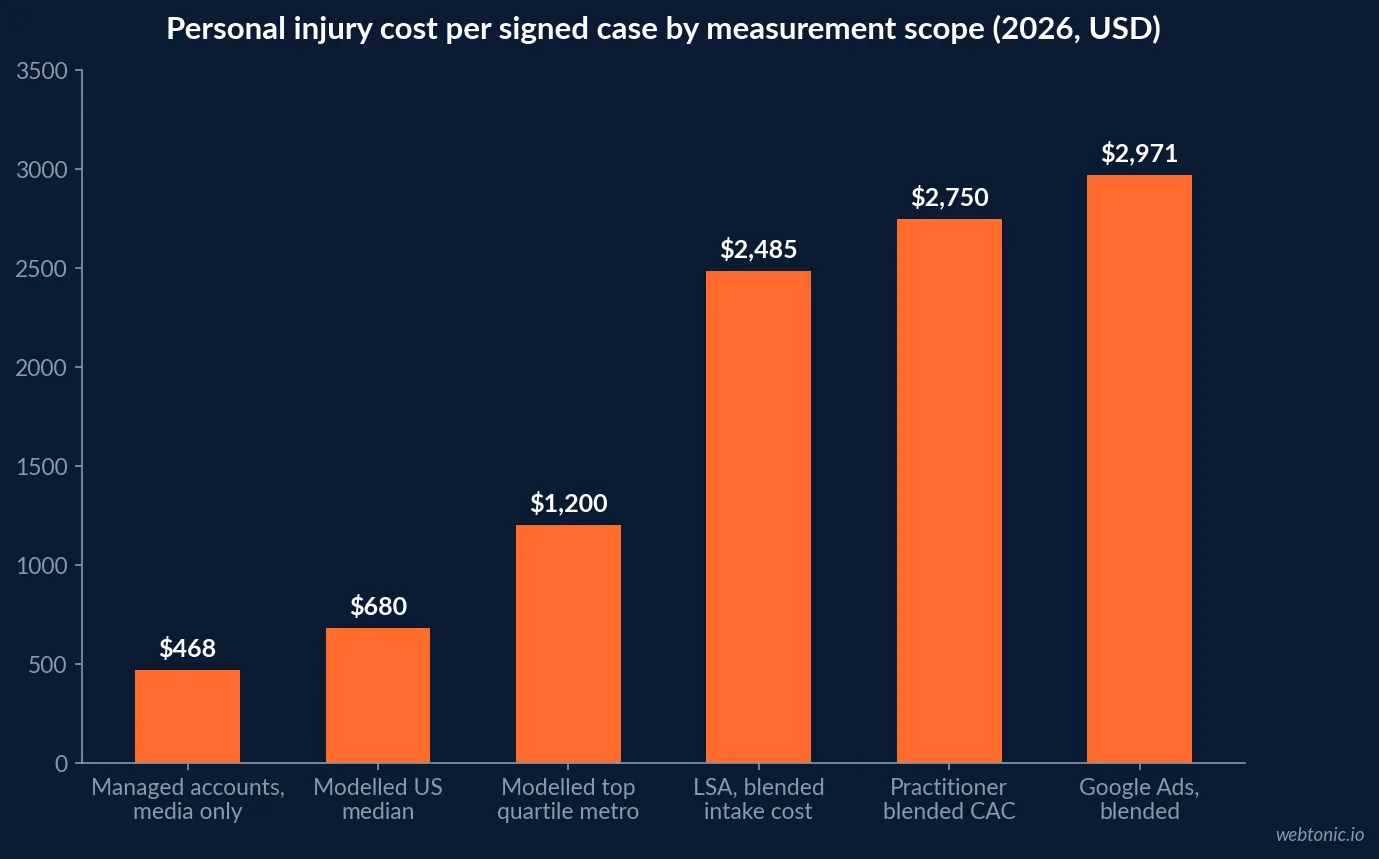
- Managed-account data across $3.3M in spend puts PI at $284 per lead and $468 per signed case on media-only maths.
- Blended plaintiff-firm cost per signed case runs $2,485 (LSA) to $2,971 (Google Ads).
- Modelled national median PI cost per signed case is $680, range $420–$1,200.
- Signed-case rates range from 0.5% (shared social leads) to 25–45% (referrals).
- Leads called in under a minute convert 391% better than those called after 30 minutes.
- Firms replying within five minutes book consultations at 62% versus 22% after 30 minutes.
- Only 25% of firms respond to web leads in under five minutes, up from 13% four years ago.
- Median end-to-end lead-to-signed-case rate is 24% across US firms; PI averages 7–14%.
- 47% of marketing teams run multi-touch attribution; 26% now run marketing mix modelling, up from 9% in 2023.
- 67% of marketers say attribution accuracy has declined since 2021 because of privacy changes.
- Firms using an intake CRM report 47% more lead conversions.
The Attribution Gap in Plaintiff-Side Firms
The most direct measurement of the problem comes from a 2026 study of $3.3 million in managed ad spend across 13 plaintiff-side law firms. It found that 84% of firms have significant gaps in tracking where signed cases originate, and that about a quarter of firms have no working attribution at all. That is not a reporting inconvenience: it is a budget decision made blind every month.
| Attribution capability | Share of law firms | Practical consequence |
|---|---|---|
| Cannot attribute more than 75% of signed cases | 84% | Channel ranking is guesswork |
| Essentially no attribution in place | ~25% | Spend defended by anecdote |
| Signed cases untraceable without call tracking + CRM tags | 30–55% | Best channel may look worst |
| Report attribution accuracy declined since 2021 | 67% | Privacy changes broke old models |
| Run multi-touch attribution | 47% | Tactical channel decisions |
| Run marketing mix modelling | 26% | Strategic budget allocation |
The cross-industry context matters here. Multi-touch adoption has climbed to 47% and marketing mix modelling has tripled to 26% from 9% in 2023, according to a 2026 survey of more than 1,200 marketing teams. Legal is behind that curve while operating in one of the few categories where a single mis-attributed channel can move seven figures of fee revenue.
Why the Phone Breaks Personal Injury Attribution
Injury clients call. Analysis of legal intake shows roughly 68% of legal consumers contact a firm by phone first, which makes the telephone the primary conversion event and the primary point of data loss. A call that arrives on a static number with no dynamic insertion carries no channel, no campaign and no keyword.
The loss compounds at the intake desk. Industry data puts the law firm missed-call rate at 28% — among the highest of any industry — with 80% of callers who reach voicemail hanging up without leaving a message. A 2026 mystery-shop of firms across 22 US metros found 40.9% gave no live answer, and 29.2% of firms that advertise 24-hour availability still did not pick up.
| Intake leak | 2026 benchmark | Attribution impact |
|---|---|---|
| Firms giving no live answer (mystery shop) | 40.9% | Lead exists in ad platform, never in CRM |
| Missed-call rate, law firms | 28% | Channel credited with zero cases it produced |
| Voicemail callers who hang up | 80% | No source captured, no callback |
| 24-hour-availability firms that did not answer | 29.2% | Paid after-hours clicks unmeasured |
| Firms answering 85%+ of calls (benchmark) | Target | Attribution becomes representative |
| Firms responding to web leads under 5 minutes | 25% | Speed decides which firm gets credited |
Speed to Contact Is an Attribution Variable
Response time does not just change conversion rate; it changes which channel appears to work. Benchmark data shows leads contacted in under a minute convert at 391% higher rates than leads contacted after 30 minutes, and a 2026 law-firm benchmark report found firms replying within five minutes booked consultations at 62% versus 22% after 30 minutes.
| Response window | Consultation booking rate | Relative loss |
|---|---|---|
| Under 5 minutes | 62% | Baseline (best) |
| 5–30 minutes | 41% | 34% worse |
| 30 minutes – 2 hours | 22% | 65% worse |
| 2–24 hours | 12% | 81% worse |
| No response | 0% | Channel scores zero regardless of quality |
Only 25% of firms answer web leads inside five minutes, up from 13% four years ago according to Hennessey Digital’s response-time study. Two firms buying identical traffic can therefore report cost per signed case figures that differ by a factor of three, purely on intake operations. That is why our personal injury law analytics statistics treat intake speed as a measurement input rather than a sales metric.
Signed-Case Rates by Channel: Why Cost Per Lead Misleads
Attribution only pays for itself when it reaches the retainer. Benchmark ranges by lead source show an order-of-magnitude spread in lead-to-signed-case rates, which means cost per lead ranks channels incorrectly in most PI accounts.
| Lead source | Contact rate | Consultation rate | Lead → signed case |
|---|---|---|---|
| Referrals (attorney or client) | 40–60% | 50–70% | 25–45% |
| SEO / organic | 18–28% | 35–55% | 8–20% |
| Google Ads (exclusive) | 20–30% | 40–60% | 10–25% |
| Local Services Ads | 15–25% | 35–55% | 8–18% |
| Directory listings | 10–20% | 25–40% | 3–10% |
| Google Ads (shared leads) | 8–15% | 30–45% | 3–8% |
| Social media (shared leads) | 1–3% | 10–20% | 0.5–1.5% |
Case type moves the same arithmetic. Wrongful death leads sign at 15–28% and truck accident leads at 12–22%, while slip-and-fall sits at 6–12%. A campaign structure that mixes them under one conversion action hides the difference — the same failure mode we document in our personal injury law Google Ads statistics.
Cost Per Signed Case: Two Valid Benchmark Sets
Published PI cost-per-signed-case figures differ by a factor of four, and the gap is a scope difference rather than a contradiction. One set counts media spend only; the other counts media plus intake labour, CRM and overhead. Publish both and say which is which.
| Benchmark | Cost per lead | Cost per signed case | What is counted |
|---|---|---|---|
| Managed plaintiff accounts, PI (MVA) | $284 | $468 | Ad spend ÷ CRM-verified cases |
| Modelled US median, personal injury | $135 | $680 | Media only, modelled national median |
| Modelled top-quartile market | $210 | $1,200 | Media only, major metros |
| Managed accounts, Google Ads channel | $95 | $2,971 | All leads incl. unqualified, blended |
| Managed accounts, Local Services Ads | $205 | $2,485 | All leads incl. unqualified, blended |
| Practitioner blended CAC, PI firm | — | $2,750 | Paid + referral fees + organic |
The managed-account study also shows why practice-area comparison needs care: bankruptcy leads cost $201 and sign at 10% for a $192 cost per case, while criminal defence leads cost $60 and sign at 2% for $659. Cheap leads, expensive cases. Guidance from cost-per-signed-case benchmarking for law firms is to include intake salaries and software in the numerator so the metric survives a partner meeting.
The Four-Layer PI Attribution Stack
Nothing in the data suggests firms need a new model. It suggests they need clean inputs. Four layers, in this order, close most of the gap.
- Layer 1 — dynamic call tracking. Unique numbers per channel and campaign, with dynamic number insertion on the site. Without it, the 68% of clients who call first are invisible.
- Layer 2 — UTM and offline click IDs. Every paid, email and directory link tagged consistently, with click IDs stored so signed cases can be uploaded back to the ad platform as offline conversions.
- Layer 3 — CRM intake tagging. A required lead-source field naming channel and campaign, not “internet” or “referral”. Firms on intake CRM software report 47% more lead conversions.
- Layer 4 — settlement-side join. Fee revenue written back to the original lead once the case resolves, so channels are judged on fees rather than form fills.
Layer 4 is where legal differs most from other verticals. Soft-tissue matters settle in 3–6 months, surgical cases in 12–24 months, and litigated files can run two to three years. Any attribution window shorter than the case cycle systematically under-credits the channels that bring the largest cases, which is why our data intelligence builds report on a rolling cohort basis rather than a monthly snapshot.
Personal Injury vs Other Practice Areas
| Practice area | Median cost per lead | Median cost per signed case | Lead → signed |
|---|---|---|---|
| Personal injury | $135 | $680 | 7–14% |
| Employment law | $82 | $340 | ~20% |
| Criminal defence | $78 | $290 | 2–10% |
| Family law | $65 | $240 | ~25% |
| Bankruptcy | $60 | $215 | 10% |
| Immigration | $52 | $165 | ~30% |
Personal injury has the highest acquisition cost and the highest variance, and major metros run 30–60% above the median. That combination is what makes attribution a profit lever rather than a reporting hygiene project: the median US firm converts 24% of leads end to end, PI firms average 7–14%, and top-quartile PI firms reach 25–40%. The gap between those two PI figures is worth more than any bid strategy change. For the wider channel picture, see our personal injury law digital marketing statistics.
What to Report Monthly
| Metric | Where it comes from | Healthy signal |
|---|---|---|
| Share of signed cases with a channel tag | CRM lead-source field | Above 90% |
| Call answer rate, all operating hours | Call tracking platform | 85%+ |
| Median speed to first contact | CRM timestamps | Under 5 minutes |
| Lead → signed case by channel | CRM joined to spend | Compared to source benchmarks, not to each other |
| Cost per signed case, media-only and blended | Spend + intake cost ÷ cases | Both published side by side |
| Fee revenue per channel cohort | Case management system | Reviewed on a 12-month rolling basis |
Six rows, reviewed monthly, replace most attribution debates. The firms that win here are not the ones with the most sophisticated model; they are the ones whose intake desk answers the phone and types the source into the same field every time. Our growth marketing engagements start there before any budget moves.
Frequently Asked Questions
How many personal injury signed cases can actually be traced to a marketing channel?
Fewer than most partners assume. A 2026 analysis of $3.3 million in managed spend across 13 plaintiff-side firms found 84% of law firms cannot attribute more than 75% of their signed cases to a specific channel, and roughly one in four has essentially no attribution at all. Practitioner estimates put the untraceable share of signed cases at 30–55% where call tracking and CRM tagging are missing.
Why is attribution harder in personal injury than in ecommerce?
Because the conversion is a phone call and the revenue arrives months later. Roughly 68% of legal consumers contact a firm by phone first, so any untagged call is an untraceable case, and a PI matter can take 6–24 months to settle — which means the fee that validates a channel lands long after the ad platform has closed its attribution window.
What is a good cost per signed case for a personal injury firm?
It depends on which denominator you use. A modelled national median puts personal injury cost per signed case near $680 (range $420–$1,200) counting media only, while managed-account data for plaintiff firms shows $2,485 on Local Services Ads and $2,971 on Google Ads once every lead and intake cost is included. Publish both, and label which costs are inside the number.
Which metric should replace cost per lead?
Cost per signed case. At a 7% lead-to-signed rate, a $284 PI lead becomes a roughly $4,000 case; at 20% the same lead cost produces a $1,420 case. Because signed-case rates vary from 0.5% on shared social leads to 25–45% on referrals, cost per lead ranks channels in the wrong order almost every time.
What does a working PI attribution stack look like in 2026?
Four layers: dynamic call tracking on every number, UTM discipline on every link, a lead-source field in the intake CRM that names channel and campaign, and a settlement-side join that writes fee revenue back to the original lead. Firms using intake CRM software report 47% more lead conversions, and 47% of teams now run multi-touch attribution with 26% adding marketing mix modelling as signal loss grows.
Sources
Law Firm PPC Statistics 2026 ($3.3M managed spend, 13 plaintiff firms)
Marketing attribution for law firms
Personal injury firm marketing KPIs and intake data
2026 Legal Intake Benchmark Report
Law Firm Marketing Benchmark Report 2026
Personal Injury Lead Conversion Rates: Industry Benchmarks 2026
Law firm lead-form response time study
Marketing Attribution Statistics 2026 (1,200+ teams)
Cost per signed case: 2026 benchmarking guide
Cost per signed case: personal injury firm guide
Legal marketing benchmarks by practice area 2026
Personal injury case values and settlement timelines 2026