



Table of contents
Video grew 25.4% in 2025 while linear TV fell 13.4%, and marketing mix models still say gaming, commerce media and creator content are the most underrepresented channels in the plan. This page tracks where advertising budgets by format and media type actually moved in the latest full-year data, and where the models say they still need to.
Key Takeaways
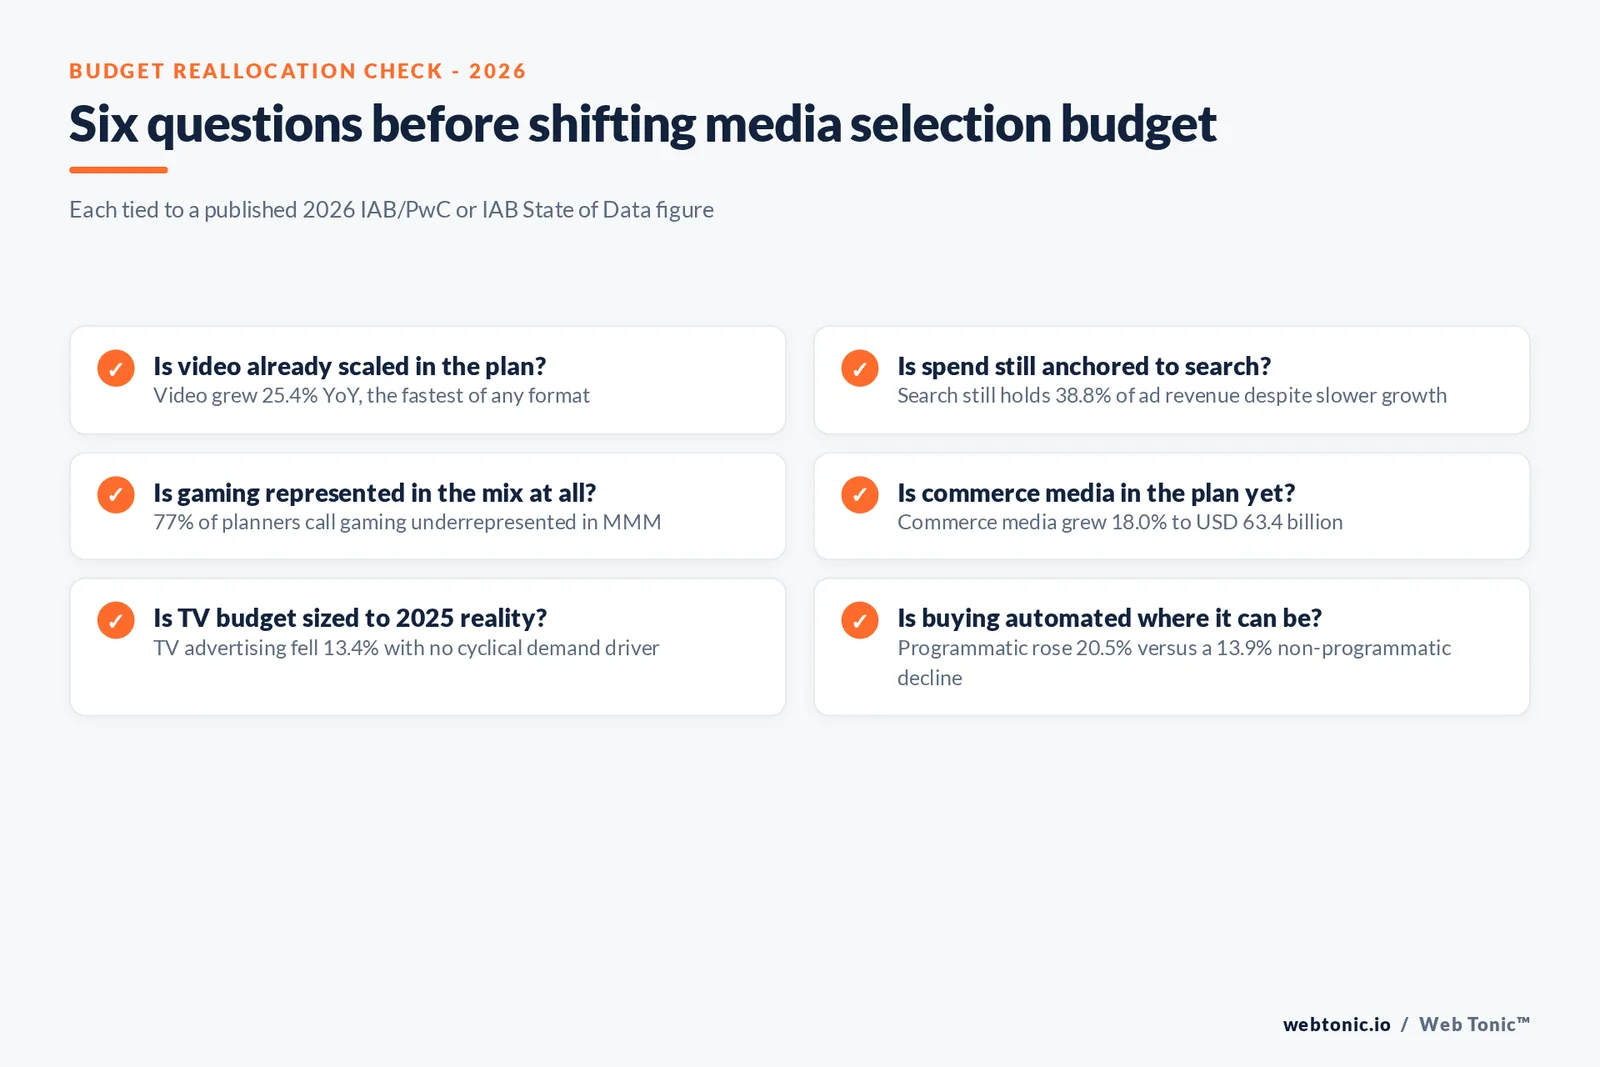
- Digital video revenue grew 25.4% year over year, the fastest of any format.
- Video reached USD 78.0 billion in 2025, up from USD 62.1 billion.
- Search still holds the largest share of ad revenue at 38.8%, though growth slowed to 11.0%.
- Display revenue grew the slowest of the major formats, at 9.8%.
- Programmatic buying rose 20.5% to USD 162.4 billion.
- Non-programmatic placements fell 13.9%, to USD 18.0 billion.
- Social media ad revenue grew 32.6%, adding USD 29.0 billion in a single year.
- Commerce media grew 18.0%, to USD 63.4 billion.
- TV advertising revenue fell 13.4%, reversing 6.6% growth the year before.
- Video games and esports advertising grew 22.0%, the fastest of any media type.
- Newspaper and consumer magazine advertising fell 3.5%, extending a multi-year decline.
- Out-of-home advertising grew a modest 2.2%.
- 77% of planners say gaming is underrepresented in marketing mix models.
- 50% say the same about commerce media, and 48% about creator/influencer marketing.
- The top 10 ad-selling companies now hold 84.1% of U.S. digital ad revenue.
- That is up from 76.8% just three years earlier.
The format scoreboard: video is winning, display is stalling
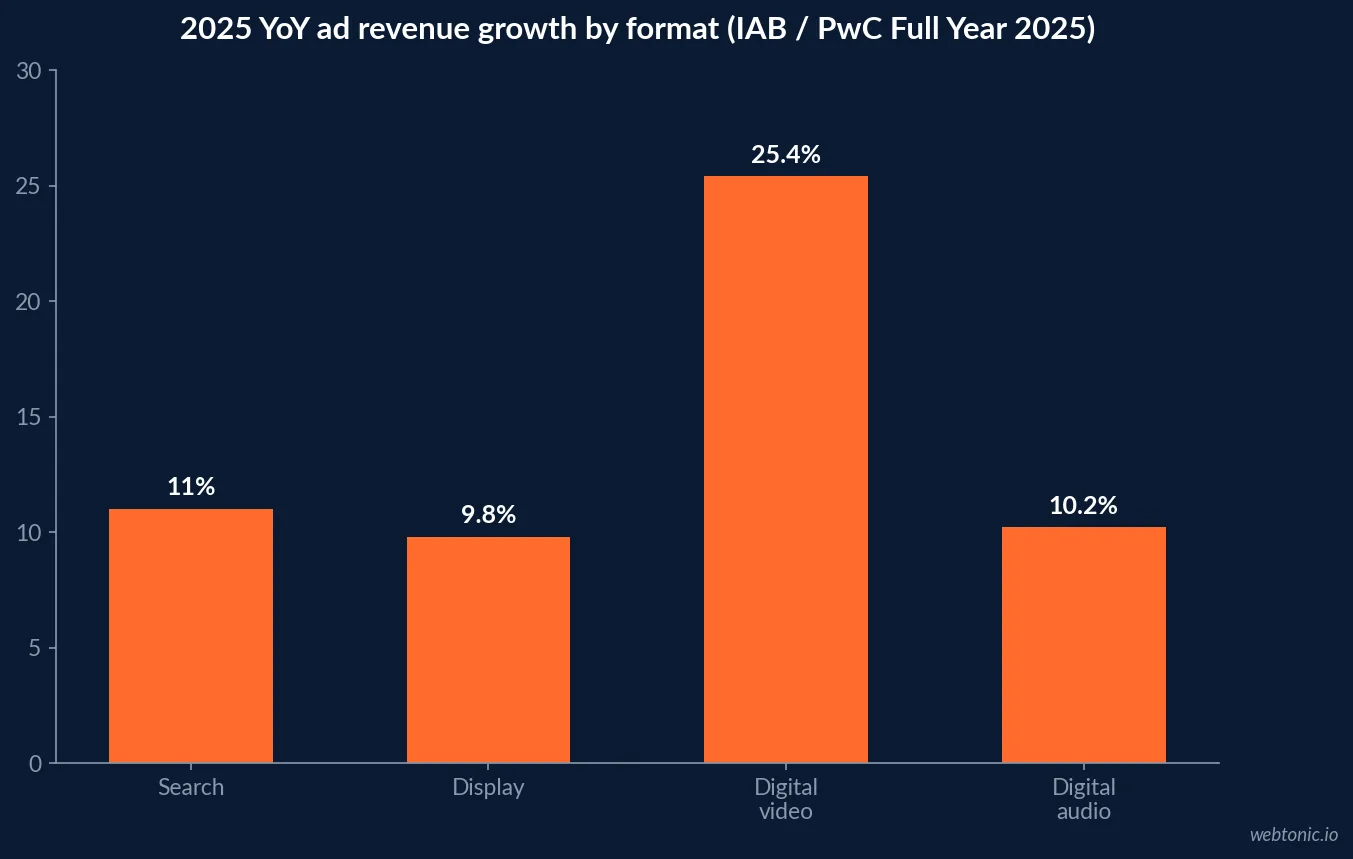
The IAB/PwC Internet Advertising Revenue Report for full-year 2025 breaks U.S. digital ad revenue into five formats, and the growth gap between them has widened. Search still holds the largest dollar share at 38.8% of revenue, reaching USD 114.2 billion, but its growth rate slowed to 11.0% from 15.9% the year before as AI-driven search experiences change how those dollars are counted. Video, by contrast, accelerated to 25.4% growth, taking share from every other format.
| Format | 2024 revenue (USD B) | 2025 revenue (USD B) | YoY growth | 2025 share |
|---|---|---|---|---|
| Search | 102.9 | 114.2 | +11.0% | 38.8% |
| Display | 74.3 | 81.6 | +9.8% | 27.7% |
| Digital video | 62.1 | 78.0 | +25.4% | 26.5% |
| Digital audio | 7.6 | 8.4 | +10.2% | 2.8% |
| Other (classifieds, lead gen) | 11.7 | 12.5 | +6.9% | 4.2% |
Buying method: programmatic is absorbing almost all new spend
It is not just which format wins, it is how it is bought. Programmatic advertising revenue (excluding search) reached USD 162.4 billion in 2025, growing 20.5% year over year and accelerating from 18.0% the year before. Non-programmatic placements moved the opposite direction, falling 13.9% to USD 18.0 billion. Automated buying is now the default path for essentially every incremental dollar entering CTV, social and display.
| Buying method | 2021 (USD B) | 2023 (USD B) | 2025 (USD B) | 2025 YoY |
|---|---|---|---|---|
| Programmatic | 99.0 | 114.2 | 162.4 | +20.5% |
| Non-programmatic (excl. search) | 12.0 | 22.0 | 18.0 | -13.9% |
That USD 162.4 billion is ad spend moving through automated channels, not the software market that powers the buying itself. The Business Research Company sizes the programmatic advertising platform market separately at a much smaller USD 15.68 billion in 2025, projected to grow toward USD 19.04 billion in 2026. Confusing the two, ad spend flowing through programmatic versus the DSP/SSP tooling market, is a common media-plan reporting error worth checking before a budget memo goes out.
By media type: where the whole budget, not just digital, is moving
Looking across digital and non-digital media together, 2025 was a reversal year for television. TV advertising fell 13.4%, undoing 6.6% growth in 2024, mostly because 2025 lacked the U.S. presidential election and Summer Olympics that pulled TV budgets forward the year before. Video games and esports grew the fastest of any media type at 22.0%, up from 8.7% growth in 2024, as in-game formats and measurement mature. Out-of-home (+2.2%) and B2B media (+3.1%) grew modestly, while newspaper and consumer magazines fell 3.5%, extending a multi-year decline, and music, radio and podcast advertising grew just 1.3%.
| Media type | 2024 vs 2025 growth | Direction | Likely driver |
|---|---|---|---|
| Internet advertising | +13.9% | Up | Video, social, commerce media scale |
| Video games and esports | +22.0% | Up sharply | In-game formats, better measurement |
| B2B media | +3.1% | Up modestly | Account-based and intent data maturing |
| Out-of-home | +2.2% | Up modestly | Digital OOH and programmatic DOOH |
| Music, radio and podcast | +1.3% | Flat | Podcast growth offsetting radio decline |
| Newspaper and consumer magazine | -3.5% | Down | Continued print-to-digital migration |
| TV advertising | -13.4% | Down sharply | No 2025 cyclical demand (no election/Olympics) |
Social, commerce media and podcasts: the formats compounding underneath the totals
Two sub-formats deserve their own line because they are growing off a smaller base but compounding fast. Social media ad revenue reached USD 117.7 billion in 2025, up 32.6% and adding USD 29.0 billion in a single year, driven by creator partnerships and always-on campaign structures. Commerce media grew 18.0% to USD 63.4 billion, and podcast advertising, still small at USD 2.9 billion, grew 17.6% and has grown every year since 2015.
| Sub-format | 2025 revenue (USD B) | YoY growth | Notable driver |
|---|---|---|---|
| Social media | 117.7 | +32.6% | Creator economy, commerce integration |
| Commerce media | 63.4 | +18.0% | Retail media expanding off-site and in-store |
| Podcast | 2.9 | +17.6% | Consistent growth every year since 2015 |
Where budget hasn't caught up: the marketing mix model blind spots
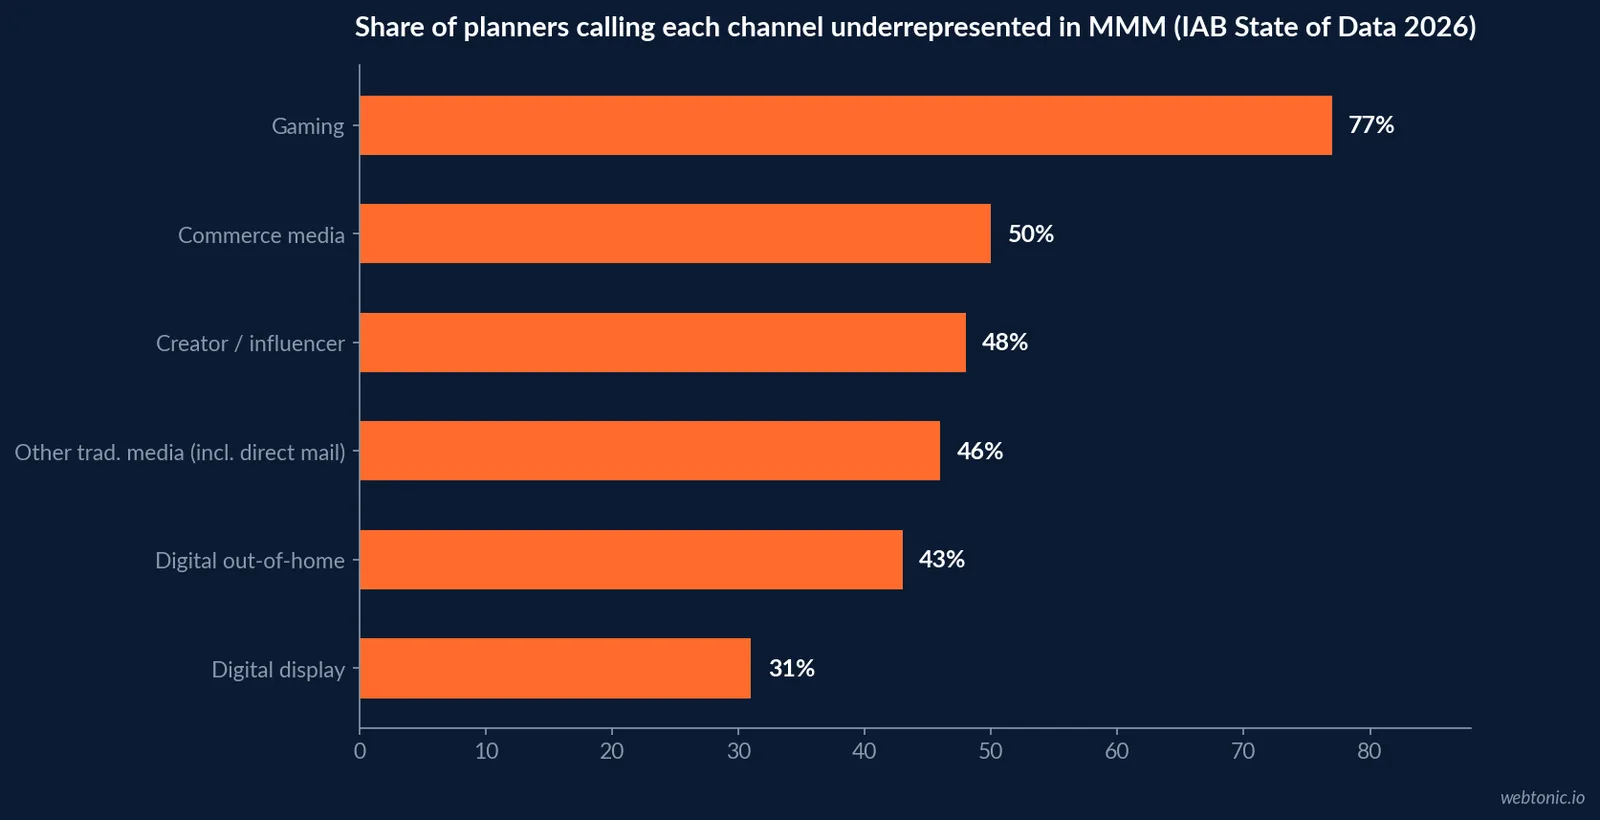
IAB's State of Data 2026 study asked buy-side planners which channels their marketing mix models underrepresent relative to where they believe performance actually happens. 77% named gaming, the single largest gap, followed by commerce media at 50%, creator and influencer marketing at 48%, and other traditional media including direct mail at 46%. Even the most "measurable" channels are not immune: 31% still call digital display underrepresented.
That gap matters for budget-setting because MMM output is what typically anchors the next planning cycle's allocation. Planners in the same study said that if AI-enhanced measurement made these gaps visible and trusted, they would shift budget toward underrepresented channels by an average of 5.6%, which applied to current market levels represents USD 14.5 billion to USD 26.3 billion in reallocated or incremental spend.
| Channel | % saying it's underrepresented in MMM | Budget implication |
|---|---|---|
| Gaming | 77% | Largest gap between attention and allocated budget |
| Commerce media | 50% | Retail media growing faster than models can track |
| Creator / influencer marketing | 48% | Always-on creator spend still under-modeled |
| Other traditional media (radio, print, OOH, direct mail) | 46% | Legacy channels undervalued by digital-first models |
| Digital out-of-home (DOOH) | 43% | Programmatic DOOH still maturing in MMM inputs |
| Digital display | 31% | Even the most measurable channel has a residual gap |
Why video is winning: the platform data behind the format
The format-level acceleration in video is not an IAB estimate in isolation, it shows up inside individual platforms' own numbers too. Alphabet's 2025 Form 10-K reports YouTube ads revenue growing from USD 36.147 billion in 2024 to USD 40.367 billion in 2025, an 11.7% increase, on top of a base that was already the largest single video ad seller. That kind of platform-level growth, layered onto CTV and short-form inventory across the rest of the market, is what pushes the format total to a 25.4% blended growth rate even though no single seller grows anywhere near that fast on its own.
Growth budget allocation: where the growth dollars themselves go
Media selection is downstream of a bigger allocation decision: how much of the growth budget goes to existing markets versus new products or new markets in the first place. The CMO Survey 2026 found that 56.4% of growth spend still goes to selling more into existing markets, 22.9% to developing new products, and only 14.1% to entering new markets outright. That heavy tilt toward existing markets is one reason format shifts (video over TV, programmatic over direct) move faster than genuinely new channel or market bets: most budget is being reallocated within a familiar footprint, not deployed into unfamiliar ones.
The same survey found marketing budgets sitting at 9.0% of revenue with spend growth of just 1.7%, which means most of the format shifts described above are funded by moving money between channels rather than by new budget arriving. That scarcity is also why Gartner's CMO Spend Survey, covered by Chief Marketer, found martech's share of the budget falling to a five-year low of 19.4%, down from 26.6% in 2021, freeing a few points of budget for the paid media shifts this page tracks.
| Growth spend allocation (2026) | Share | Source |
|---|---|---|
| Selling more into existing markets | 56.4% | The CMO Survey |
| Developing new products | 22.9% | The CMO Survey |
| Entering new markets | 14.1% | The CMO Survey |
| Marketing budget as share of revenue | 9.0% | The CMO Survey |
| Martech share of marketing budget | 19.4% (down from 26.6% in 2021) | Gartner via Chief Marketer |
Concentration: fewer companies are selling the inventory
Media selection is also a story about who you are buying from. The top 10 companies selling internet advertising held 84.1% of U.S. digital ad revenue in 2025, up from 76.8% in 2022. Companies ranked 11-25 held 8.3% and everyone else split the remaining 7.5%, both down from prior years. Deeper first-party data, integrated commerce ecosystems and end-to-end buying environments are the structural advantages pulling budget toward the same handful of platforms, which narrows genuine media selection even as format choice expands.
| Company tier | 2022 share | 2024 share | 2025 share |
|---|---|---|---|
| Top 10 companies | 76.8% | 80.8% | 84.1% |
| Ranked 11-25 | 16.4% | 11.0% | 8.3% |
| Remaining companies | 6.8% | 8.3% | 7.5% |
How to read this into a media plan
Treat the format table as where money is already flowing and the MMM gap table as where it arguably should. Video and programmatic are not contrarian bets anymore, they are consensus; gaming, commerce media and creator content are where a plan can still pick up attention the models underprice. Our performance creative team builds format-specific assets for exactly that gap, and our social ROI breakdown covers the platform-level detail behind the social media growth cited above. See our wider digital marketing benchmark data for how this compares against total marketing budgets, or read more about our media planning approach.
Frequently Asked Questions
Which advertising format is gaining budget share fastest?
Digital video. IAB and PwC's Internet Advertising Revenue Report for full-year 2025 found video (CTV, social video, online video and short-form) grew 25.4% year over year to USD 78.0 billion, accelerating from 19.2% growth the year before. That outpaced search at 11.0%, display at 9.8% and audio at 10.2%, and it is the format most likely to keep taking share from the rest of the media plan in 2026.
Is traditional TV still worth a line in the media plan?
The 2025 data argues for caution on scale, not for zero. TV advertising revenue fell 13.4% in 2025, reversing 6.6% growth the year before, largely because 2025 lacked the cyclical demand drivers (elections, the Olympics) that lifted 2024. Out-of-home and B2B media grew modestly (2.2% and 3.1%), while newspaper and consumer magazines extended a multi-year decline at negative 3.5%.
Where is programmatic buying actually growing?
Programmatic advertising revenue (excluding search) reached USD 162.4 billion in 2025, up 20.5% year over year and accelerating from 18.0% growth in 2024, according to the IAB/PwC report. Non-programmatic placements, by contrast, declined 13.9% to USD 18.0 billion, meaning automated buying is now capturing nearly all of the incremental dollars moving into digital formats.
Which channels do marketing mix models still underrepresent?
IAB's State of Data 2026 study found that among buy-side planners with visibility into each channel, 77% say gaming is underrepresented in their marketing mix models, followed by commerce media at 50%, creator/influencer marketing at 48%, and other traditional media including direct mail at 46%. Those are the channels most likely to be under-budgeted relative to where audiences actually are.
Is ad budget concentrating in fewer companies or spreading out?
Concentrating. The top 10 companies selling internet advertising held 84.1% of U.S. digital ad revenue in 2025, up from 76.8% in 2022, while companies ranked 11-25 and everyone else split the remaining 15.9%. Media selection increasingly means choosing among a small number of scaled platforms rather than a long tail of independent publishers.
Sources
IAB / PwC - Internet Advertising Revenue Report: Full Year 2025
IAB - Digital Ad Revenue Climbs to Nearly USD 300B (news release)
IAB / PwC - Internet Advertising Revenue Report, Full-Year 2025 (PDF)
IAB - State of Data 2026: The AI-Powered Measurement Transformation
Alphabet Inc. - Form 10-K, fiscal year 2025 (SEC EDGAR)
The CMO Survey - Highlights and Insights Report 2026
Chief Marketer - Gartner CMO Spend Survey: Budgets Reflect Increase in Consumption-Based Martech, Paid Media Spend
The Business Research Company - Programmatic Advertising Global Market Report 2026


