



Table of contents
Meta reported 3.58 billion daily active people across its Family of Apps for December 2025, while B2B weekly retention in the same period swung from 44.6% in North America to 77.9% in APAC. Both numbers are called "active users," and neither is measured the same way twice - here is how the 2026 disclosures actually line up.
Key Takeaways
- Meta reports 3.58 billion daily active people, up 7% year over year.
- Snap reports 483 million DAU and 956 million MAU for Q1 2026.
- Reddit reports 130.3 million daily active uniques, up 18% year over year.
- Reddit's weekly active uniques reached 514.6 million, up 24%.
- Pinterest reports 640 million monthly active users, its 12th record quarter.
- LinkedIn posted double-digit member growth for a fifth consecutive year.
- APAC B2B weekly retention reached 77.9% in Mixpanel's 2026 benchmark.
- North America B2B weekly retention trails at 44.6%, a 33-point gap.
- APAC one-week retention hit 8.3% against North America's 5.0%.
- APAC actions-per-user grew 70% year over year, to 407.4 actions.
- North America's B2B engagement per user declined 6% in the same period.
- Mixpanel's dataset covers 577 billion B2B events across 3.8 billion devices.
- Consumers spent 5.3 trillion hours in mobile apps in 2025, up 3.8%.
- That is roughly 3.6 hours per day per mobile user (Sensor Tower).
- Total app downloads grew just 0.8%, to nearly 150 billion.
- In-app purchase revenue reached USD 167 billion, up 10.6%.
- Non-gaming IAP revenue grew 21% YoY, overtaking games for the first time.
| Platform | Metric | Latest figure | YoY change | Period |
|---|---|---|---|---|
| Meta (Family of Apps) | Daily active people (DAP) | 3.58 billion | +7% | Dec 2025 avg |
| Snap | Daily active users (DAU) | 483 million | +5% | Q1 2026 |
| Snap | Monthly active users (MAU) | 956 million | n/a | Q1 2026 |
| Daily active uniques (DAUq) | 130.3 million | +18% | Q2 2026 | |
| Weekly active uniques (WAUq) | 514.6 million | +24% | Q2 2026 | |
| Monthly active users (MAU) | 640 million | +11% | Q2 2026 |
Why "active user" is not one definition
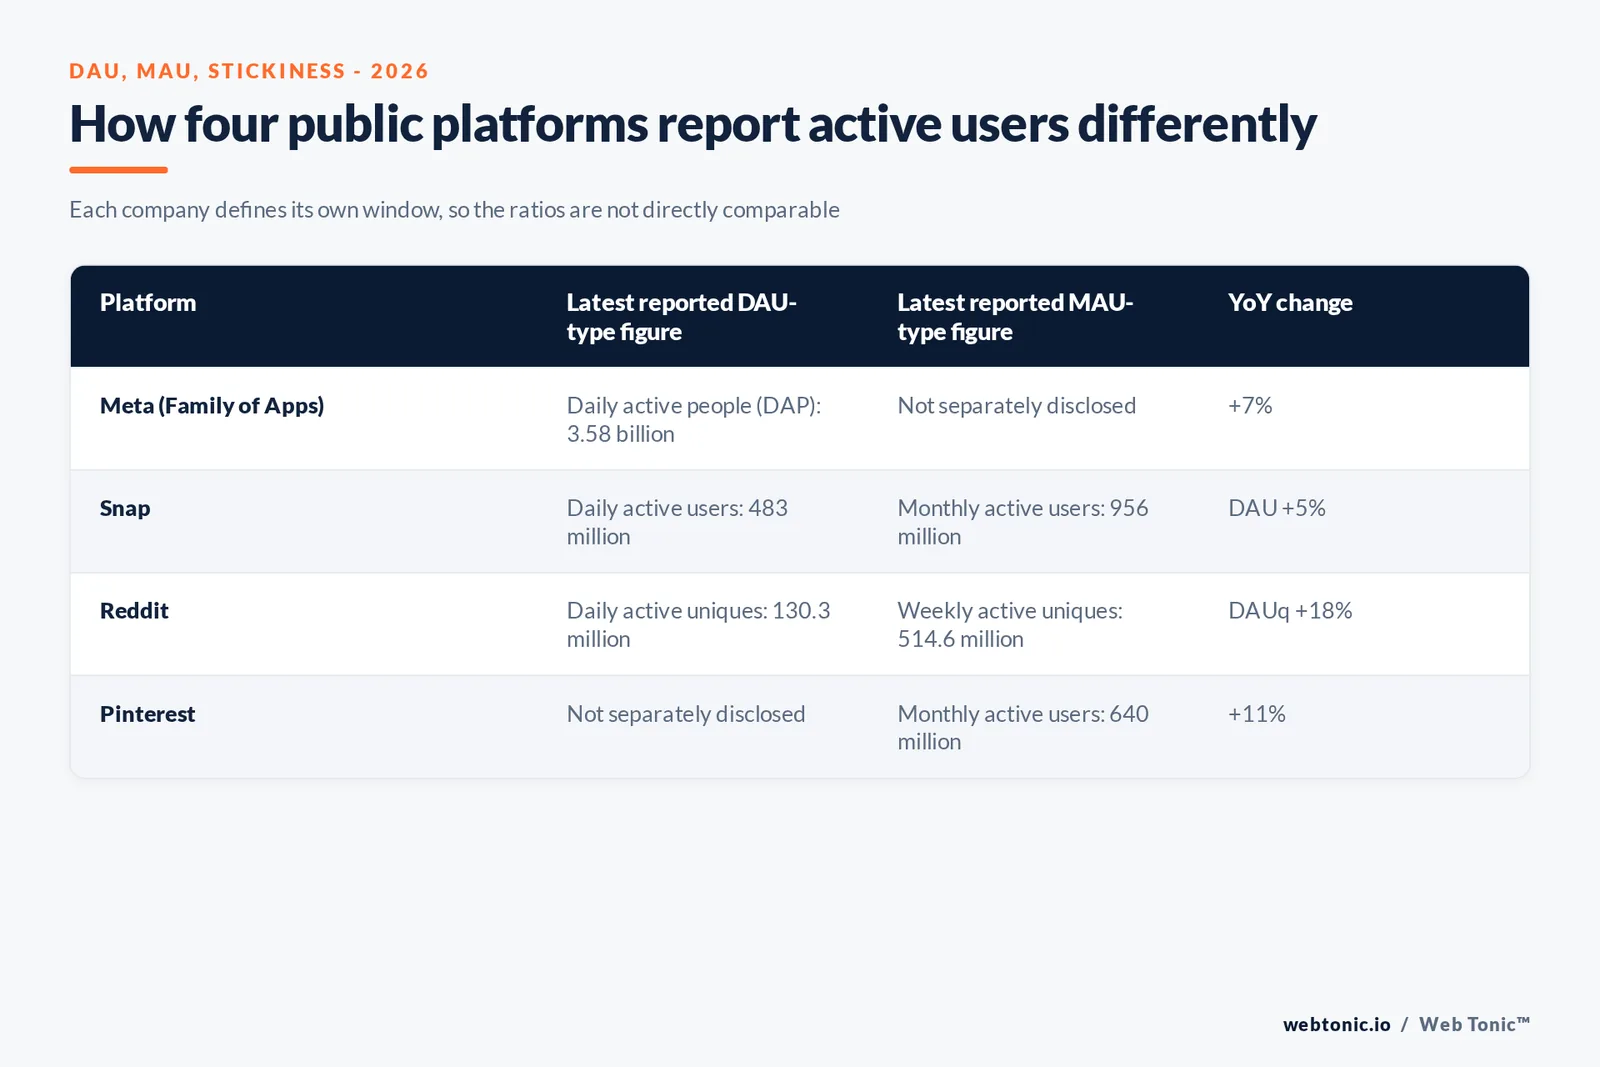
Every public company defines its own active-user metric in its own SEC filings, and the definitions do not line up. Snap's 10-Q defines a daily active user as someone who "opens the app or visits our website" during a 24-hour period, then averages that count across the quarter. Meta reports "daily active people" (DAP) across its entire Family of Apps - Facebook, Instagram, Messenger and WhatsApp combined - a fundamentally broader unit than any single app's DAU. Reddit reports "daily active uniques" (DAUq), its own internal construct. None of these numbers should be placed side by side and treated as apples-to-apples, even though press coverage routinely does exactly that.
The practical implication for analysts: when a stakeholder asks "how do we compare to [platform]'s DAU," the honest first answer is to ask which definition they mean, because the platform in question almost certainly discloses a number built on a definition your product does not share.
What the reported numbers actually say in 2026
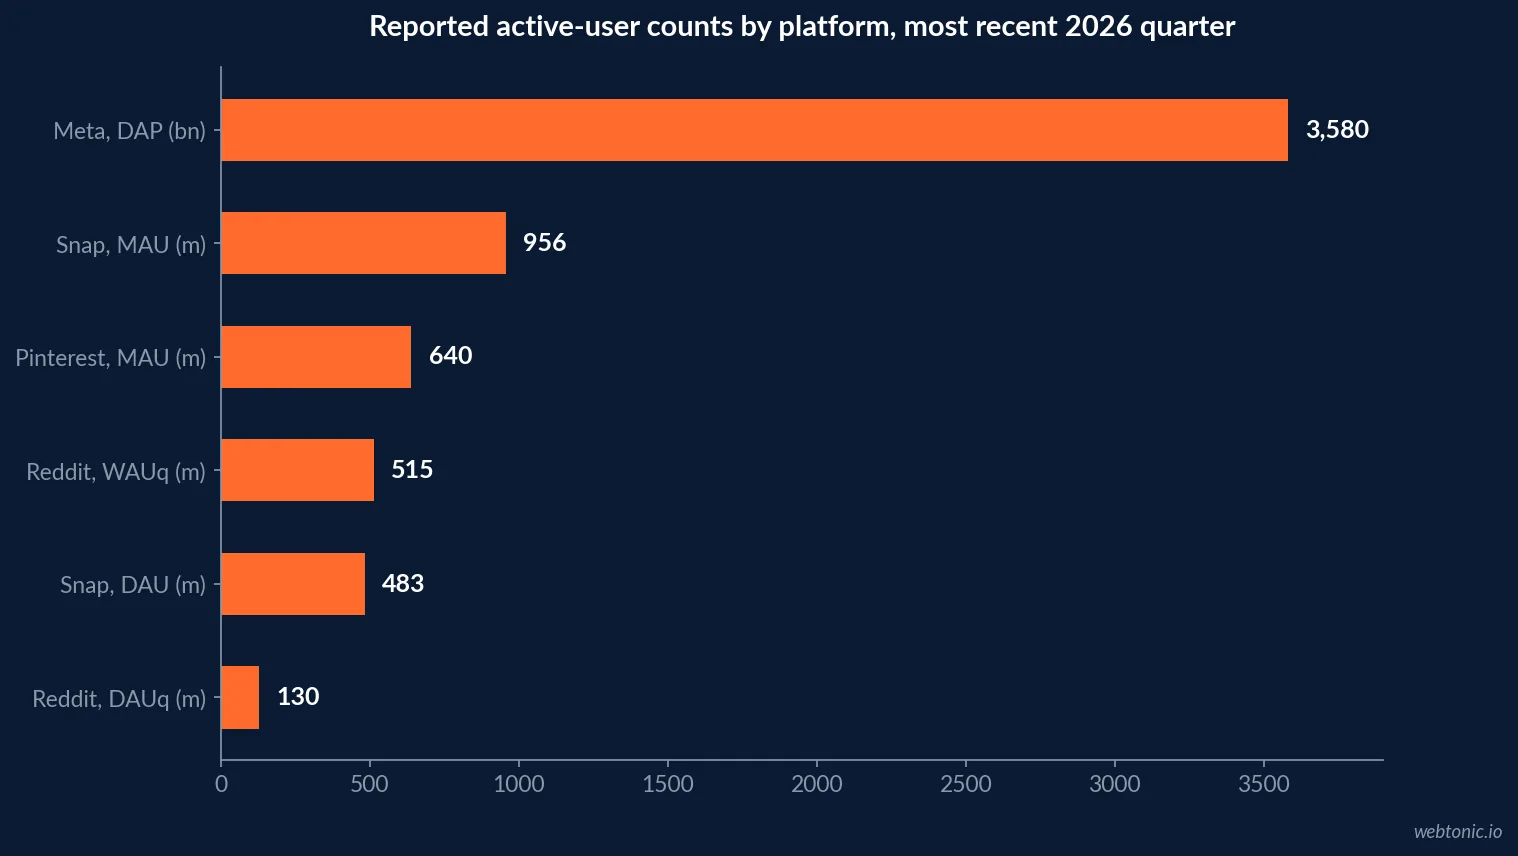
Meta's Q4 2025 results put Family daily active people at 3.58 billion on average for December 2025, a 7% year-over-year increase. Snap's Q1 2026 investor letter reported 483 million DAU and 956 million MAU, with revenue of USD 1.53 billion. Reddit's Q2 2026 shareholder letter reported 130.3 million daily active uniques, up 18%, and 514.6 million weekly active uniques, up 24%, with US DAUq growing a slower 6% against international DAUq growth of 28%. Pinterest's Q2 2026 release recorded 640 million global MAU, up 11% and its 12th consecutive quarter of record users. Microsoft's FY26 Q4 results noted LinkedIn posting double-digit member growth for a fifth consecutive year alongside 12% revenue growth.
| Company | Filing / release | Headline figure | Growth |
|---|---|---|---|
| Meta Platforms | Q4 2025 results (SEC exhibit 99.1) | 3.58bn daily active people | +7% YoY |
| Snap Inc. | Q1 2026 investor letter | 483M DAU / 956M MAU | DAU +5% YoY |
| Reddit, Inc. | Q2 2026 shareholder letter | 130.3M DAUq / 514.6M WAUq | +18% / +24% YoY |
| Pinterest, Inc. | Q2 2026 earnings release | 640M global MAU | +11% YoY |
| Microsoft (LinkedIn) | FY26 Q4 earnings | Double-digit member growth, 5th year | Revenue +12% |
Why the DAU/MAU stickiness ratio is more useful than either number alone
Raw active-user counts answer "how big," but the ratio between daily and monthly active users - often called stickiness - answers "how habitual." A platform where daily users are a small fraction of monthly users is being visited occasionally; a platform where they converge toward parity has become a daily habit. Snap's disclosed 483 million DAU against 956 million MAU implies roughly 50.5% stickiness. That is a materially different usage pattern from a product where monthly reach is ten times daily reach, even if both products report similar total MAU.
The ratio is also category-dependent in ways that make cross-industry comparison risky: messaging and social products naturally run stickier than, say, an annual tax-filing tool, so the benchmark that matters is your own product's trend over time and its direct category peers - not a headline figure lifted from an unrelated platform's earnings call.
What actually explains a 33-point retention gap
Mixpanel's 2026 State of Digital Analytics B2B benchmarks, drawn from 577 billion events across 3.8 billion devices (27% and 11% year-over-year growth respectively), found APAC leading North America across every stickiness and retention measure tracked. APAC posted 77.9% weekly retention and 8.3% one-week retention; North America recorded the lowest of both measures in the report, at 44.6% weekly and 5.0% one-week - a 33-point gap in weekly retention within the same B2B software category.
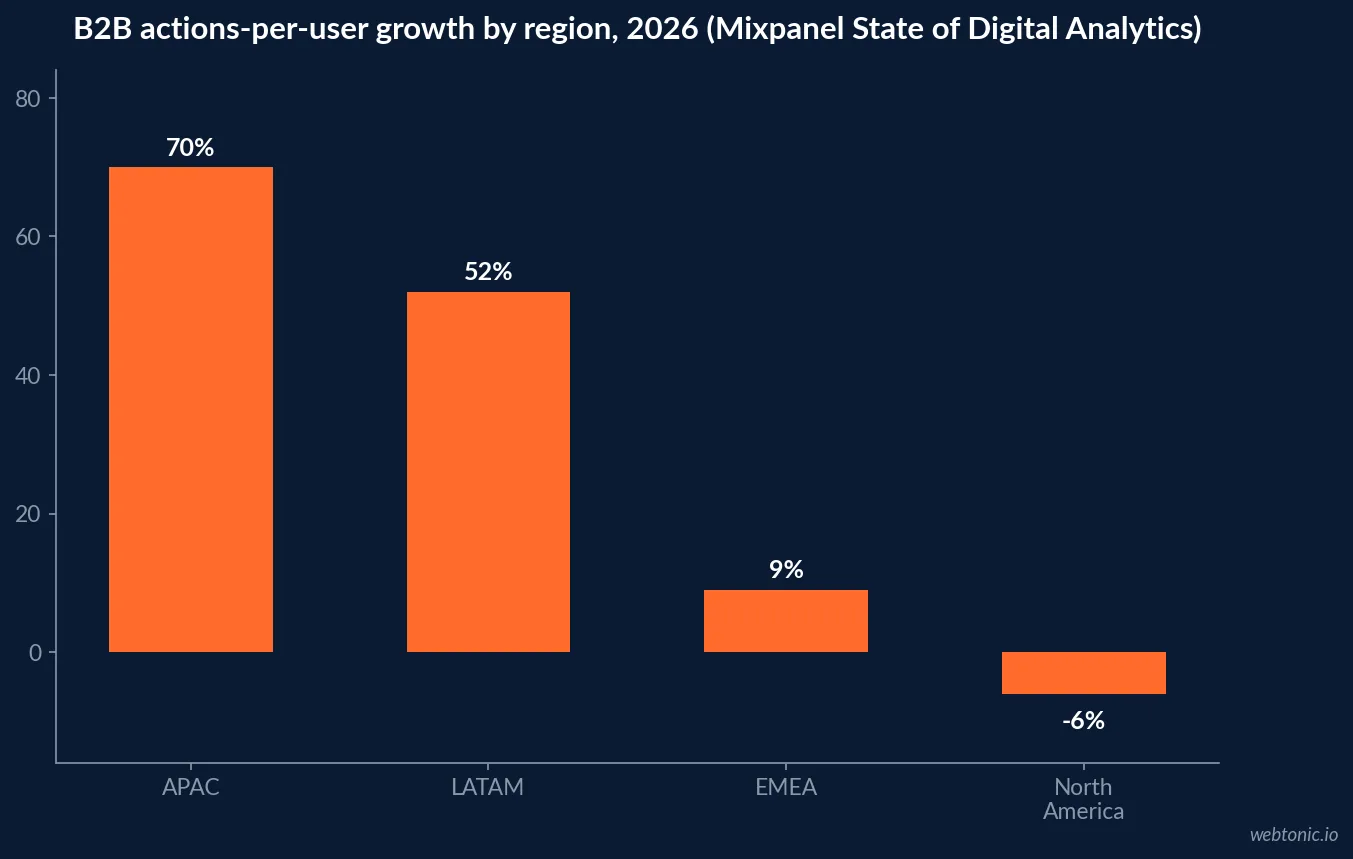
The gap correlates with engagement depth, not just raw reach: APAC actions-per-user grew 70% year over year to 407.4 actions, while North America's actions-per-user declined 6% in the same period - a pattern Mixpanel links to workflow embedding and habit formation rather than user-base size. North America still carries the largest raw daily and weekly active-user base in B2B, at 34.4 million DAU and 110.7 million WAU, both up 2% - proof that scale and stickiness are separate axes, not the same measurement.
| Region (B2B, 2026) | Weekly retention | One-week retention | Actions-per-user growth |
|---|---|---|---|
| APAC | 77.9% | 8.3% | +70% YoY |
| LATAM | Accelerating, no flat figure disclosed | Slower week-one start | +52% YoY |
| EMEA | Not separately disclosed | Not separately disclosed | +9% YoY |
| North America | 44.6% (lowest of the four) | 5.0% (lowest of the four) | -6% YoY |
Personalization is the lever that actually moves the retention gap
The regional retention gap is not primarily a product-quality gap - it is a habit-formation gap, and habit formation is largely a personalization and onboarding design problem. A market that compresses time-to-value earns daily and weekly returns faster than one that does not, which is why the 33-point spread between APAC and North America tracks so closely with the 70% versus -6% actions-per-user swing shown above: users who see relevant workflows sooner keep coming back sooner. Teams building a retention program should read this alongside our customer retention statistics, which cover the cohort-level mechanics behind exactly this kind of regional and segment divergence, and our personalization benchmark data for the workflow-design side of the same problem.
The engagement backdrop: total time spent is still climbing
Sensor Tower's State of Mobile 2026 report found consumers spent 5.3 trillion hours across iOS and Google Play apps in 2025, up 3.8% year over year - roughly 3.6 hours per day per mobile user. Total downloads grew far more slowly, up just 0.8% to nearly 150 billion, meaning engagement growth is now outrunning acquisition growth: the active-user base is spending more time, not simply getting larger. In-app purchase revenue reached USD 167 billion in 2025, up 10.6%, with non-gaming apps driving the increase - non-gaming IAP revenue grew 21% and overtook gaming IAP revenue for the first time, while gaming IAP grew a more modest 1.3%.
| Sensor Tower 2026 metric | 2025 figure | YoY change |
|---|---|---|
| Total time spent (iOS + Google Play) | 5.3 trillion hours | +3.8% |
| Time spent per user per day | ~3.6 hours | n/a |
| Total app downloads | ~150 billion | +0.8% |
| Total in-app purchase revenue | USD 167 billion | +10.6% |
| Non-gaming IAP revenue | Overtook gaming for first time | +21% |
| Gaming IAP revenue | ~USD 82 billion | +1.3% |
| What the disclosure is built from | Meta (DAP) | Snap (DAU/MAU) | Reddit (DAUq/WAUq) |
|---|---|---|---|
| Reporting window | Average for the month | Average for the quarter | Point average, quarter |
| Scope | Whole Family of Apps | Single app + website | Single platform, uniques |
| Latest headline figure | 3.58bn DAP | 483M / 956M | 130.3M / 514.6M |
| Latest YoY change | +7% | +5% DAU | +18% / +24% |
How to build an active-users dashboard that survives scrutiny
Before comparing your product's DAU or MAU to any competitor's press release, confirm you are reading the same definition - a 24-hour app-open window, a broader family-of-apps figure, or an internal "unique" construct are three different measurements wearing the same acronym. Report your own DAU/MAU stickiness ratio as a trend line against your own history and named category peers, never as a single point-in-time number against an unrelated platform. And pair active-user counts with a retention benchmark segmented by region or cohort - the 33-point regional retention gap in Mixpanel's 2026 data shows that a healthy topline user count can still be masking a serious churn problem in your largest market. Our data intelligence practice builds that layered reporting, and our customer retention benchmarks are a useful companion metric once active-user definitions are locked down.
Frequently Asked Questions
What counts as a 'daily active user' - is it the same everywhere?
No, and this is the single biggest source of bad benchmarking. Snap defines DAU as a person who opens the app or visits its website in a 24-hour period and averages that across the quarter. Meta reports 'daily active people' (DAP) across its whole Family of Apps, a broader unit than a single-app DAU. Reddit reports 'daily active uniques' (DAUq). None of these three definitions are directly comparable to each other, let alone to a mobile game's DAU, even though all three get shortened to the same three-letter acronym in casual reporting.
What are the actual 2026 DAU/MAU figures for major platforms?
Meta's Family of Apps reported 3.58 billion daily active people on average for December 2025, up 7% year over year. Snap reported 483 million DAU and 956 million MAU in Q1 2026. Reddit reported 130.3 million daily active uniques (+18% YoY) and 514.6 million weekly active uniques (+24% YoY) in Q2 2026. Pinterest reported 640 million global monthly active users in Q2 2026, up 11% and its 12th consecutive quarter of record users.
What is considered a healthy DAU/MAU stickiness ratio?
It depends entirely on category, which is why a single universal benchmark misleads more than it helps. Reddit's own reported ratio in Q2 2026 was roughly 25% (130.3M DAUq against 514.6M WAUq is already the weekly figure, and DAUq/MAUq typically runs lower still), while Snap's 483 million DAU against 956 million MAU implies roughly 50%. The number only means something compared against your own product's history and category peers, not against another platform's press release.
Why does retention vary so much by region for the same product category?
Mixpanel's 2026 State of Digital Analytics report, analyzing 577 billion B2B events across 3.8 billion devices, found APAC leading with 77.9% weekly retention against North America's 44.6% - a 33-point gap in the same product category. APAC also led in actions per user (407.4, up 70% YoY) and one-week retention (8.3% versus North America's 5.0%), suggesting the gap traces to workflow embedding and habit formation, not raw feature availability.
Is total time spent in apps still growing in 2026?
Yes, modestly. Sensor Tower's State of Mobile 2026 report found consumers spent 5.3 trillion hours across iOS and Google Play apps in 2025, up 3.8% year over year, or roughly 3.6 hours per day per mobile user. Total downloads grew more slowly, up just 0.8% to nearly 150 billion, meaning engagement growth is now outpacing new-user growth - existing active users are the ones driving the increase, not new installs.
Sources
Meta Platforms - Q4 and Full Year 2025 Results
Snap Inc. - Q1 2026 Financial Results
Reddit, Inc. - Q2 2026 Shareholder Letter
Pinterest, Inc. - Q2 2026 Earnings Presentation
Microsoft - FY26 Q4 Earnings Press Release (LinkedIn)
Mixpanel - 2026 B2B Benchmarks (State of Digital Analytics)
Sensor Tower - State of Mobile 2026


