



Table of contents
Cart abandonment, checkout abandonment, form abandonment and onboarding drop-off are four separate metrics that analysts routinely report as one number. Each measures a different funnel moment, carries a different 2025-2026 benchmark, and gets fixed a different way - confusing them is the fastest way to optimize the wrong step.
Key Takeaways
- Average cart abandonment sits at 70.22% across 50 studies (Baymard).
- 42% of US shoppers abandon simply because they are browsing, not buying.
- 40% cite extra costs - shipping, tax and fees - as too high.
- 20% abandon over delivery being too slow.
- 18% abandon when forced to create an account.
- 17% abandon a checkout that is too long or complicated.
- The average US checkout shows 23.48 form elements against an ideal of 12.
- Form completion (Starter-to-Completion) averages 51.71% across industries (Zuko).
- Forex Trading forms convert at 67.35%, the strongest industry tracked.
- Property forms convert at just 34.55%, the weakest industry tracked.
- View-to-completion form abandonment runs 45-55% once page-loads are counted.
- Only 34% of engaged form starters finish once a field is touched (starter model).
- Redesigning checkout can lift conversion 35.26% on large e-commerce sites.
- Abandoned cart email flows earn USD 3.65 revenue per recipient, the highest of any flow.
- Top 10% of brands reach USD 28.89 per recipient on that same flow.
- Desktop out-converts mobile in every tracked industry except gambling.
- 90% of users have stopped using an app entirely due to poor performance.
| Abandonment metric | 2025-2026 benchmark | What it counts | Source |
|---|---|---|---|
| Cart abandonment | 70.22% average | Anyone who ever added an item to cart | Baymard, 50-study average |
| Checkout abandonment reasons (excl. browsing) | 40% cite cost, 17% cite length | Shoppers who started paying | Baymard checkout study |
| Form abandonment, view-to-completion | 45-55% | Everyone who saw the form load | Zuko / Baymard |
| Form abandonment, starter-to-completion | 34% (66% complete) | Only those who touched a field | Baymard #GC050 |
| Form completion by industry, overall | 51.71% | 93M+ tracked form sessions | Zuko industry benchmarking |
| Onboarding drop-off | Tracked per step, not one rate | Signup/trial/first-use flow | Product analytics practice |
Why "abandonment rate" is not a single number
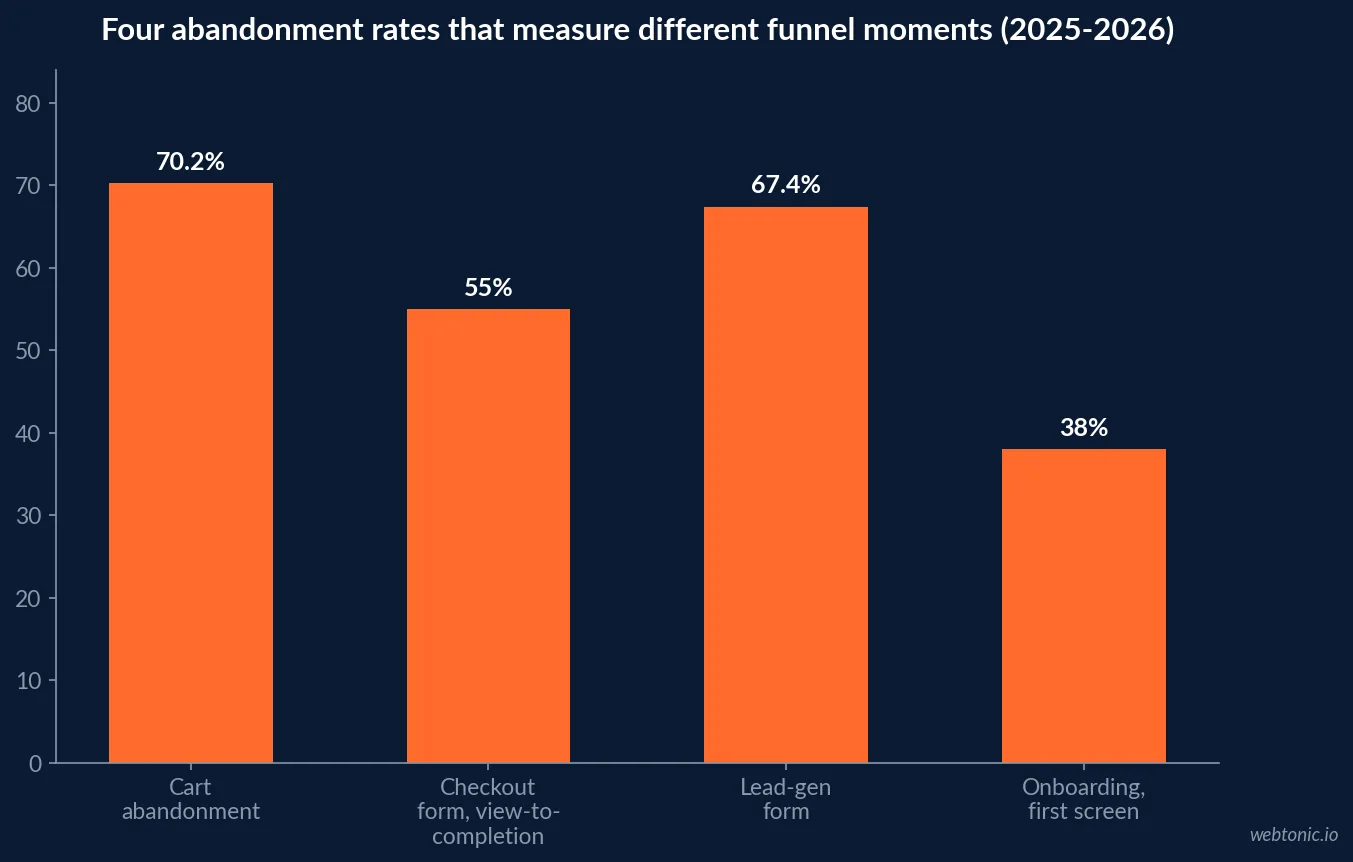
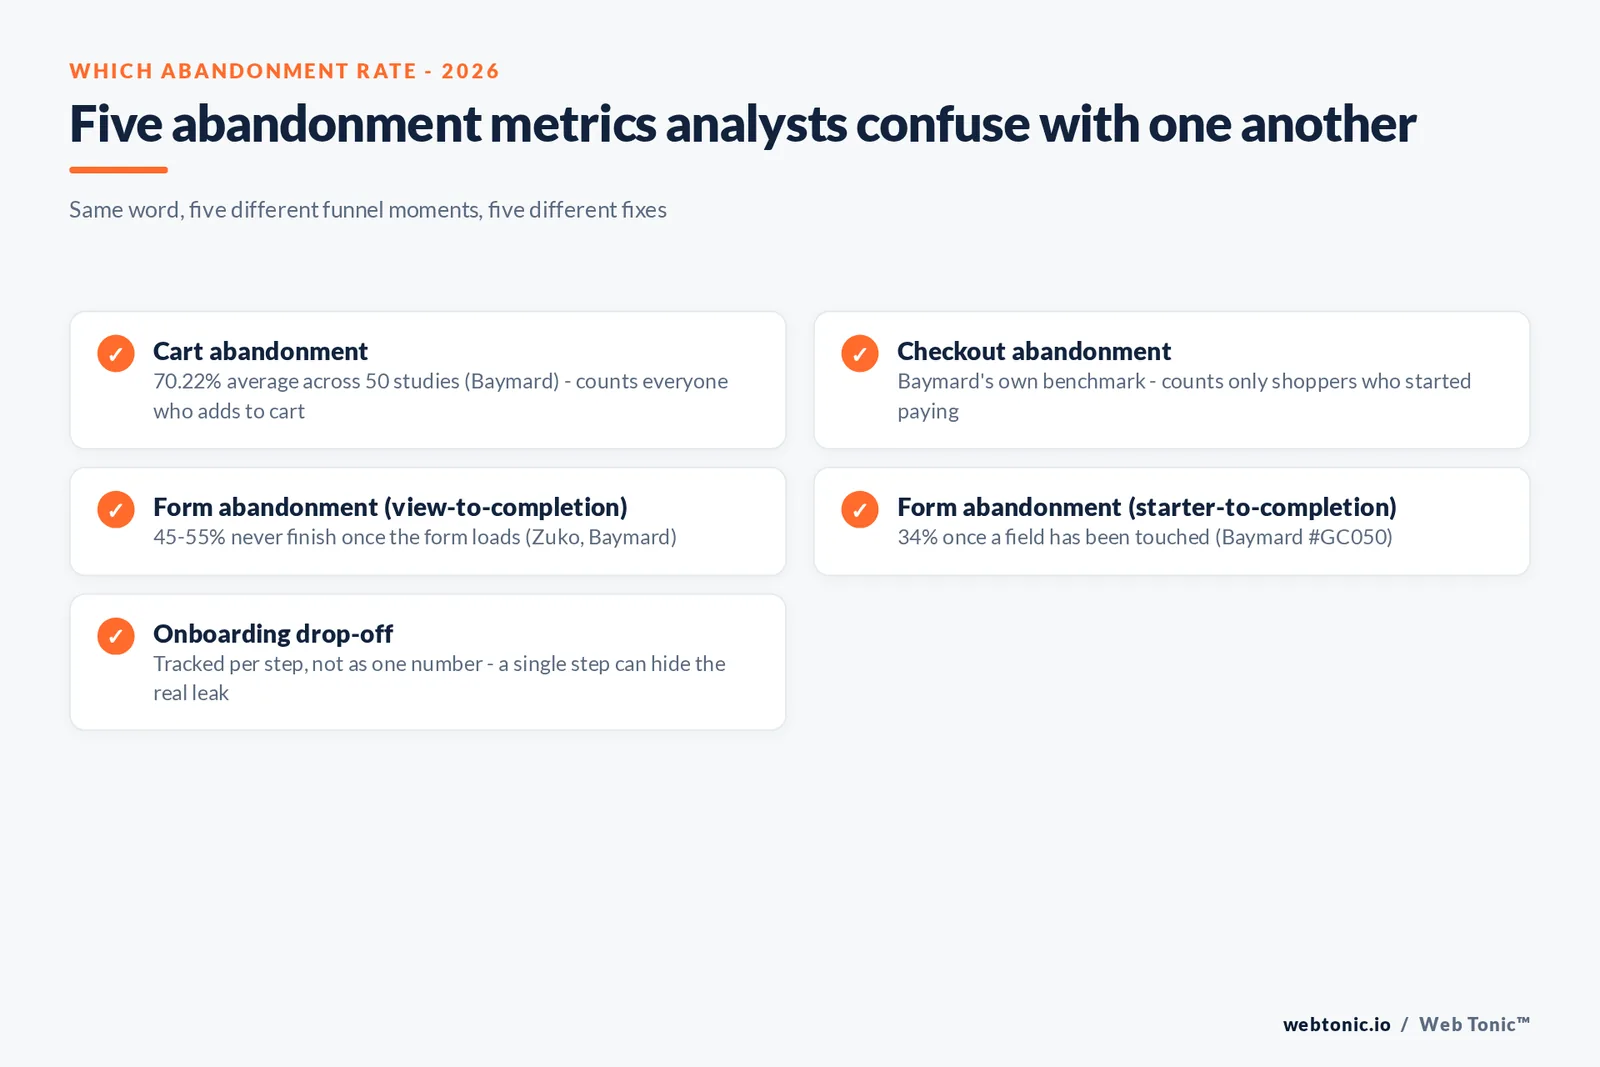
The word gets applied to at least four distinct funnel moments, and each one answers a different business question. Cart abandonment asks how many people who ever added a product never bought it - a wide net that includes casual browsers. Checkout abandonment narrows to people who already started paying. Form abandonment splits again by denominator: whether you count everyone who saw the form (view-to-completion) or only people who engaged with at least one field (starter-to-completion). Onboarding drop-off is structurally different again - it is measured per step of a sequence, not as one aggregate rate, because the step that loses the most users is the one that needs the fix.
An analyst who reports "our abandonment rate is 70%" without naming which of these four they mean has told leadership almost nothing actionable. The fix for cart abandonment (remove friction before checkout even starts) is often the opposite of the fix for form abandonment (shorten what is already in front of the user).
Cart abandonment: the widest, most-cited number
Baymard Institute has tracked the global average online shopping cart abandonment rate for 13 years, compiling 50 separate studies published between 2006 and 2025 into a running average of 70.22%. Individual underlying studies range from the high 50s to the low 80s depending on how each vendor defines "cart" and "abandon," which is exactly why a single standalone study should never be cited as the definitive figure - the meta-average is the more honest number, and it has barely moved in a decade.
| Cart abandonment study (selected) | Reported rate | Year |
|---|---|---|
| Uptain | 71.72% | 2025 |
| SalesCycle | 79.53% | 2023 |
| Fresh Relevance | 68.70% | 2022 |
| Baymard 50-study average | 70.22% | 2006-2025, updated Sep 2025 |
| Forrester Research (historical low point) | 55.00% | 2010 |
What analysts should isolate before optimizing checkout
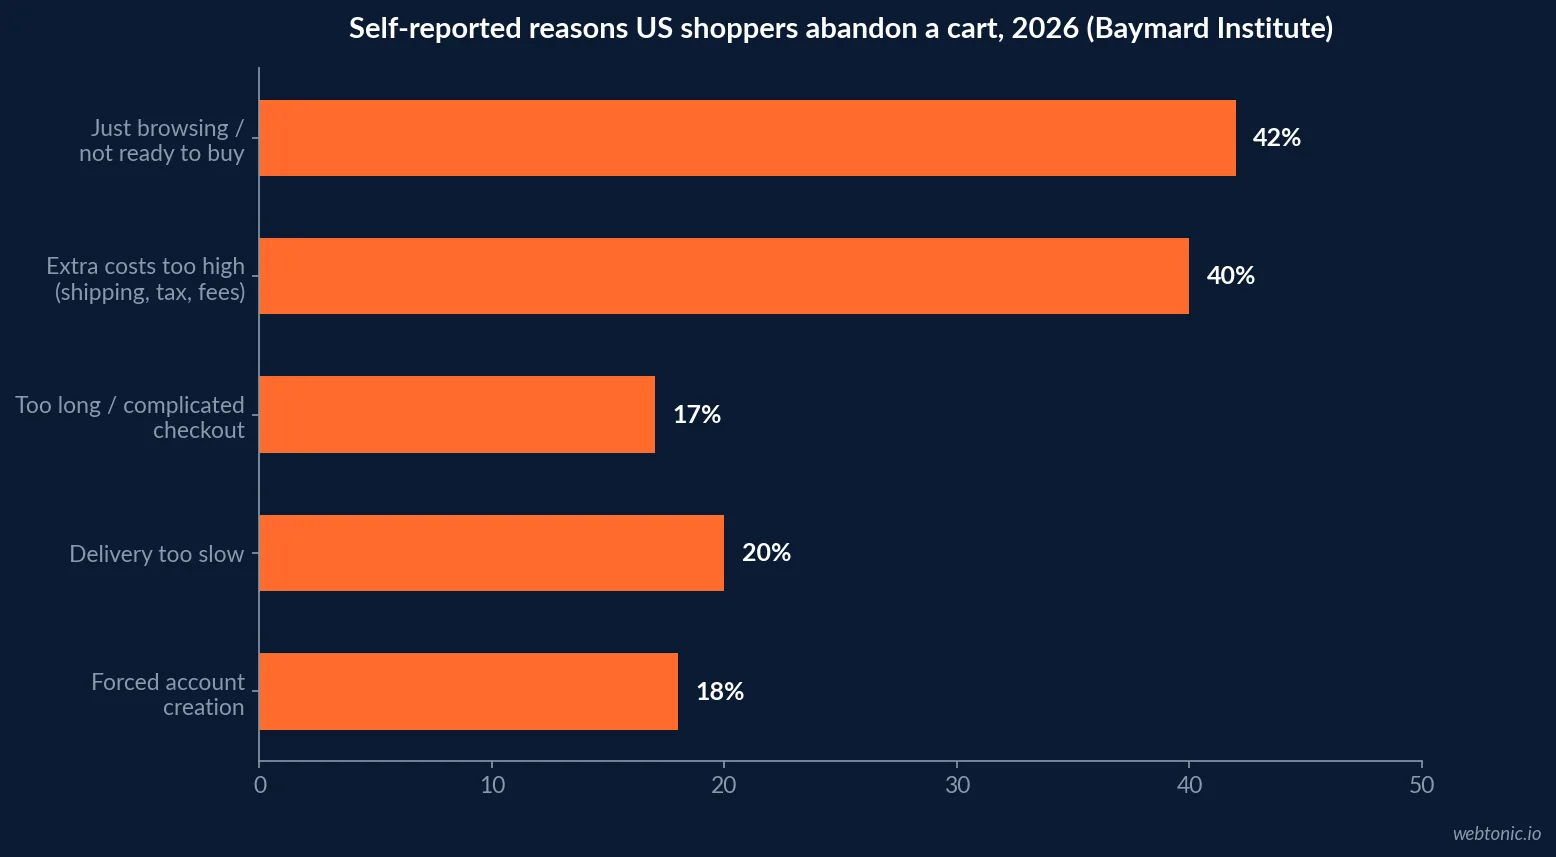
Baymard's revised Checkout Usability study - built on 272 moderated test sessions, eye-tracking across live checkout flows, benchmarking of more than 850 checkout steps and nine quantitative studies totalling 11,777 participants - separates the unavoidable from the fixable. 42% of US shoppers abandoned a cart in the past quarter because they were "just browsing / not ready to buy" - a segment that is nearly impossible to convert through checkout design because most of them never reach checkout at all. Excluding that group, the resolvable reasons are concrete: 40% cite extra costs (shipping, tax, fees) being too high, 20% cite delivery being too slow, 18% cite being forced to create an account, and 17% cite a checkout that is too long or complicated.
That last figure comes with a build-vs-benchmark gap worth flagging to any team: Baymard's testing shows an ideal checkout can run as few as 12 form elements (7 fields, 2 checkboxes, 2 drop-downs, 1 radio interface), yet its benchmark database shows the average US checkout displays 23.48 form elements by default - a 20-60% reduction is usually available before any redesign even touches visual polish.
| Reason for abandonment (excl. browsing) | Share of US shoppers |
|---|---|
| Extra costs (shipping, tax, fees) too high | 40% |
| Delivery too slow | 20% |
| Forced to create an account | 18% |
| Checkout too long / complicated | 17% |
| Just browsing / not ready to buy (unavoidable segment) | 42% |
Form abandonment is two different numbers, not one
Zuko's form optimization database, built from more than 93 million tracked form sessions across 16 industries, reports an overall Starter-to-Completion conversion rate of 51.71% and a View-to-Completion rate of 37.2% on desktop against 31.3% on mobile. The gap between those two denominators is the whole story: most abandonment happens before a user ever touches a field, which is a page-load and intent problem, not a form-design problem.
Industry spread is wide. Forex Trading forms convert at 67.35% overall - though Zuko notes many of those are multi-step forms logged as single forms, so the true completion rate is closer to 20-30% - while Property forms convert at only 34.55% and Media forms at 36.29%. Desktop out-converts mobile in every tracked industry except gambling.
| Industry (Zuko benchmark) | Desktop conversion | Mobile conversion | Overall conversion |
|---|---|---|---|
| Forex Trading | 72.38% | 63.84% | 67.35% |
| Financial Services | 60.75% | 53.71% | 58.38% |
| Travel | 61.58% | 59.43% | 60.51% |
| Ecommerce | 54.28% | 49.44% | 50.95% |
| Property | 40.86% | 31.09% | 34.55% |
| Media | 36.07% | 34.52% | 36.29% |
| All forms tracked (93M+ sessions) | 54.48% | 47.53% | 51.71% |
Trust and payment friction: the reasons that hide inside "checkout too long"
A Baymard report distributed via Amazon on checkout optimization breaks the "too complicated" complaint down further: 19% of surveyed users had abandoned an order in the past quarter because they did not trust the site with their credit card information, and a further share abandoned because there were not enough payment options available. Neither of those two reasons shows up if an analyst only tracks a single blended checkout-abandonment percentage - they only surface once the reason codes are broken out, which is the same argument made above for separating cart, checkout and form abandonment in the first place.
The lesson generalizes: every abandonment rate should be reported with its top three to five reason codes attached, not as a bare percentage. A 70% cart abandonment rate caused mostly by browsing intent needs a different roadmap than one driven by trust or payment-option gaps.
| Checkout-stage friction reason | Share of abandoning users | Source |
|---|---|---|
| Distrust of site with credit card information | 19% | Baymard checkout optimization report |
| Not enough payment options offered | 8% | Baymard checkout optimization report |
| Checkout too long / complicated | 17% | Baymard #GC050 |
| Forced account creation | 18% | Baymard #GC050 |
Onboarding drop-off: measured per step, not as one rate
Unlike cart or form abandonment, onboarding drop-off is only useful measured step by step: users dropping at step N divided by users starting step N. Reporting one blended "onboarding abandonment rate" for an entire signup flow hides exactly which screen is losing people - a flow that loses 5% at each of six steps produces a very different retention curve, and a very different fix, than one that loses 40% at a single first screen and almost nothing after. Analysts building this metric should instrument every step individually before they ever compute a top-line percentage, and should pair it with the retention data that shows whether the users who do make it through onboarding actually stay.
What fixing abandonment is actually worth
The return on closing these gaps is measurable and channel-specific. Baymard's UX research finds that the average large e-commerce site can lift its conversion rate by 35.26% simply by redesigning its checkout process, and that 90% of users have stopped using an app entirely due to poor performance - abandonment, at the extreme, becomes churn.
On the recovery side, Klaviyo's 2024 Benchmark Report, analyzing over 143,000 abandoned cart email flows sent in 2023, found these flows deliver the highest average revenue per recipient of any automated flow at USD 3.65 - 37.74% higher than the next-best flow - with the top-performing 10% of brands reaching USD 28.89 per recipient. Industries like automotive and hardware & home improvement post even stronger results, with top performers generating between USD 52.35 and USD 75.66 per recipient.
| Recovery metric (abandoned cart email flow) | Figure | Source |
|---|---|---|
| Average revenue per recipient, all brands | USD 3.65 | Klaviyo 2024 Benchmark Report |
| Average conversion (placed order) rate | 3.33% | Klaviyo 2024 Benchmark Report |
| Top 10% of brands, revenue per recipient | USD 28.89 | Klaviyo 2024 Benchmark Report |
| Top 10%, hardware & home improvement | USD 75.66 | Klaviyo 2024 Benchmark Report |
| Checkout redesign conversion lift, large sites | 35.26% | Baymard UX research |
The recovery economics hold up at the channel-mix level too. Omnisend's 2026 ecommerce marketing report, built from 150,000 brands and 27 billion emails sent, found automations - cart abandonment, browse abandonment and welcome flows chief among them - made up just 2% of email sends yet drove 30% of revenue, earning 16 times more per send than scheduled campaigns by reaching shoppers at high-intent moments. That gap is the clearest argument for treating abandonment recovery as its own budget line rather than an afterthought bolted onto a broader email program.
How to build a defensible abandonment dashboard
Report cart abandonment, checkout abandonment, form abandonment and onboarding drop-off as four separate rows, never as one blended figure. Name the denominator each time - "of everyone who added to cart," "of everyone who started paying," "of everyone who saw the form" - so a stakeholder cannot compare a 70% cart figure against a 34% form figure and conclude checkout is somehow healthier. Then pair each rate with its own recovery metric: email flow revenue per recipient for cart abandonment, step-level drop-off for onboarding, and completion rate by device for forms. Our growth marketing team builds that kind of layered measurement before touching a single email template or checkout field, and our breakdown of conversion rate benchmarks is a useful companion once the abandonment side of the funnel is under control.
Frequently Asked Questions
Is 'abandonment rate' one metric or several?
Several, and treating them as one hides the real problem. Cart abandonment (70.22% average, Baymard) counts anyone who ever added an item to a cart. Checkout abandonment counts only shoppers who started the payment flow. Form abandonment splits again into starter-to-completion (34% abandon after touching a field, per Baymard's #GC050 study) and view-to-completion (45-55% abandon after the form merely loads, per Zuko's benchmarking database). Onboarding drop-off is tracked per step, not as one number. An analyst reporting a single 'abandonment rate' has usually picked the easiest one to pull, not the one that explains the revenue gap.
What is the actual average cart abandonment rate in 2026?
70.22%, the average Baymard Institute calculates across 50 separate studies published between 2006 and 2025, last updated September 2025. Individual studies in that set range from the high 50s to the low 80s depending on methodology, so 70.22% is a meta-average, not a single survey result - which is exactly why citing one standalone study as 'the' abandonment rate is misleading.
Why do shoppers actually abandon, once you exclude window-shopping?
Baymard's checkout usability research finds 42% of US shoppers abandoned a cart in the past quarter simply because they were browsing or not ready to buy - an unavoidable segment. Once that group is excluded, the resolvable reasons cluster around cost and friction: 40% cite extra costs like shipping, tax and fees being too high, 20% cite slow delivery, 18% cite forced account creation, and 17% cite a checkout that is too long or complicated - despite an ideal checkout needing as few as 12 form elements against an industry average of 23.48.
Do form abandonment rates vary much by industry?
Substantially. Zuko's benchmarking database, drawn from over 93 million tracked form sessions across 16 industries, shows overall Starter-to-Completion conversion at 51.71%, but Forex Trading converts at 67.35% while Property forms convert at only 34.55% and Media forms at 36.29%. Desktop consistently outperforms mobile in every industry except gambling.
Does fixing abandonment actually pay for itself?
Yes, and the return is measurable per channel. Klaviyo's 2024 Benchmark Report, built from over 143,000 abandoned cart email flows, found these flows deliver the highest average revenue per recipient of any automated flow at USD 3.65, with the top 10% of brands reaching USD 28.89 - roughly 8x the average, showing most of the value sits in execution quality, not just having the flow switched on.
Sources
Baymard Institute - 50 Cart Abandonment Rate Statistics
Baymard Institute - Reasons for Cart Abandonment / Checkout Usability Report
Baymard Institute - 40+ UX Statistics
Zuko - Form and checkout industry benchmarking
Klaviyo - Abandoned Cart Benchmark Report
Klaviyo - 2026 Email Marketing Benchmarks by Industry
Baymard Institute - Checkout Optimization & Reducing Abandonments
Omnisend - 2026 Ecommerce Marketing Report


