Table of contents
Pay per click (PPC) is an advertising model where the platform charges you only when someone clicks your ad — impressions are free, attention is not.
This page takes the money angle: what triggers a charge, what a click costs, and how much budget you actually need before a campaign can prove itself.
Key Takeaways
- The average search click costs $5.42 across 23 industries, with average conversion rate 8.18% and cost per lead $66.69.
- Clicks are not priced evenly: legal averages $9.87 per click while arts and entertainment averages $1.63 — a 6x spread.
- Google will never charge you more than your average daily budget × 30.4 in a month, but a single day can overdeliver by up to 2x.
- Your price per click is set by three inputs, not one: your bid, your ad and landing page quality (scored 1–10), and how crowded the auction is.
- Google handles 91.25% of global search, so a first PPC budget almost always starts there before Microsoft's 4.68%.
- A realistic learning budget is 50–100 clicks per week per campaign — at a $5 click, that is $1,000–$2,000 a month minimum.
New to the model itself? Start with our primer on what PPC is and how the ad auction works, then come back here for the numbers.
What "pay per click" actually charges you for
In a pay-per-click deal, the advertiser and the platform agree on a single billable event: the click. The ad can be served ten thousand times without costing a cent. The moment someone taps the headline and lands on your site, the meter runs.
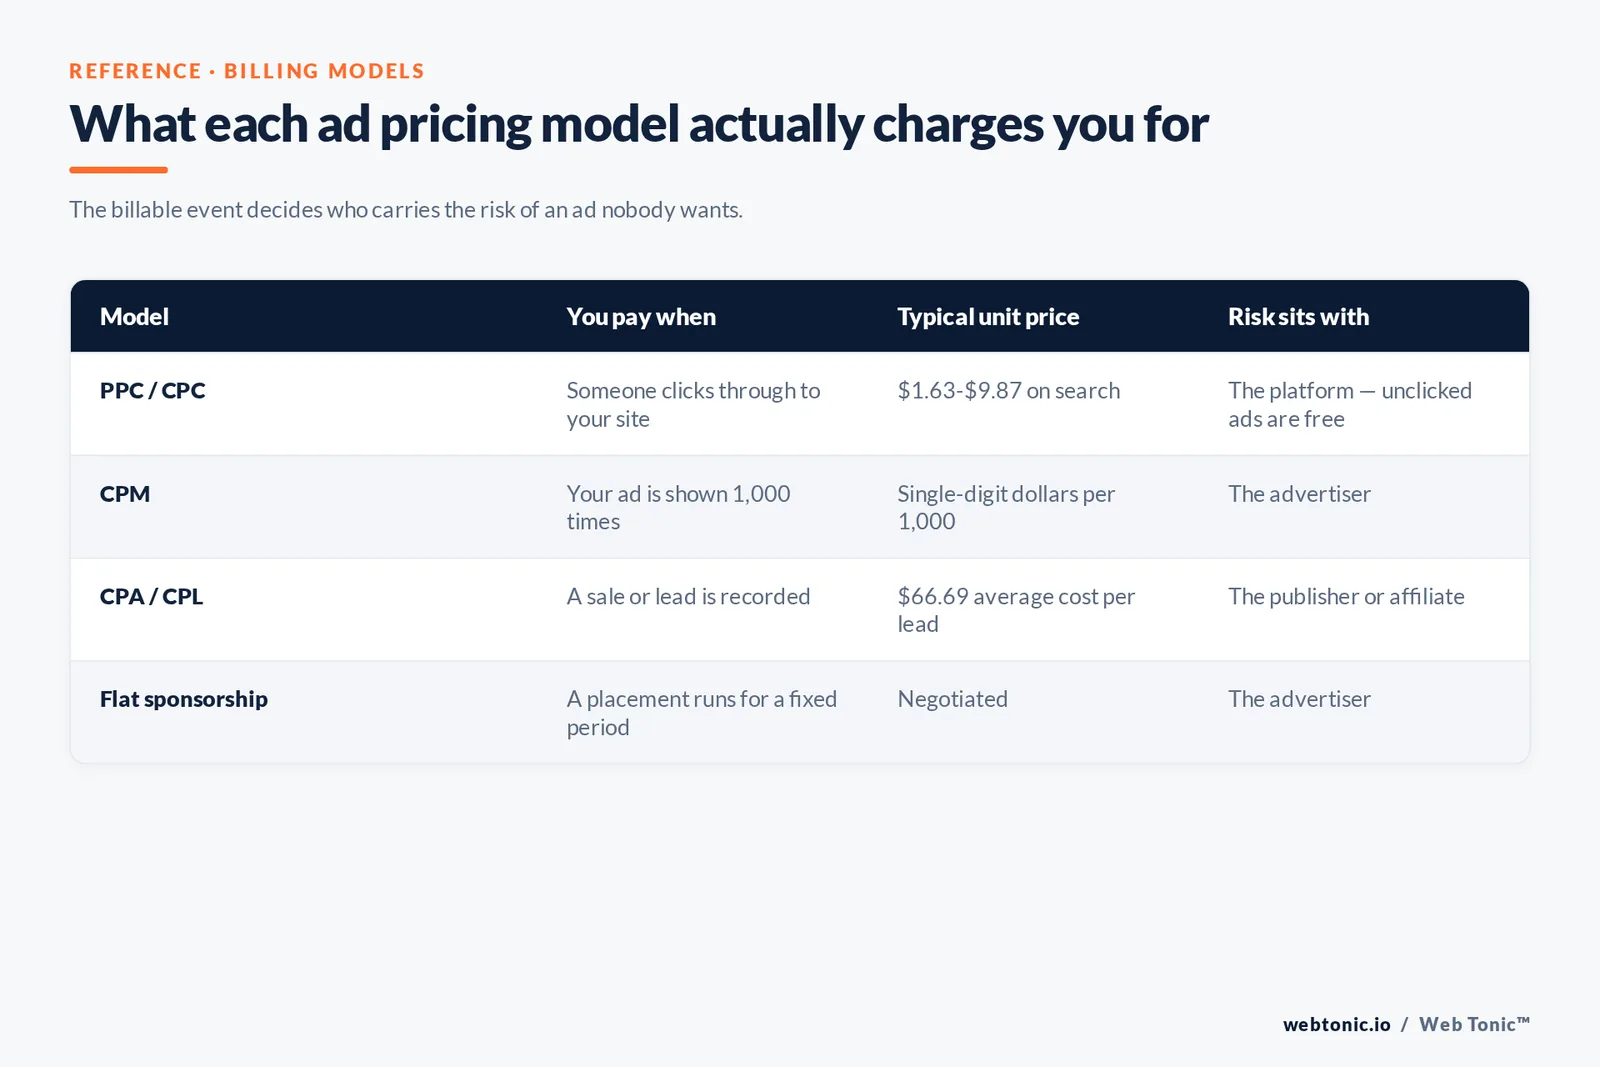
That is different from every other pricing model in advertising, and the difference is where budgets get won or lost:
| Model | You pay when | Typical unit price | Risk sits with |
|---|---|---|---|
| PPC / CPC | Someone clicks through to your site | $1.63–$9.87 on search | The platform (unclicked ads are free) |
| CPM | Your ad is shown 1,000 times | Single-digit dollars per 1,000 | The advertiser |
| CPA / CPL | A sale or lead is recorded | $66.69 average cost per lead | The publisher or affiliate |
| Flat sponsorship | A placement runs for a fixed period | Negotiated | The advertiser |
Because the click is the billable unit, PPC quietly shifts a lot of your work upstream. You are not buying customers; you are buying visits, at a price you only partly control, and everything after the click — your offer, page speed, form length — decides whether that visit was worth the money. The official return-on-investment definition Google publishes is deliberately blunt about it: ROI is net profit over cost, and ad spend is only one line in that equation.
The three numbers that set your price per click
Advertisers new to paid search assume the highest bidder wins and pays their bid. Neither half is true. Google's own description of how the ad auction works walks through a four-step process: match keywords, drop ineligible ads, drop ads below the quality thresholds, then order what is left by Ad Rank.
Ad Rank blends your bid with the expected click-through rate, ad relevance and landing page experience — the same three components behind the 1–10 Quality Score diagnostic. Worth knowing: Google states plainly that Quality Score is not itself an auction input. It is a readout of the signals that are.
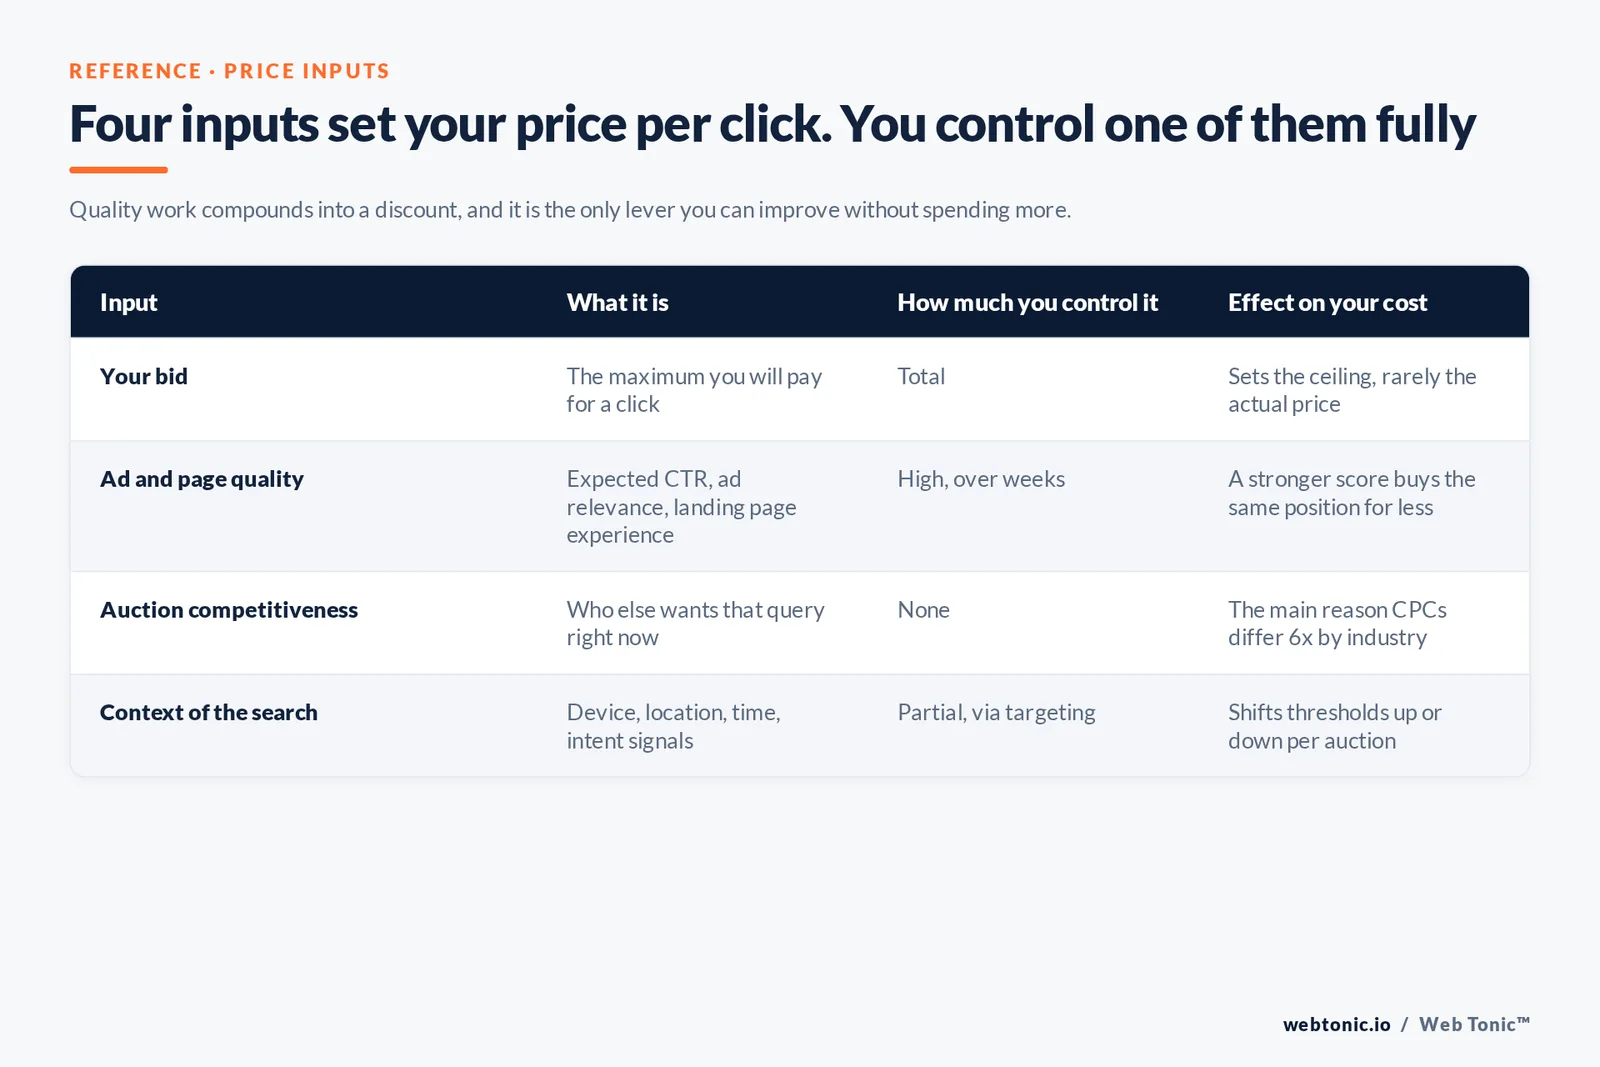
| Input | What it is | How much you control it | Effect on your cost |
|---|---|---|---|
| Your bid | The maximum you will pay for a click | Total | Sets the ceiling, rarely the actual price |
| Ad and page quality | Expected CTR, ad relevance, landing page experience | High, over weeks | A stronger score buys the same position for less |
| Auction competitiveness | Who else wants that query right now | None | The main reason CPCs differ 6x by industry |
| Context of the search | Device, location, time, intent signals | Partial, via targeting | Shifts thresholds up or down per auction |
The practical takeaway is uncomfortable for anyone hoping to buy their way to the top: two advertisers can sit in the same ad slot and pay very different amounts per click. Quality work compounds into a discount, and it is the only lever in that table you can improve without spending more.
What a click costs in 2026
Benchmark data across 23 categories on Google and Microsoft search puts the all-industry average at $5.42 per click, 6.64% click-through rate, 8.18% conversion rate and $66.69 per lead. Earlier benchmark cycles averaged $3.53, so the direction of travel is clear: clicks get more expensive every year, and efficiency has to come from conversion rate rather than cheaper traffic.
| Category | Average CPC | What that implies at 8% conversion |
|---|---|---|
| Legal services | $9.87 | About $123 per lead |
| Home improvement | $8.33 | About $104 per lead |
| Dentists and dental services | $8.00 | About $100 per lead |
| All industries (average) | $5.42 | $66.69 measured cost per lead |
| Travel | $2.14 | About $27 per lead |
| Restaurants and food | $2.05 | About $26 per lead |
| Arts and entertainment | $1.63 | About $20 per lead |
Averages hide the tail. The most expensive commercial keywords on record have traded at over $1,000 a click, which only makes sense when a single closed case or contract is worth six figures. Independent analysis of what Google Ads really costs reaches the same conclusion from a different dataset: your industry sets the floor, your account quality sets how far above it you land.
How budgets actually get spent
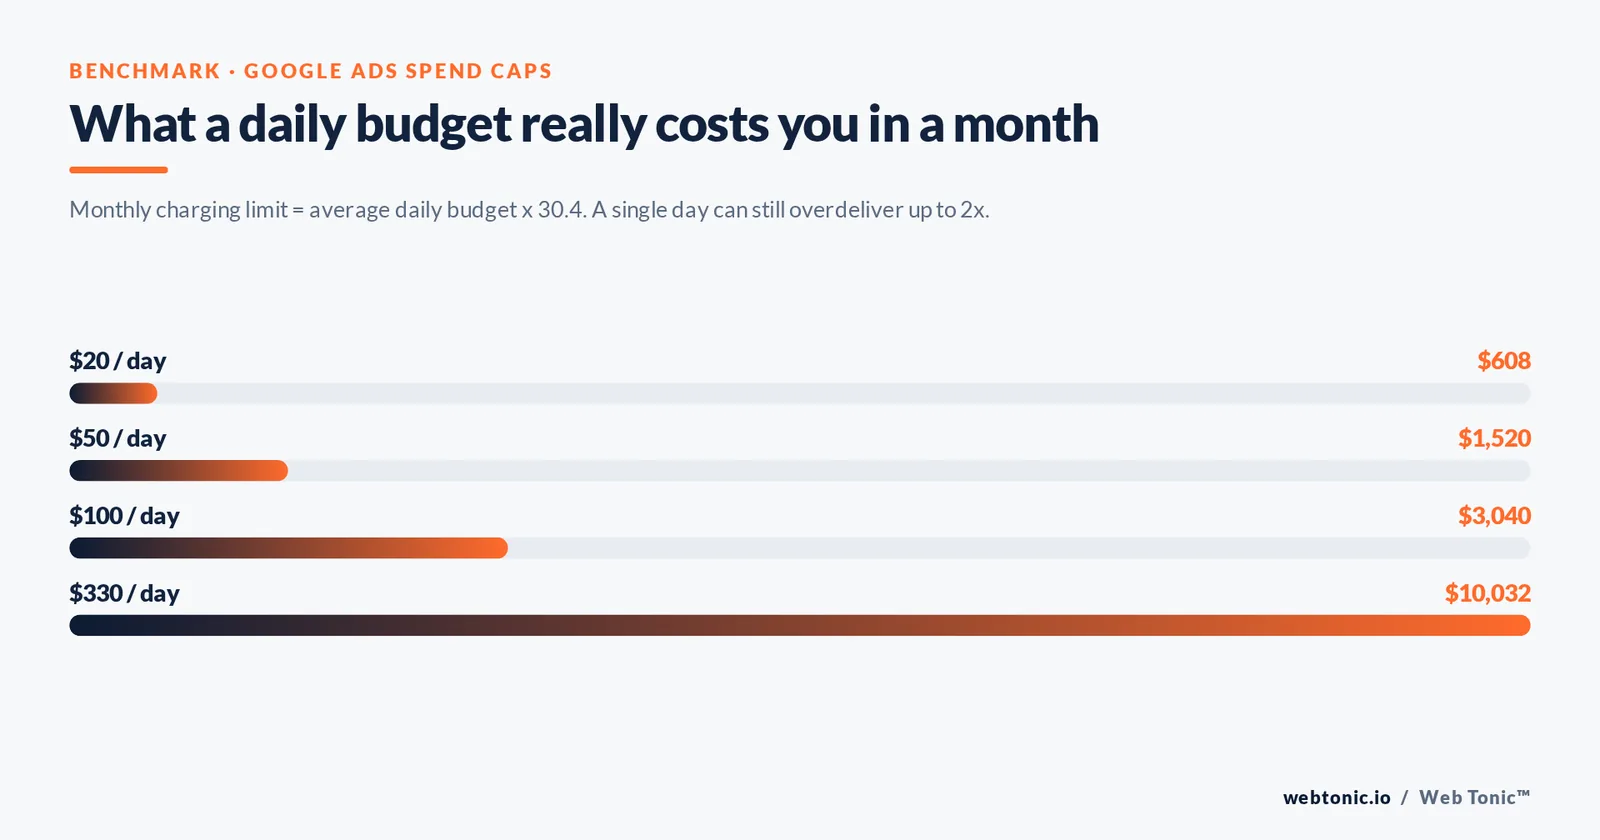
Google Ads does not work on monthly budgets. You set an average daily budget per campaign, and the system is explicitly allowed to overspend on high-traffic days. Per Google's guidance on managing your spend, daily costs can reach 2x your average daily budget, while the monthly charging limit is your average daily budget multiplied by 30.4 — the average number of days in a month. Exceed that and an overdelivery credit is applied.
So a $50 daily budget is really "up to $100 on a Tuesday, no more than $1,520 in the month." That distinction matters when finance asks why Wednesday's spend doubled.
| Average daily budget | Maximum single day | Monthly charging limit | Clicks per month at $5.42 |
|---|---|---|---|
| $20 | $40 | $608 | About 112 |
| $50 | $100 | $1,520 | About 280 |
| $100 | $200 | $3,040 | About 561 |
| $330 | $660 | $10,032 | About 1,851 |
Read that last column as the real constraint. A campaign needs data before automated bidding can do anything useful, and roughly 50–100 clicks a week is the practical threshold for a single campaign to generate a readable signal. At an average click price, that is $1,000–$2,000 a month for one campaign — not for an account with eight of them. Splitting $600 across five campaigns produces five sets of numbers too thin to act on, which is the single most common way small budgets get wasted. Our growth marketing team consolidates before it expands for exactly this reason.
What your money buys at each budget tier
| Monthly media budget | Realistic scope | What to expect | What not to expect |
|---|---|---|---|
| Under $1,000 | One campaign, brand plus 10–20 exact-match terms | Capture existing demand; roughly 100–200 clicks | Broad prospecting, or reliable Smart Bidding |
| $1,000–$5,000 | 2–3 campaigns, one service line each | Enough conversions for value-based bidding on the main goal | Multi-market expansion or heavy display testing |
| $5,000–$20,000 | Search plus shopping or Performance Max, plus remarketing | Structured testing, incremental gains from creative and pages | Instant results in a $9-per-click vertical |
| Over $20,000 | Full-funnel across search, video and social | Channel-level attribution work becomes worth funding | Linear returns — expect diminishing efficiency as you scale |
Add management to those figures. Whether the work happens in-house or through an agency, someone has to build negative keyword lists, write ad variants and read search term reports weekly. Unmanaged PPC does not stay flat; it degrades, because the auction and the competitive set keep moving.
Where PPC money leaks
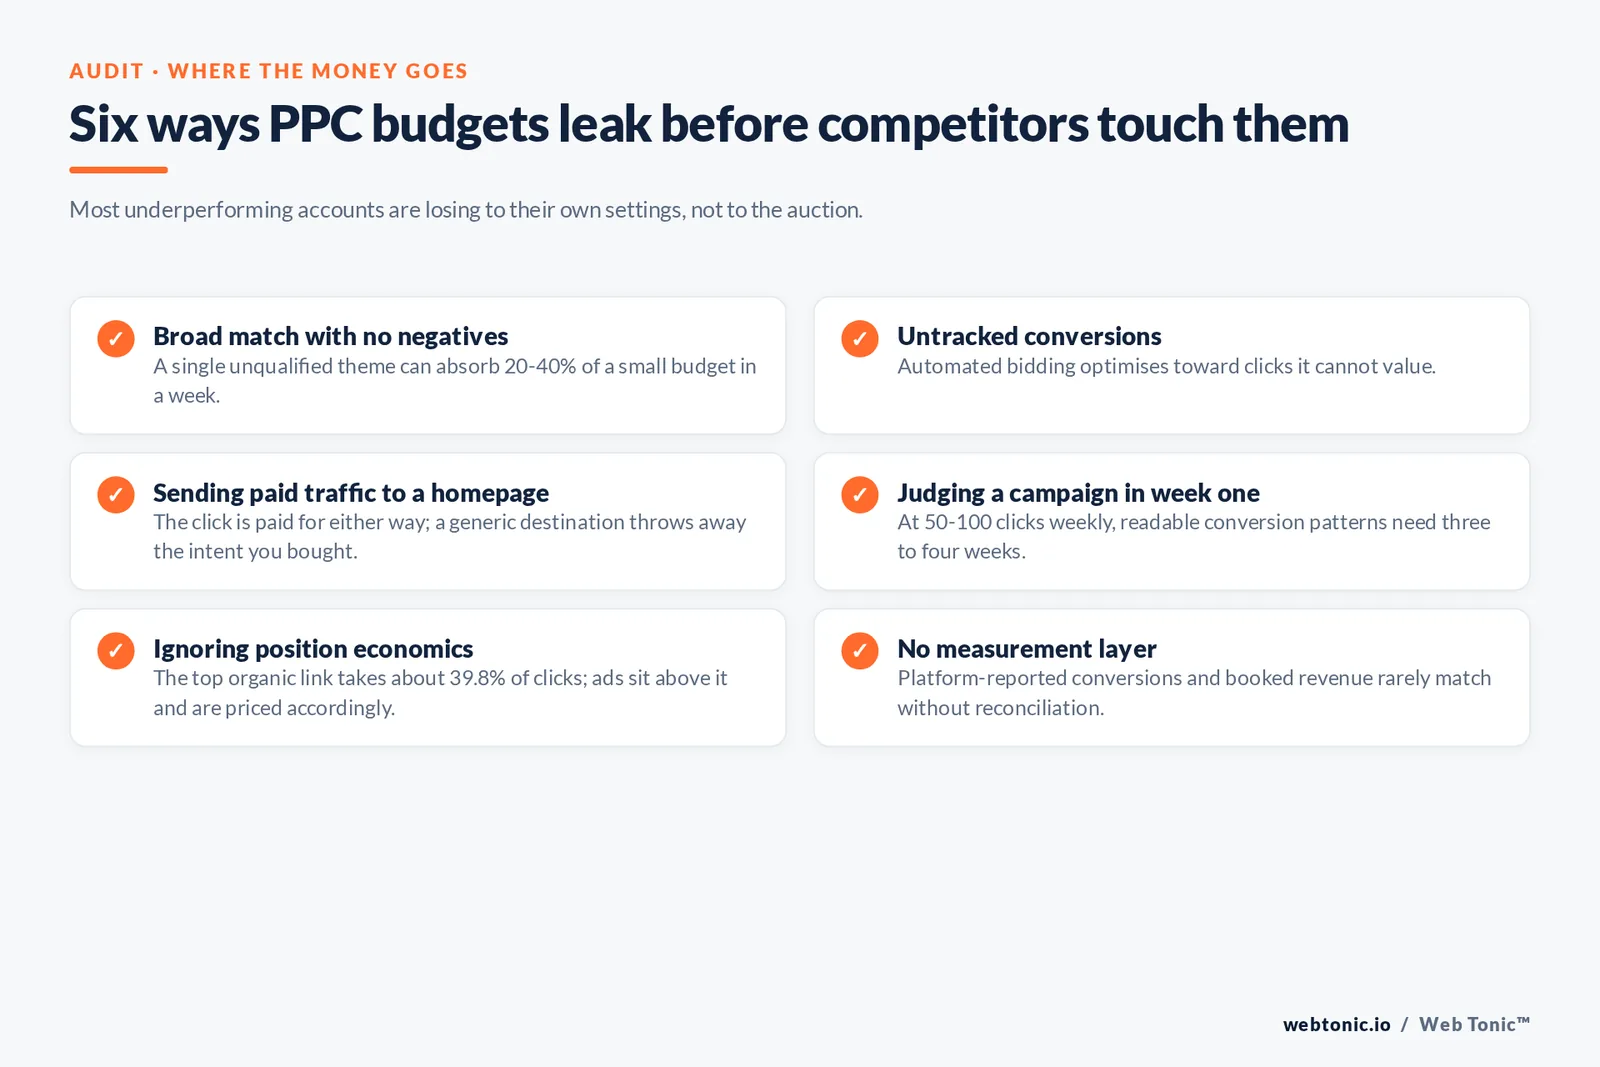
Most underperforming accounts are not losing to competitors. They are losing to their own settings. The recurring culprits:
- Broad match with no negatives. A single unqualified theme can absorb 20–40% of a small budget in a week.
- Untracked conversions. Without accurate conversion data, automated bidding optimises toward clicks it cannot value. Google's documentation on how conversion tracking works is the setup baseline.
- Sending paid traffic to a homepage. The click is paid for either way; a generic destination throws away the intent you just bought.
- Judging a campaign in week one. At 50–100 clicks weekly, meaningful conversion patterns need three to four weeks minimum.
- Ignoring position economics. In organic results the top link takes about 39.8% of clicks, per click-through rate research by ranking position; ads sit above that, so top-of-page visibility is priced accordingly.
- No measurement layer. Platform-reported conversions and booked revenue rarely match. A data intelligence setup that reconciles the two is what turns reporting into decisions.
PPC beyond Google Search
Search is where the model originated, but almost every major ad platform now bills on clicks for at least some placements. Where you buy changes both the price and what a click means.
| Platform | Intent level | Cost profile | Best fit |
|---|---|---|---|
| Google Search | Highest — active queries | $1.63–$9.87 average by industry | Existing demand, service businesses, ecommerce |
| Microsoft Advertising | High — same query model | Typically below Google on comparable terms | B2B, desktop-heavy and older audiences |
| Meta (Facebook, Instagram) | Low — interruption | Cheap clicks, longer path to purchase | Visual products, demand creation, retargeting |
| LinkedIn Ads | Medium — role targeting | Highest CPCs of the major platforms | High-value B2B with long sales cycles |
| Retail media (marketplaces) | Very high — shopper already buying | Mid-range, tied to category competition | Product sellers on marketplaces |
Sequencing beats spreading. With 91.25% of global search on Google against Microsoft's 4.68% per search engine market share data, most accounts should prove the unit economics on Google Search first, then port winning keywords to Microsoft for cheaper incremental volume, and only then add interruption channels where the goal is creating demand rather than harvesting it. The IAB internet advertising revenue report is a useful annual check on where the wider market is moving its money.
The break-even math to run before you launch
PPC is arithmetic before it is strategy. Four numbers tell you whether a campaign can work at all:
- Average order or contract value. What one won customer is worth, gross.
- Gross margin. The share of that value you keep before ad spend.
- Lead-to-customer rate. What share of enquiries close — often 10–30% for service businesses.
- Landing page conversion rate. Use the 8.18% benchmark until you have your own.
Multiply the last two to get clicks per customer, then multiply by your CPC. A home improvement firm at $8.33 per click, 8% page conversion and a 25% close rate needs about 50 clicks per customer — roughly $417 in ad spend. If gross margin on a job is $2,500, the channel is comfortably viable. If it is $300, no amount of optimisation rescues it and the money belongs elsewhere. Ahrefs' primer on PPC advertising covers the same logic from the keyword-selection side.
That single calculation is the difference between advertising and gambling. Run it before the first campaign, revisit it quarterly with real close-rate data, and check the assumptions against everything else you sell — our full service list exists because paid clicks perform very differently depending on what happens after the visit. If you want the numbers pressure-tested on your own margins, talk to us, or read more analysis on the Web Tonic blog.
FAQ
What does pay per click actually mean?
It means the advertiser is charged only when a user clicks the ad, not when it is displayed. Impressions cost nothing, so the platform absorbs the risk of showing ads that nobody engages with, and the advertiser pays a variable price per visit that averages $5.42 on search across industries.
Is pay per click the same as CPC?
Nearly. PPC is the billing model; CPC (cost per click) is the metric that measures it. You run a PPC campaign and you measure its CPC. Your actual CPC is usually lower than the maximum bid you set, because the auction charges only what is needed to hold your position given your quality signals.
How much do I need to spend to test PPC properly?
Plan for 50 to 100 clicks per week for a single campaign, which at an average $5.42 per click is roughly $1,000 to $2,000 a month. Below that, one campaign per month of data is too thin to distinguish a bad campaign from normal variance, and automated bidding has nothing to learn from.
Why did my daily spend exceed my daily budget?
Google allows overdelivery of up to twice your average daily budget on individual days to compensate for slower days. Your protection is the monthly charging limit, which is your average daily budget multiplied by 30.4. If billing passes that limit, Google applies an overdelivery credit to the account.
Can a small business compete against much larger PPC budgets?
Yes, on narrower ground. Because Ad Rank weighs ad relevance and landing page experience alongside the bid, a tightly built account on 20 specific commercial keywords with a matched landing page can outperform a large, sloppy account on those queries. What a small budget cannot do is compete on breadth.
Sources
Google Ads Help — the ad auction, Quality Score for Search campaigns, manage your spend, about return on investment, how Google Ads tracks website conversions · LocaliQ search advertising benchmarks (23 categories, Google and Microsoft) · Semrush, Google Ads cost analysis · Ahrefs, PPC advertising guide · StatCounter global search engine market share · First Page Sage, click-through rates by ranking position · Microsoft Advertising guides · LinkedIn Marketing Solutions · IAB internet advertising revenue report. Figures current as of August 2026.