Table of contents
X sells the cheapest impressions in paid social - a USD 0.74 average CPC and a USD 5.65 CPM - and it is cheap because the biggest advertisers left. For wealth management firms that is a genuine opportunity with a genuine risk attached. The 2026 statistics below cover what X costs, what it converts at, what its keyword targeting is worth, and where the brand-safety line sits for a regulated firm.
Key Takeaways
- Average X CPC is USD 0.74, ranging from USD 0.27 to USD 1.95 by industry and targeting.
- Average X CPM is about USD 5.65, with X at USD 6.46 versus Facebook's USD 7.19 in matched comparisons.
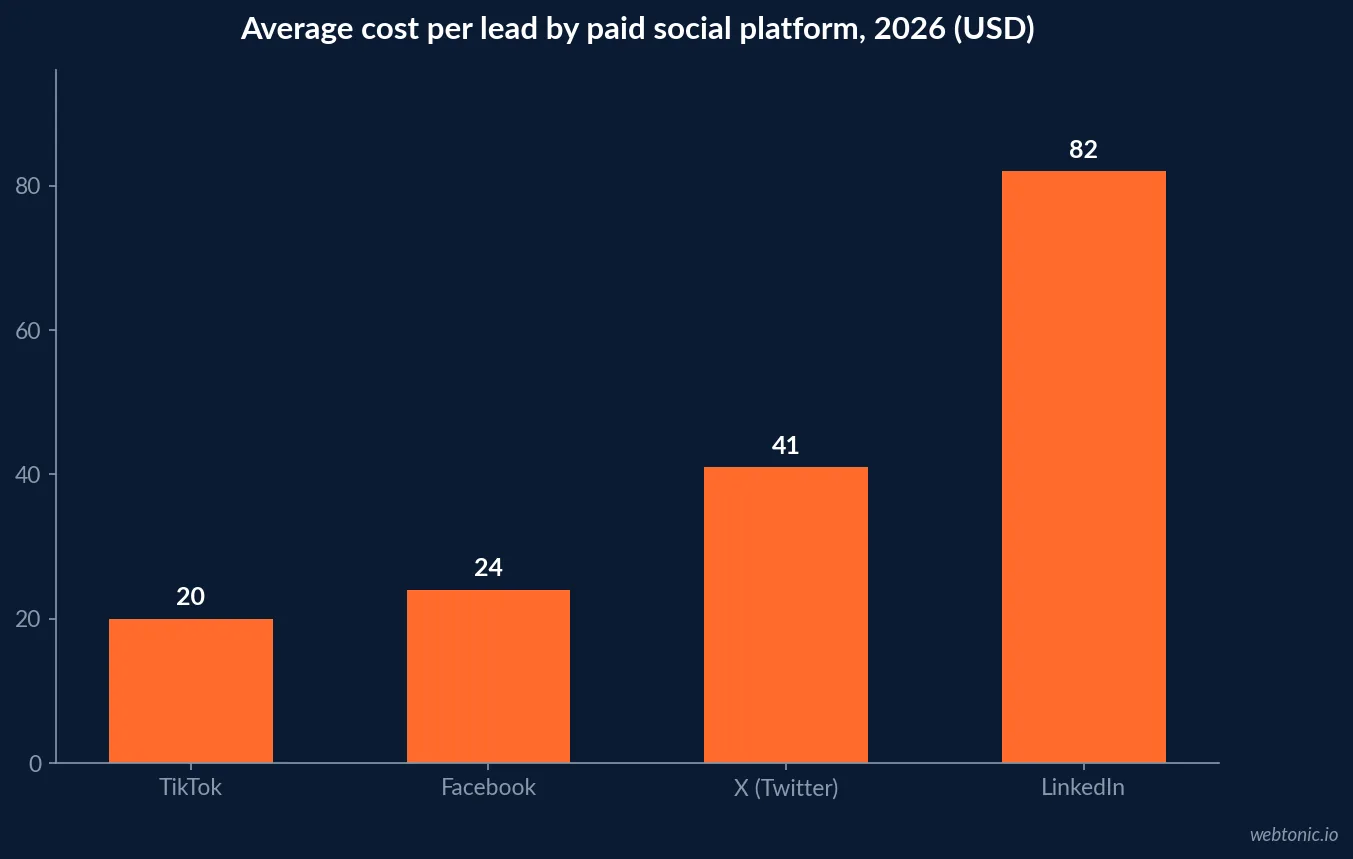
- Average cost per lead on X is USD 41, against USD 82 on LinkedIn, USD 24 on Facebook and USD 20 on TikTok.
- Finance and tech CPMs run USD 8 to USD 25 while general lifestyle inventory clears as low as USD 2.
- Keyword targeting delivers 31% higher CTR than interest targeting and exists only on X.
- Lead-generation conversion rate averages 0.77%, with app installs at 1.23%.
- 611 million monthly active users, and 74% say news is a primary reason they use the platform.
- Estimated 2026 ad revenue is USD 2.5 billion, well below pre-acquisition levels - the source of the discount.
- X ads average CPC is roughly half Meta's USD 1.41, making it the cheapest mainstream testing ground.
Benchmarks at a glance
The headline numbers are consistent across independent 2026 datasets, which is unusual for this platform. WebFX benchmark data reports X CPC at USD 0.74 against Meta's USD 1.41 and a USD 6.46 CPM against Facebook's USD 7.19, while practitioner comparisons put X awareness CPMs at USD 4 to USD 8 versus USD 8 to USD 18 on Meta.
| Metric | X (Twitter) | Comparison platform | Source figure |
|---|---|---|---|
| Average CPC | USD 0.74 | Meta | USD 1.41 |
| Average CPM | USD 6.46 | USD 7.19 | |
| Average CPM (platform) | USD 5.65 | Hootsuite 2026 benchmark | Range USD 0.27 - 1.95 CPC |
| Average cost per lead | USD 41 | LinkedIn / Facebook / TikTok | USD 82 / USD 24 / USD 20 |
| Average CTR | 0.86% - 3.0% | Facebook display average | 0.90% |
| Lead-gen conversion rate | 0.77% | App install campaigns on X | 1.23% |
Read that table the way a media buyer would rather than the way a spreadsheet does. X is cheaper than LinkedIn per lead by half, and worse than Facebook per lead by 70%. It occupies a specific middle ground: professional-audience reach at consumer-platform prices, with conversion efficiency that requires the offer to be genuinely relevant to a conversation happening right now.
Why the inventory is discounted
The discount is not an efficiency story, it is a demand story. Major brands including Apple, Disney, IBM, Coca-Cola and Unilever paused X advertising over brand-safety concerns, and estimated platform ad revenue for 2026 sits around USD 2.5 billion against roughly USD 4.5 billion before the acquisition. Fewer bidders in an auction produce lower clearing prices, which is exactly what the CPM data shows.
The trade-off is explicit in the same dataset: X offers the lowest cost per impression of all major platforms and the lowest brand-safety scores. A wealth management firm is more exposed to that than a sneaker brand, because adjacency to a conspiracy thread is a fiduciary-credibility problem rather than a taste problem. That argues for placement exclusions, comment moderation on promoted posts, and keeping paid activity on owned, moderated content.
| Platform economics | 2026 figure | Implication for advisory buyers |
|---|---|---|
| Estimated ad revenue | USD 2.5B | Auction pressure remains low |
| Pre-acquisition revenue | About USD 4.5B | The gap is the discount you are buying |
| Monthly active users | 611 million | Reach has stabilised, not collapsed |
| Daily time on app | 28 minutes | Versus 4 minutes on Threads |
| Users citing news as primary reason | 74% | Market-moment content lands here |
| Brand-safety ranking | Lowest of major platforms | Exclusions and moderation are mandatory |
Keyword targeting: the one thing X does that nothing else does
Every other platform infers interest from behaviour history. X lets you buy against the words someone just published. Keyword targeting delivers an average 31% higher CTR than interest targeting, and for wealth management that maps onto genuinely commercial moments: a rate decision, a market drawdown, an equity-compensation vesting window, a company IPO in a specific city.
| Targeting approach | Relative strength | Advisory use case |
|---|---|---|
| Keyword (recent posts and searches) | 31% higher CTR than interest | Rate cuts, volatility, RSU windows |
| Follower look-alike | Strong | Followers of financial media and economists |
| Custom audience upload | Strong | Existing prospect and event lists |
| Broad interest categories | Weak | Where advisory budgets usually leak |
| Geography plus keyword | Strong | Local IPO or employer-liquidity events |
Audience receptiveness supports the same conclusion. Onclusive reports that 58% of X users engage with brand content weekly and that X users are 32% more likely to try new products first and 39% more likely to purchase advertised products than non-users. Platform statistics add that 79% of users follow at least one brand and 96% check in at least monthly, with 52% daily.

What finance actually pays
The platform average is not the advisory price. CPM data by niche puts tech and finance between USD 8 and USD 25 while general lifestyle inventory clears as low as USD 2 - a spread of more than ten times driven entirely by who else wants the same impression. Campaign-level guidance for 2026 reports an industry-dependent CPC range of USD 0.18 to USD 0.74, so a finance advertiser should model the top of every published range, not the midpoint.
| Category | Typical CPM | Notes |
|---|---|---|
| General lifestyle | USD 2.00 | Cheapest inventory on the platform |
| Platform average | USD 5.65 | Hootsuite 2026 benchmark |
| Matched Facebook comparison | USD 7.19 | X measured at USD 6.46 in the same study |
| Finance and tech, low end | USD 8.00 | Competitive metros, broad targeting |
| Finance and tech, high end | USD 25.00 | Narrow keyword sets, high advertiser overlap |
Modelling a realistic advisory funnel
Combine the published rates and the picture is honest rather than promotional. A USD 5,000 month at a USD 12 finance CPM buys about 417,000 impressions; at a 1.2% CTR that is roughly 5,000 clicks, which at USD 0.74 would cost USD 3,700 - so clicks, not impressions, are the binding constraint. At a 0.77% conversion rate those clicks yield about 38 raw leads, near the USD 41 published cost per lead. If one in ten becomes a booked meeting and one in three of those funds an account, the media cost per client lands near USD 4,000.
| Funnel step | Assumption | Result on USD 5,000/month |
|---|---|---|
| Impressions | USD 12 finance CPM | 417,000 |
| Clicks | 1.2% CTR | About 5,000 |
| Raw leads | 0.77% conversion | About 38 |
| Booked meetings | 10% of leads qualify | About 4 |
| Funded clients | One in three meetings | 1 - 2 |
That model is defensible in wealth management and indefensible in most other verticals, purely because of account economics. The same USD 4,000 media cost per client would be absurd for a subscription product and is unremarkable against a relationship generating recurring fees on a six-figure portfolio for a decade.
Creative and format rules that move the numbers
Format discipline matters more here than on any other platform because the feed is text-first and largely sound-off. Benchmark guidance is consistent: short video of 15 to 30 seconds with captions, one idea per post, and the claim in the first line rather than the fourth. Over 100 million users watch vertical video daily on the platform, so vertical assets are no longer optional.
| Format | Typical cost signal | Best advisory use |
|---|---|---|
| Promoted post (text plus chart) | CPE USD 0.03 - USD 0.20 | Commentary on a market event |
| Short video, 15-30s captioned | CPM USD 3 - USD 6 for views | Explainers and adviser intros |
| Website card | CPC USD 0.50 - USD 2.00 | Guide downloads and calculators |
| Lead-gen campaign | CPL about USD 41 | Only after creative is proven |
| Takeover placements | Highest on the platform | Not appropriate for most firms |
A 90-day test structure with stop conditions
Because the inventory is cheap, the failure mode on X is not overspending - it is spending steadily on a channel nobody is measuring. Phase the test, and write the stop conditions down before launch so the decision is not made by whoever liked the creative most.
| Phase | Days | What you buy | Budget | Stop condition |
|---|---|---|---|---|
| 1. Keyword listening | 1-15 | Nothing - build keyword and follower lists | Time only | Fewer than 20 usable keyword clusters |
| 2. Reach and engagement | 16-45 | Promoted commentary posts | USD 60/day | CPE above USD 0.25 after 10 days |
| 3. Traffic | 46-70 | Website cards to a guide or calculator | USD 80/day | CPC above USD 1.50 sustained |
| 4. Lead capture | 71-90 | Lead-gen campaigns on proven creative | USD 100/day | Cost per booked meeting above USD 600 |
Two operational rules keep the brand-safety exposure contained. Promote only owned posts so comment moderation stays available, and review placement reports weekly rather than monthly - on a platform with the lowest brand-safety scores in the category, the cost of a bad adjacency is measured in credibility rather than wasted spend.
Where X belongs in a wealth management media plan
Treat X as the fastest, cheapest place to be visibly competent during a market moment, and treat search as the place demand converts. Our growth marketing team plans advisory paid media with that split, and our data intelligence practice ties cheap top-of-funnel clicks to booked-meeting data so a USD 41 lead is never mistaken for a USD 41 client. For comparison against the intent channel, our Google Ads strategy guide covers the same funnel maths, and our Facebook Ads ROI analysis is the closest paid-social benchmark to set X against.
Frequently Asked Questions
How much do X (Twitter) ads cost in 2026?
The average CPC on X is USD 0.74, with a working range of USD 0.27 to USD 1.95 depending on industry and targeting, and the average CPM is about USD 5.65. Comparative benchmarks put X CPC at roughly half of Meta's USD 1.41 and X CPM at USD 6.46 against Facebook's USD 7.19. Finance and tech are the expensive end of the platform, with CPMs quoted between USD 8 and USD 25, while general lifestyle inventory can be as low as USD 2.
Is X worth advertising on for a wealth management firm?
It is a conversation-capture and thought-leadership channel, not a lead engine. The average X cost per lead is USD 41 versus USD 82 on LinkedIn, which is genuinely attractive, but the average lead-generation conversion rate is only 0.77%, so volume comes from cheap clicks rather than efficient funnels. The strategic argument is keyword targeting: X is the only major platform where you can buy against what someone just posted about markets, rates or retirement.
Why are X ads so cheap now?
Because demand fell. Major advertisers including Apple, Disney, IBM, Coca-Cola and Unilever paused spending over brand-safety concerns, and platform ad revenue is estimated near USD 2.5 billion in 2026 against roughly USD 4.5 billion pre-acquisition. Fewer bidders means lower clearing prices. X now offers the lowest cost per impression of the major platforms alongside the lowest brand-safety scores, and both facts have the same cause.
What targeting works best on X for financial services?
Keyword targeting, which is unique to X and delivers an average 31% higher CTR than interest targeting because it buys against a post someone made minutes ago rather than a profile attribute inferred months ago. Follower look-alike targeting against financial media accounts, economists and market commentators is the second strongest option. Broad interest categories such as 'business and finance' are where advisory budgets are usually wasted.
What conversion rates should an advisory firm expect on X?
Plan for 0.77% on lead-generation campaigns and 1.23% on app installs, against a platform CTR that sits between 0.86% and 3% depending on format and how well the creative matches the moment. At a USD 0.74 CPC and 0.77% conversion, a raw lead costs about USD 96 - cheaper than most professional-services channels, but the qualification burden is high because cheap clicks attract unqualified traffic.
The verdict
X is distressed inventory, and distressed inventory is worth buying with rules. USD 0.74 CPC, USD 5.65 CPM and a USD 41 cost per lead against LinkedIn's USD 82 make the arithmetic attractive; a 0.77% lead-generation conversion rate and the lowest brand-safety scores of any major platform make discipline mandatory. Buy keyword targeting rather than interests, keep paid spend on moderated owned content, and measure booked meetings rather than leads. Talk to our team to pressure-test this against your firm's own close rate.
Sources
SearchLab - X (Twitter) statistics and ad benchmarks 2026
HeyOz - are X (Twitter) ads worth it, WebFX 2026 benchmarks
AdLibrary - X Ads vs Meta Ads 2026 practitioner comparison
GrowthScribe - X advertising costs and campaign structure 2026
Market.biz - X advertising statistics
Onclusive - X (Twitter) statistics 2026, brand engagement
ScheduleWave - X user and demographic statistics
CPM Calculator - X CPM benchmarks by niche
Twitter10k - X lead generation ad benchmarks
Visa Research - the great wealth transfer, USD 36 trillion