Table of contents
Financial services is the most expensive vertical on LinkedIn: about USD 8.70 per click and up to USD 200 per qualified lead, against a platform median of USD 110. For a wealth management firm, that is either indefensible or trivially cheap, and which one depends entirely on the number you divide it by. The statistics below cover 2026 LinkedIn Ads costs, audience data and formats - and the acquisition math that decides whether the channel belongs in the plan.
Key Takeaways
- Average LinkedIn CPC hit USD 6.50 in 2026, up 8% year over year, with a global range of USD 5.26 to USD 8.50 and USD 24+ for C-suite targeting.
- Financial services averages USD 8.70 CPC and up to USD 200 per qualified lead - the highest of 17 B2B verticals measured across USD 47M in managed spend.
- Thought Leader Ads deliver 2.68% CTR at USD 2.29 CPC, roughly 77% cheaper per click than single-image ads and the format story of the year.
- LinkedIn CPM averages USD 33 - three to six times Meta and 10 to 15 times Google Display - because you are buying a professional identity graph, not reach.
- Last-click attribution undercounts LinkedIn by 40% to 60%, and LinkedIn leads convert to opportunities at about 2.4x the rate of Google leads in financial services.
- 51% of advisors have won new business through social media (Putnam Social Advisor Survey), with LinkedIn the dominant platform.
- The average Schwab-benchmarked RIA relationship is near USD 1.78M, which is why cost per lead is the wrong denominator for this industry.
2026 LinkedIn Ads cost benchmarks, and where finance sits
LinkedIn is not priced like a social platform, because it is not sold like one. Advertisers buy declared professional identity - title, seniority, employer, company size - and finance competes for the narrowest, most contested slice of it.
| Metric | Platform average | Financial services | Context |
|---|---|---|---|
| Cost per click | USD 5.26 - 8.50 | ~USD 8.70 | USD 6.50 blended 2026, +8% YoY |
| Cost per click, C-suite targeting | USD 24+ | USD 15+ | 6-12x the individual-contributor range |
| Cost per 1,000 impressions | ~USD 33 | Higher on tight audiences | 3-6x Meta, 10-15x Google Display |
| Click-through rate, all formats | 0.44% | Below average | Compliance limits creative options |
| Cost per lead, Lead Gen Forms | USD 110 median | Up to USD 200 | Range USD 40 (professional services) to USD 200 |
| Cost per lead, all paid channels | - | ~USD 185 median, wealth management | USD 210 asset managers, USD 275 B2B fintech |
| Blended financial services CPL | - | ~USD 653 | First Page Sage, all channels blended |
Two rows deserve attention. The USD 185 median CPL for wealth management firms across all paid channels is materially lower than the USD 653 blended figure often quoted for financial services, because the blended number mixes in institutional and high-intent search campaigns that can exceed USD 900 per lead. And compliance is a real cost line: ad review requirements add 8% to 15% to effective CPL for most financial firms, falling below 5% for teams that maintain pre-approved ad libraries.
Format is the biggest cost lever on the platform
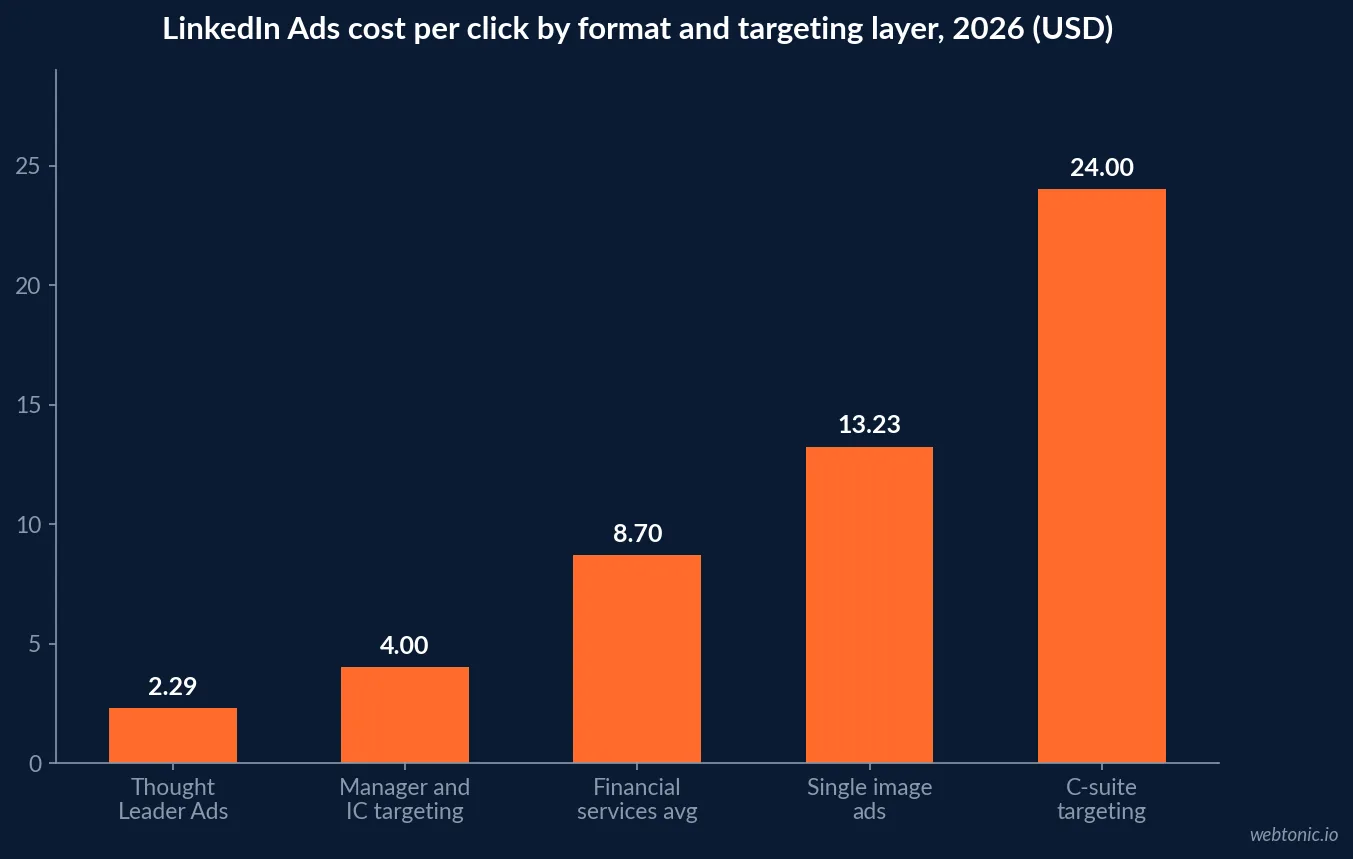
Inside a single account, the spread between the cheapest and most expensive click is larger than the spread between industries. Firms running only single-image ads are paying a format premium they often mistake for an industry premium.
| Format or targeting layer | Typical CPC | Typical CTR | Best use for an advisory firm |
|---|---|---|---|
| Thought Leader Ads | USD 2.29 | 2.68% | Advisor-led commentary; cheapest qualified reach |
| Single image ads | USD 13.23 | 0.56% | Offer and guide promotion, retargeting |
| Video ads | Mid-range | 0.25% | Firm story, planning explainers |
| Conversation ads | Mid-range | 4-5% open rate | Event and webinar invitations |
| Document ads | Lowers a USD 50+ CPM | Above average | Whitepapers, retirement guides |
| C-suite targeting | USD 24+ | Varies | Business-owner liquidity events only |
| Manager and IC targeting | USD 2 - 6 | Varies | 401(k) rollover and equity-comp audiences |
The arithmetic is blunt. Moving a budget from single-image ads at USD 13.23 to Thought Leader Ads at USD 2.29 buys four to six times more clicks for the same money, and the format is also the one that fits advisory marketing best: a named human giving an opinion, which is exactly what an investor is trying to evaluate. Regionally, APAC delivers USD 1.03 CPC at 1.04% CTR against North America at USD 3.39 and 0.58%, and EMEA at USD 5.17 and 0.28% - relevant only if a firm serves expatriate or cross-border clients.
The audience is real, the wealth signal is not
LinkedIn passed 1.3 billion members and generated USD 17.8 billion in revenue in Microsoft FY2025, up 9%, with global ad revenue forecast at USD 9.7 billion in 2026 rising to USD 11.3 billion in 2027. It now captures roughly 41% of total B2B ad budgets. The audience quality claims are also defensible: four in five members say they influence business decisions at their organisation, and 53% of US college graduates use the platform against 10% of adults with a high-school diploma or less.
| Audience data point | Figure | Why it matters for wealth management |
|---|---|---|
| Members worldwide | 1.3 billion | Scale is not the constraint |
| Daily active users | ~134.5 million | About 16.2% of members; slow media |
| Members who drive business decisions | 80% | Owner and executive density |
| Largest age cohort | 25-34 (50.6%) | Accumulators, not decumulators |
| Members aged 55+ | 3.8% | Retirees are structurally under-represented |
| US graduates on the platform | 53% | Most educated major platform audience |
| Average engagement rate, 2026 | 3.85% (+44% YoY) | Organic still compounds paid |
| Members posting weekly or more | ~3% | Low competition for attention |
Now the problem. Nobody maintains a profile that reads "retired owner, USD 8M investable". The 55-plus cohort is 3.8% of the platform while holding a disproportionate share of investable wealth, and job title is a weak wealth proxy in both directions. Practitioners solve it with event-based and firmographic proxies rather than title lists - business owners in a USD 5M to USD 100M revenue band, executives at recently acquired companies, professionals with equity compensation - which produces workable audiences of 50,000 to 250,000 without paying premium CPMs for LinkedIn revenue-and-title signals. Ultra-specific titles cut CPC by 25% to 47% against broad categories in the same vertical.
Why cost per lead is the wrong denominator
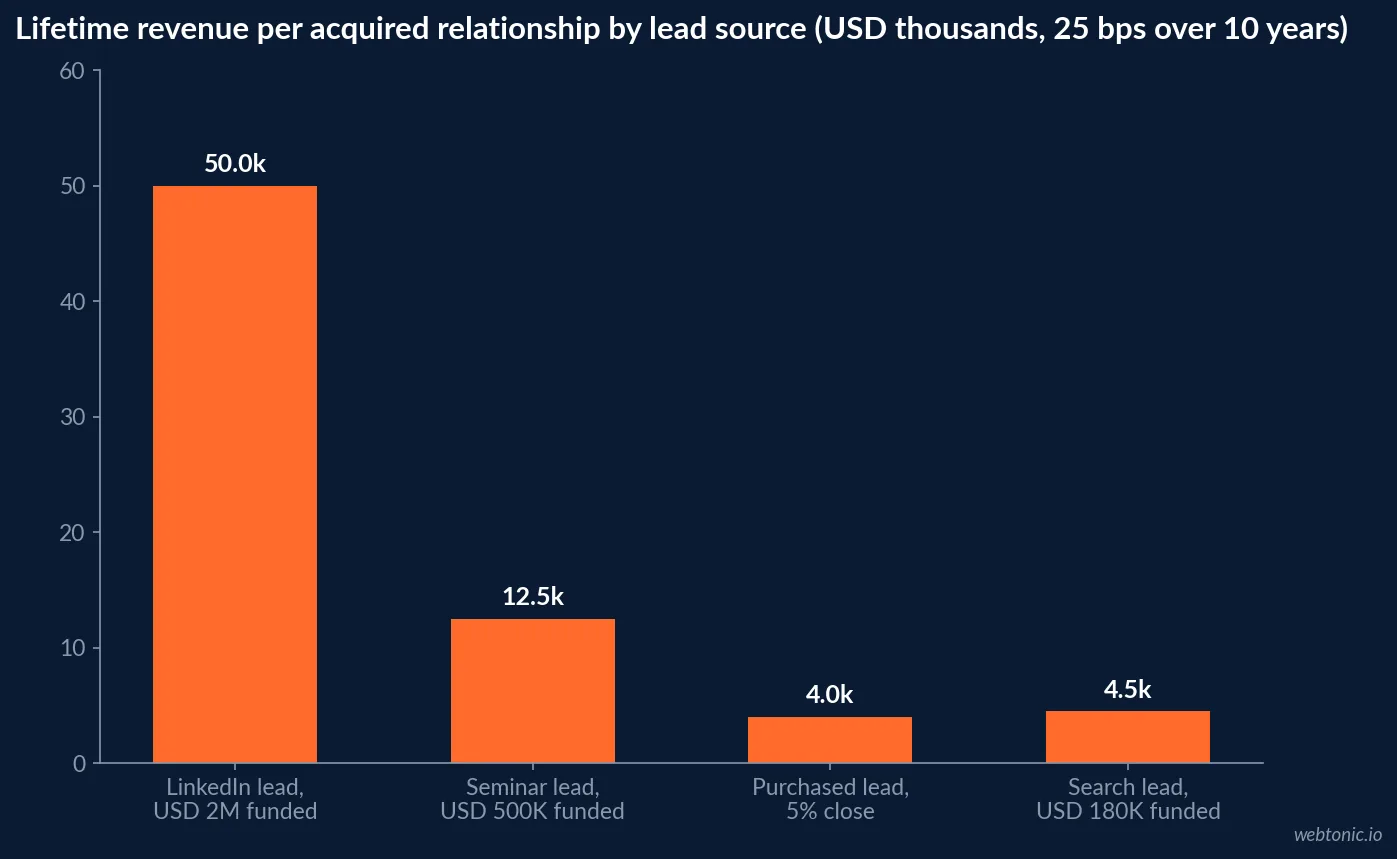
Wealth management has the rare privilege of an enormous and measurable lifetime value, and the rare habit of ignoring it in media reporting. Judge LinkedIn on cost per lead and it loses to almost everything. Judge it on acquisition cost per dollar of assets and the ranking inverts.
| Scenario | Cost per lead | Assets funded | Fee | Approximate lifetime revenue |
|---|---|---|---|---|
| LinkedIn, owner and executive audience | USD 400 | USD 2,000,000 | 25 bps, 10-year tenure | ~USD 50,000 |
| Search, generic advisor query | USD 90 | USD 180,000 | 25 bps, 10-year tenure | ~USD 4,500 |
| Seminar lead | USD 120 - 400 | USD 500,000 | 25 bps, 10-year tenure | ~USD 12,500 |
| Purchased lead list | USD 200 | Converts at 2-8% | - | ~USD 4,000 per acquired client |
| Referral | Near zero media cost | Highest close rate, 40-60% | - | Years of relationship time |
Three data points support the reframe. LinkedIn-sourced deals close at 28.6% to 35% higher contract value than Google-sourced deals; LinkedIn leads convert to opportunities at 2.4x the rate of Google leads in financial services; and B2B financial firms that track cost per qualified lead rather than raw CPL allocate budget 34% more efficiently, yet fewer than 40% of financial firms actually do it. Building that reporting layer is what our data intelligence team does before it passes judgement on a channel.
Budget thresholds: when LinkedIn earns a line item
Independent RIAs typically spend 2% to 5% of gross revenue on marketing, and most advisors spend between USD 3,000 and USD 10,000 a month on all marketing combined. That ceiling is the real reason LinkedIn fails for many firms - not the CPC.
| Monthly paid budget | Search | Retargeting | Practical read | |
|---|---|---|---|---|
| Under USD 7,000 | Most of it | 0% | Small | LinkedIn cannot reach learning thresholds |
| USD 25,000 | 70% | 20% | 10% | Lead with search intent |
| USD 50,000 | 55% | 30% | 15% | LinkedIn becomes a real test |
| USD 100,000 | 45% | 35% | 20% | Mix shifts toward LinkedIn |
| USD 200,000+ | 40% | 35% | 25% | Retargeting depth pays |
These are starting points rather than rules, but the floor is firm: under roughly USD 7,000 a month LinkedIn audience sizes and frequency do not reach the thresholds the delivery system needs, and the result is a coin toss dressed up as a test. Retargeting, meanwhile, cuts CPL by 30% to 55% against cold prospecting on every paid channel - which is why it appears in every row above.
Organic and paid are the same programme here
Advisory firms get an unusual return on organic LinkedIn because so few members publish. Only about 3% of members post more than once a week, and employee posts earn roughly twice the engagement of company-page posts. That is the supply side of Thought Leader Ads: you cannot run the cheapest format on the platform without a credible personal profile behind it.
- Connection and reply mechanics: platform data across 316,703 outreach sequences shows a 28% average acceptance rate, with 29% of accepted connections replying - about 8% of all requests sent. Acceptance peaked at 34% for accounts sending 10 to 19 invites a day and fell at higher volume.
- InMail versus email: InMail open rates land near 45% against 20% to 25% for B2B email, and sponsored InMail click rates sit at 3% to 4%.
- Direct messages: LinkedIn DMs average a 10.3% reply rate against 5.1% for cold email, based on 70,000+ campaigns.
- Touchpoint reality: roughly five touchpoints are needed before conversion on the platform, and deals above USD 50,000 in value typically need 7 to 12 marketing touches - so single-touch reporting will always misprice this channel.
- Video: LinkedIn reports a 36% year-over-year rise in video consumption, with paid video growing near 30% - cheap incremental reach for planning explainers.
Compliance is a media constraint, not just a legal one
Advertising restrictions in financial services push click-through rates 0.3 to 0.5 percentage points below unrestricted B2B campaigns, which raises CPC and therefore CPL. Performance claims, testimonials, and anything resembling a projection all need review, and the review cycle is usually what kills creative volume. Firms that pre-clear an ad library and template set - headlines, disclosures, landing-page modules - keep compliance overhead under 5% of effective CPL instead of 15%, and can iterate weekly instead of quarterly. Our performance creative team builds those libraries against an approved claim list rather than fighting review one asset at a time.
A 90-day LinkedIn test plan for an advisory firm
| Phase | Days | Work | Success measure | Stop condition |
|---|---|---|---|---|
| Foundation | 1-15 | Advisor profiles, pre-approved claim list, conversion tracking, CRM lead-source fields | Every lead lands in the CRM with source and asset band | No CRM field for source - fix first |
| Audience build | 16-30 | Owner and executive proxy audiences of 50k-250k; exclude clients and competitors | Audience above 50,000 with under 20% overlap | Audience under 25,000 - widen the proxy |
| Format test | 31-60 | Thought Leader Ads versus single image, Lead Gen Form versus landing page | CPC under USD 6 on the winning format | All formats above USD 12 CPC after 60 days |
| Qualification | 61-75 | Score leads on asset band and life-stage trigger, not job title | Over 40% of leads in the target asset band | Under 20% in band - targeting is proxy-broken |
| Economics | 76-90 | AUM-weighted CAC per source; compare against search and referral | Cost per dollar of new AUM beats search | Cannot compute AUM per source - reporting gap |
Phase one is the one firms skip, and it is the one that determines whether anything after it can be read. If lead source and asset band are not captured at intake, the account will be optimised against cost per lead by default - the exact number the rest of this article argues against. For the wider paid-media context, our paid acquisition guide covers the search side of the mix, and the Facebook Ads ROI analysis covers the cheap-reach alternative.
Frequently Asked Questions
What does LinkedIn advertising cost for a wealth management firm in 2026?
Expect to sit at the top of the platform's cost range. The global average LinkedIn CPC is USD 5.26 to USD 8.50 and reached USD 6.50 in 2026, up 8% year over year, but financial services averages about USD 8.70 per click and pushes above USD 15 for C-suite targeting. Qualified cost per lead in financial services runs to roughly USD 200 against a USD 110 platform median, and LinkedIn CPM averages about USD 33 - three to six times Meta. Legal and finance B2B campaigns routinely see CPCs of USD 12 to USD 18 when targeting is tight.
Is LinkedIn a good channel for financial advisors and RIAs?
It works when the average relationship is large and the firm can wait out a long cycle. Putnam's Social Advisor Survey found 51% of advisors gained new business from social media, with LinkedIn dominant. The economics follow the asset size: the 2025 Schwab RIA Benchmarking Study implies an average client relationship near USD 1.78 million, which at a 1% fee is roughly USD 17,800 in recurring annual revenue. Against that, a USD 400 lead is cheap. Below roughly USD 7,000 of monthly LinkedIn spend, audiences and frequency rarely reach learning thresholds and results get noisy.
Can you target high-net-worth investors on LinkedIn?
Not directly - and this is the central limitation. LinkedIn sells job title, seniority, company size, industry and skills, none of which are investable assets. A 35-year-old VP of engineering at a Series B startup has an excellent profile and perhaps USD 200,000 invested; a retired business owner with USD 8 million has a dormant profile. Firms that perform build proxy audiences instead: founders and owners in the USD 5M-USD 100M revenue band, executives at companies with recent liquidity events, and specific senior titles. Ultra-specific job titles cut CPC by 25% to 47% versus broad categories.
What LinkedIn ad format is cheapest for advisory firms?
Thought Leader Ads, by a wide margin. They average a 2.68% click-through rate at USD 2.29 CPC, which is about 77% cheaper per click than single-image ads at USD 13.23, and the format switch alone can cut effective cost per lead by 50% to 70%. Document ads are the fastest lever for accounts where CPM has run above USD 50, and in-platform Lead Gen Forms convert three to four times better than off-platform landing pages at 30% to 50% lower cost per lead - at the price of thinner data.
How should a wealth management firm measure LinkedIn Ads performance?
On AUM-weighted acquisition cost, not cost per lead. A USD 400 LinkedIn lead that funds a USD 2 million relationship beats a USD 90 lead that funds USD 180,000, and at a 25-basis-point fee over a ten-year average tenure the first lead is worth about USD 50,000 in lifetime revenue. Last-click models also undercount LinkedIn's contribution by 40% to 60%, so firms judging the channel on a 30-day CPL are reading a number that is structurally wrong for a sales cycle measured in months.
The verdict
LinkedIn is the most expensive place a wealth management firm can buy a click - about USD 8.70 in financial services, up to USD 200 per qualified lead - and one of the few where the audience density justifies it, because 80% of members influence business decisions and the average benchmarked RIA relationship is worth USD 1.78 million. Buy the cheap formats, build wealth proxies instead of title lists, fund it above the USD 7,000 monthly floor, and report on AUM-weighted acquisition cost - because a last-click CPL undercounts this channel by 40% to 60%. Talk to our team if you want the benchmark run against your own account before you decide.
Sources
Foundry CRO - LinkedIn Ads benchmarks by industry 2026
Ryze AI - LinkedIn CPC and CPL benchmarks across USD 47M in spend
Calc4Marketers - LinkedIn CPC, CPM and CPL benchmark hub
Elevarus - LinkedIn Ads versus Google Search for RIAs
Wolf Financial - financial services cost per lead benchmarks 2026
ConnectSafely - LinkedIn statistics 2026
Expandi - LinkedIn demographics and reply data
LinkedInsider - LinkedIn for RIAs and wealth managers
IvyForms - lead generation benchmarks for financial advisors
BSPKN - financial advisor digital marketing and compliance benchmarks