Table of contents

Most restoration dashboards report the wrong side of the business. They count leads and jobs while the constraint sits in accounts receivable and job-level margin - and that is where the visibility is worst. 62% of restoration companies cannot accurately calculate job-level profit margins, 47% do not track cost per lead by channel, and 38% could not identify their most profitable service type, according to the Restoration Industry Association's 2025 Financial Performance Study of 400 member companies. This is the 2026 data on restoration reporting: what owners actually track, what the gaps cost, what the software prices at, and the six metrics worth building a dashboard around.
Key Takeaways
- 62% of restoration companies cannot calculate job-level profit margins; 38% cannot name their most profitable service line.
- A 90-day cash cycle on a USD 10M shop ties up roughly USD 2.5M in average receivables; compressing to 60 days frees about USD 850,000.
- Gross margin swings from 25-40% on reconstruction to 50-65% on mold remediation, so revenue alone cannot signal a bad month.
- 73% of home-service owners review their numbers monthly or less, while weekly review is linked to 15-25% lower blended acquisition cost.
- Manual reporting costs about 12.4 hours a week (~USD 30,264 a year) at 8-12% error rates; dashboards cut reporting time up to 80%.
- Restoration-specific platforms are credited with 35% faster job completion and 28% higher margins, and 20-30% faster insurance payment cycles.
Restoration reporting benchmarks at a glance
Every figure below is the number we check first when a restoration company asks for a reporting build. Two of them - the margin blind spot and the payment lag - explain most of the others.
| Metric | 2026 benchmark | Source type |
|---|---|---|
| Cannot calculate job-level margin | 62% of companies | RIA study, 400 companies |
| Do not track CPL by channel | 47% | RIA study |
| Cannot name most profitable service | 38% | RIA study |
| Review numbers monthly or less | 73% of owners | Home-services aggregate |
| Manual reporting time | 12.4 hours per week | Home-services aggregate |
| Manual reporting error rate | 8-12% (vs <0.5% automated) | Analytics benchmark |
| Insurance payment wait | 3-8 weeks (18%+ longer) | 2026 Restoration Benchmarking Survey |
| Documentation-driven claim disputes | 43% of disputes | IICRC |
Why margin, not revenue, is the headline number
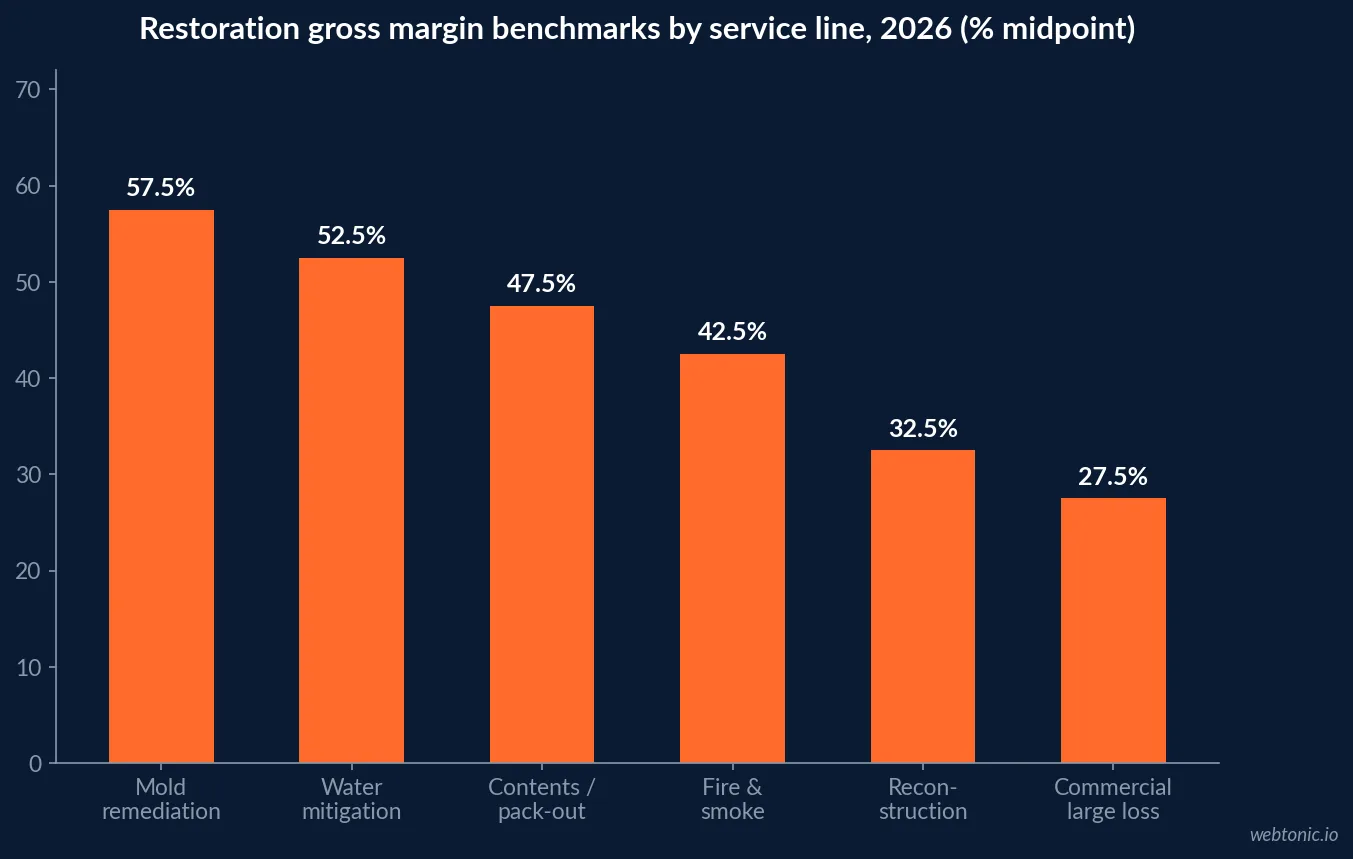
Restoration is several businesses wearing one brand, and they do not earn alike. Published margin benchmarks for 2026 put water mitigation at 45-60% gross, mold remediation at 50-65%, fire and smoke at 35-50%, contents cleaning and pack-out at 40-55%, reconstruction at 25-40% and commercial large loss at 20-35%, with net margin after overhead landing at 8-15% of revenue for a healthy shop. PushLeads' financial benchmark set reports the top operators reaching 75-80% gross on water mitigation through crew productivity and routing.
Read those two ranges together and the reporting requirement is obvious. A month that shifts from mitigation-heavy to reconstruction-heavy can cut blended gross margin by 20 points while revenue rises. A dashboard that shows only revenue will report that month as a win. Companies below 5% net margin are usually one bad month from a cash crisis, and companies above 18% are typically small, specialised or under-investing in growth.
| Service line | Gross margin benchmark | Reporting implication |
|---|---|---|
| Water mitigation | 45-60% (top: 75-80%) | Track crew hours per job, not just job count |
| Mold remediation | 50-65% | Highest-margin line; worth channel-level demand tracking |
| Fire and smoke | 35-50% (top: 55-65%) | Subcontractor share drives the spread |
| Contents / pack-out | 40-55% | Often unbilled; needs its own revenue line |
| Reconstruction | 25-40% | Largest job totals, thinnest percentage |
| Commercial large loss | 20-35% | Report separately or it distorts the blend |
The cash-cycle dashboard nobody builds
This is the metric that separates restoration reporting from every other home-services vertical. Because the payer is an insurance carrier rather than the homeowner, revenue converts to cash slowly and unevenly, and the receivable balance funds the next set of jobs. Cash-cycle modelling for restoration shops puts it in plain arithmetic: a USD 10M shop on a 90-day cycle carries roughly USD 2.5M in average receivables; compress the cycle to 60 days and the working-capital requirement falls to about USD 1.65M, releasing roughly USD 850,000; compress to 45 days and the freed cash reaches USD 1.25M. On a USD 5M shop the 90-to-60 compression is still about USD 830,000.
Documentation quality is the lever. The IICRC attributes 43% of insurance claim disputes in restoration work to inadequate documentation, and platforms producing complete daily reporting packages are credited with speeding payment cycles 20-30% and cutting adjuster phone calls by an estimated 60%. That is a reporting output with a balance-sheet result, which is why days sales outstanding belongs on the same screen as cost per lead.
| Cash cycle | Average AR on USD 10M revenue | Working capital freed vs 90 days |
|---|---|---|
| 90 days | ~USD 2.5M | - |
| 60 days | ~USD 1.65M | ~USD 850,000 |
| 45 days | ~USD 1.25M | ~USD 1.25M |
What restoration reporting software costs in 2026
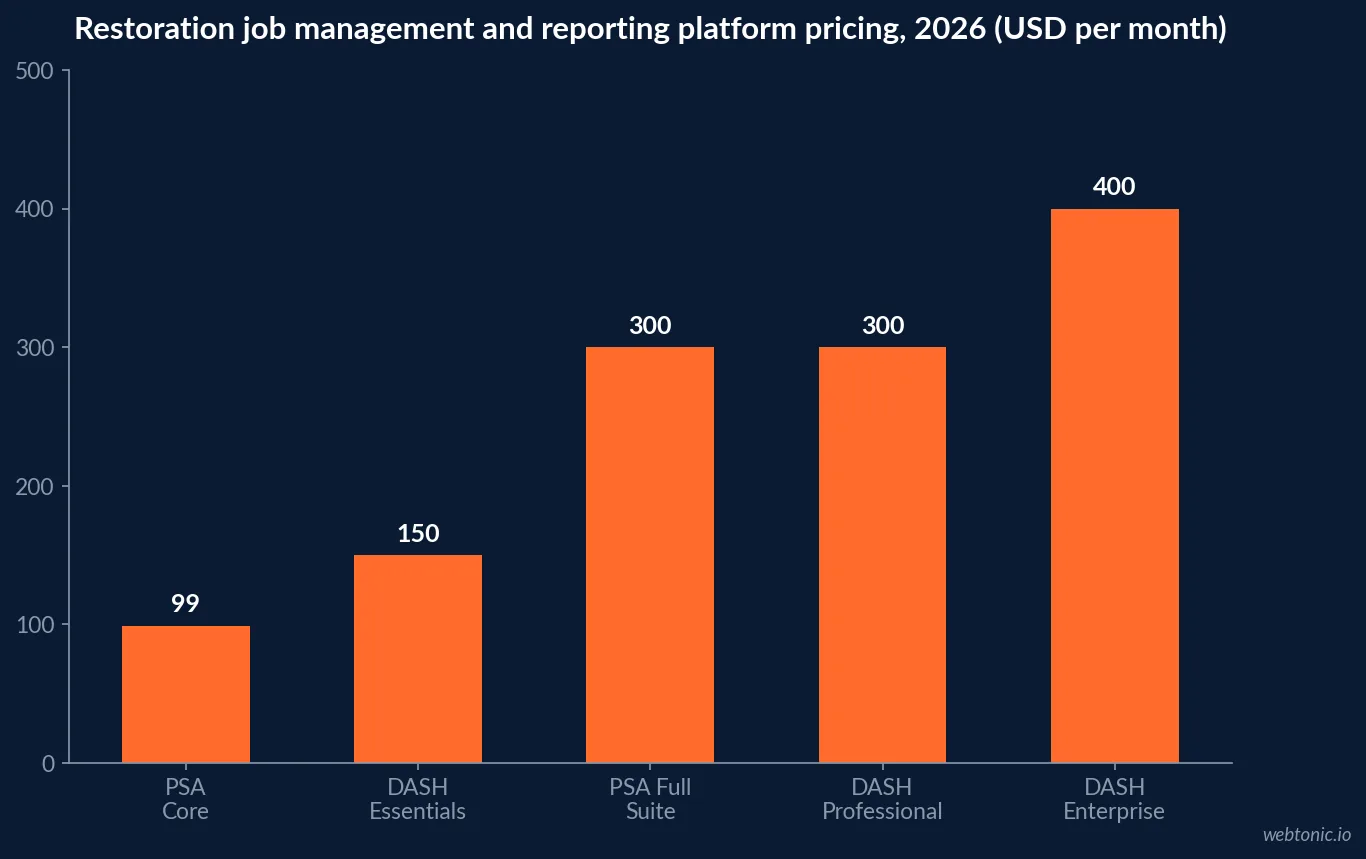
Reporting capability in this vertical is bought, not built, and the prices are knowable. Platform comparisons for 2026 put DASH Essentials at USD 150 a month, Professional at USD 300 and Enterprise - the tier carrying advanced reporting and API access - at USD 400 a month with unlimited users, plus USD 50 for the Xactimate integration. PSA Core starts near USD 99, with the full suite at USD 300. DASH holds roughly 40% market share among restoration companies above USD 1M in revenue, and companies billing USD 75,000 or more a month typically recover its cost within 60-90 days from faster payment cycles alone.
The counterfactual matters more than the price. 51% of US small businesses still run customer relationships on spreadsheets or email, and 76% of CRM features go unused by small businesses that do adopt a platform - so the failure mode is rarely the wrong tool, it is a tool nobody reports out of.
| Platform tier | Monthly price | Reporting strength |
|---|---|---|
| PSA Core | USD 99 | Entry documentation and job tracking |
| DASH Essentials | USD 150 (2 users) | Basic job reporting |
| PSA Full Suite | USD 300 | Equipment utilisation tied to job profit |
| DASH Professional | USD 300 (5 users) | Equipment tracking, mobile capture |
| DASH Enterprise | USD 400 (unlimited) | Job-level margin reporting, API access |
| Xactimate integration | USD 50 add-on | Links approved scope value to the job record |
Reporting cadence: the cheapest upgrade available
Software does not create a review habit. About 73% of home-service owners look at their numbers monthly or less, and 41% have no single source of truth for cost per lead - both fixable without buying anything. Weekly review is associated with 15-25% lower blended customer acquisition cost, and a practical restoration pattern promoted alongside restoration analytics tooling is four separate short meetings - operations, sales, finance and team - each 15-30 minutes and each anchored on one dashboard with assigned actions.
The alternative is the reporting tax. Manual reporting runs about 12.4 hours a week, roughly USD 30,264 a year in loaded time, at 8-12% error rates against under 0.5% for automated pipelines, while dashboard automation cuts reporting time by up to 80% with a reported median first-year return around 340%. On the operations side, a USD 3M shop on the wrong platform loses 40-120 hours of estimator and admin time per month to double entry and late invoicing.
The six-metric restoration dashboard
If a restoration owner will look at one screen a week, this is what belongs on it. Each row has a benchmark, so the screen diagnoses rather than describes.
| Metric | Benchmark to hold against | What a miss usually means |
|---|---|---|
| Days sales outstanding | Target under 60 days | Documentation gaps or slow supplementing |
| Gross margin by service line | See service-line table above | Mix shift or subcontractor creep |
| Mitigation to reconstruction conversion | 60-75% | Handoff or estimating capacity problem |
| Cost per signed job by channel | Referral USD 40-85; LSA USD 125-600 | Channel mix priced on CPL, not close rate |
| Supplement capture rate | Top quartile supplements 70%+ of jobs | Revenue left in the carrier's first estimate |
| Answered-call rate | 52% industry average; 73% on 30s+ calls | Lost demand before any dashboard sees it |
The supplement row deserves emphasis because it is pure recovered revenue. In a dataset of 2,400+ tracked insurance restoration claims, only 31% of jobs were supplemented at all while top-quartile companies supplemented over 70%; companies that supplemented systematically captured roughly 40% more revenue per job. On 200 jobs a year at a USD 4,250 median supplement, that is the difference between about USD 264,000 and USD 595,000 recovered on identical job volume.
Restoration vs other home-services trades
Restoration reporting has to carry two things most trades do not: a third-party payer and a multi-stage job. That is what makes generic contractor dashboards mislead here.
| Reporting dimension | Water damage restoration | Typical home-services trade |
|---|---|---|
| Who pays the invoice | Insurance carrier (often via lender) | Homeowner, at completion |
| Revenue-to-cash lag | 3-8+ weeks, 45-90 day cycles common | Same day to 2 weeks |
| Job stages to track | Mitigation, scope, reconstruction, supplements | One visit |
| Margin variance across services | 25-65% gross | Usually within 15 points |
| Documentation requirement | IICRC S500/S520 evidence trail | Invoice and photos |
How to build the dashboard, in order
- Start with days sales outstanding and gross margin by service line. These two rows change decisions immediately and need no new software - only a clean job-costing field.
- Make lead source a required field on the job record. Without it, no channel row on the dashboard can be trusted; see our restoration SEO statistics for how badly organic emergency demand is undercounted.
- Automate the adjuster-facing reporting first. It is the only reporting output with a documented cash effect: 20-30% faster payment and roughly 60% fewer adjuster calls.
- Set a four-meeting weekly cadence. Fifteen to thirty minutes each, one dashboard per meeting, actions assigned in the room.
- Add supplement capture rate as a tracked KPI. Moving from 31% to 70% of jobs supplemented roughly doubles recovered revenue on the same volume.
- Connect marketing reporting last. Cost per signed job by channel, fed from the job record - our data intelligence and growth marketing teams build this layer after the operational rows exist. Talk to us if you want the build reviewed.
Limits of this data
Be careful with the vendor-reported gains. The 35% faster job completion and 28% higher margin figures attributed to restoration-specific platforms, and the 60% reduction in adjuster calls, are self-reported by platform users and are almost certainly confounded - companies that buy and configure reporting software are already better-run than those on spreadsheets. Treat them as an upper bound. The reporting-time and dashboard-ROI figures are home-services and general analytics aggregates, not restoration measurements. The margin and cash-cycle ranges are the most reliable numbers here, and even those vary with regional carrier behaviour and the mitigation-to-reconstruction mix of a given quarter.
Frequently Asked Questions
What KPIs should a restoration dashboard actually show?
Six numbers, in this order: days sales outstanding on the accounts receivable balance, gross margin by service line, mitigation-to-reconstruction conversion rate, cost per signed job by channel, supplement capture rate, and equipment utilisation. Revenue and lead count belong on a dashboard but they never diagnose anything. The reason margin sits so high is that gross margins swing 25 to 65 percent across service lines - water mitigation at 45-60% or higher, reconstruction at 25-40%, mold at 50-65% - so a mix shift can wipe out a good month while revenue still looks healthy.
How often should restoration owners review the numbers?
Weekly, in short sessions with an owner. Roughly 73% of home-service owners review their numbers monthly or less, and a weekly review cadence is associated with a 15-25% reduction in blended customer acquisition cost. A workable pattern used with restoration analytics platforms is four separate 15-30 minute meetings - operations, sales, finance and team - each anchored on one dashboard rather than one long all-hands review of every metric.
Does restoration-specific software actually improve reporting outcomes?
The reported gains are large enough to warrant scepticism, but the direction is consistent. Restoration companies using specialised platforms report 35% faster job completion and 28% higher profit margins than those using generic tools or spreadsheets, per Restoration & Remediation Magazine 2026. Automated daily reporting to customers and adjusters is credited with cutting adjuster phone calls by an estimated 60% among DASH users, and complete documentation packages speed insurance payment cycles 20-30%. That last figure is the one that pays: it is a cash-cycle effect, not a reporting convenience.
What does reporting the wrong way cost a restoration company?
Time and working capital. Manual reporting consumes about 12.4 hours a week in home-service businesses - roughly USD 30,264 a year in loaded labour - with error rates of 8-12% against under 0.5% for automated pipelines, while dashboards cut reporting time by up to 80%. The bigger number is financial: a USD 3M restoration company on the wrong platform typically loses 40-120 hours of estimator and admin time per month to double entry, missed supplements and late invoicing.
Why does accounts receivable belong on a marketing dashboard?
Because in restoration it decides how much marketing you can afford. A shop with USD 10M in revenue and a 90-day cash cycle carries roughly USD 2.5M in average receivables, and that balance is funding the labour and equipment on the next set of jobs. Compressing the cycle to 60 days drops the working-capital requirement to about USD 1.65M and frees roughly USD 850,000. No paid-media optimisation available to a restoration company releases that much cash, which is why the reporting priority runs cash cycle first, channel performance second.
Sources
PushLeads - Restoration Financial Benchmarks & KPIs 2026
PushLeads - Restoration CRM & Software Comparison 2026
Tygart Media - Restoration AR & Xactimate Cash Cycle
Tygart Media - Restoration Pricing & Profit Margins
Tygart Media - Restoration Business KPI Dashboard
Cleanfax - 2026 Restoration Benchmarking Survey
Albi - Analytics & Weekly Reporting Cadence
HailMate - State of Storm Restoration 2026
Invoca - Home Services Lead Conversion Benchmarks 2026
CustomerFlows - Home Service Business Statistics
Restoration Industry Association - Cost of Doing Business