Table of contents
Water damage restoration has an attribution problem that is structural, not technical. The search happens at 2am, the conversion happens on the phone, the revenue happens after an insurance adjuster approves a scope, and the cash lands three to eight weeks later. Every one of those steps strips identity out of the record. The result: 47% of restoration companies do not track cost per lead by marketing channel and 62% cannot accurately calculate job-level profit margins, according to the Restoration Industry Association's 2025 Financial Performance Study of 400 member companies. Below is the 2026 data on what breaks, what it costs, and the measurement order that actually works in this vertical.
Key Takeaways
- 47% of restoration companies cannot state cost per lead by channel and 38% could not identify their most profitable service type when asked (RIA, 400 companies).
- Roughly 40% of home-services phone leads have no source attached, and only 52% of inbound calls are answered by a person (Invoca, 2026).
- Insurance pays most restoration invoices in 3-8 weeks, with 18%+ waiting longer than eight weeks - past the point where ad platforms will accept the conversion.
- The GA4 Measurement Protocol accepts backdated hits only 72 hours old, and deals closing after roughly 90 days lose Google Ads click association.
- Water damage restoration carries the highest median Local Services Ads cost per lead of 24 home-service trades, with a working range of USD 50-180.
- Clear attribution cuts wasted ad spend 15-30%; tracking spend through to closed jobs is associated with 20-35% higher marketing return.
Restoration attribution benchmarks at a glance
These are the numbers we use to sanity-check a restoration account before touching a campaign. They come from the RIA financial study, Local Services Ads datasets covering 24 trades, and cross-industry attribution research for 2026.
| Metric | 2026 benchmark | Why it matters in restoration |
|---|---|---|
| Companies tracking CPL by channel | 53% | The other 47% budget by feel, not by yield |
| Job-level margin visibility | 38% of companies | Mitigation and reconstruction margins differ by 40 points |
| Phone leads with no source | ~40% | Emergency demand is phone-first, so the gap hits the best leads |
| Inbound calls answered by a person | 52% (65% over 15s) | An unanswered call is an untracked competitor conversion |
| CSR lead-source tagging error rate | 30-50% | Manual tagging cannot carry a budget decision |
| Insurance payment window | 3-8 weeks (18%+ longer) | Revenue lands after the attribution window closes |
| Wasted spend recovered with clear attribution | 15-30% | Bigger than most channel optimisations |
The lag problem: why restoration breaks platform attribution
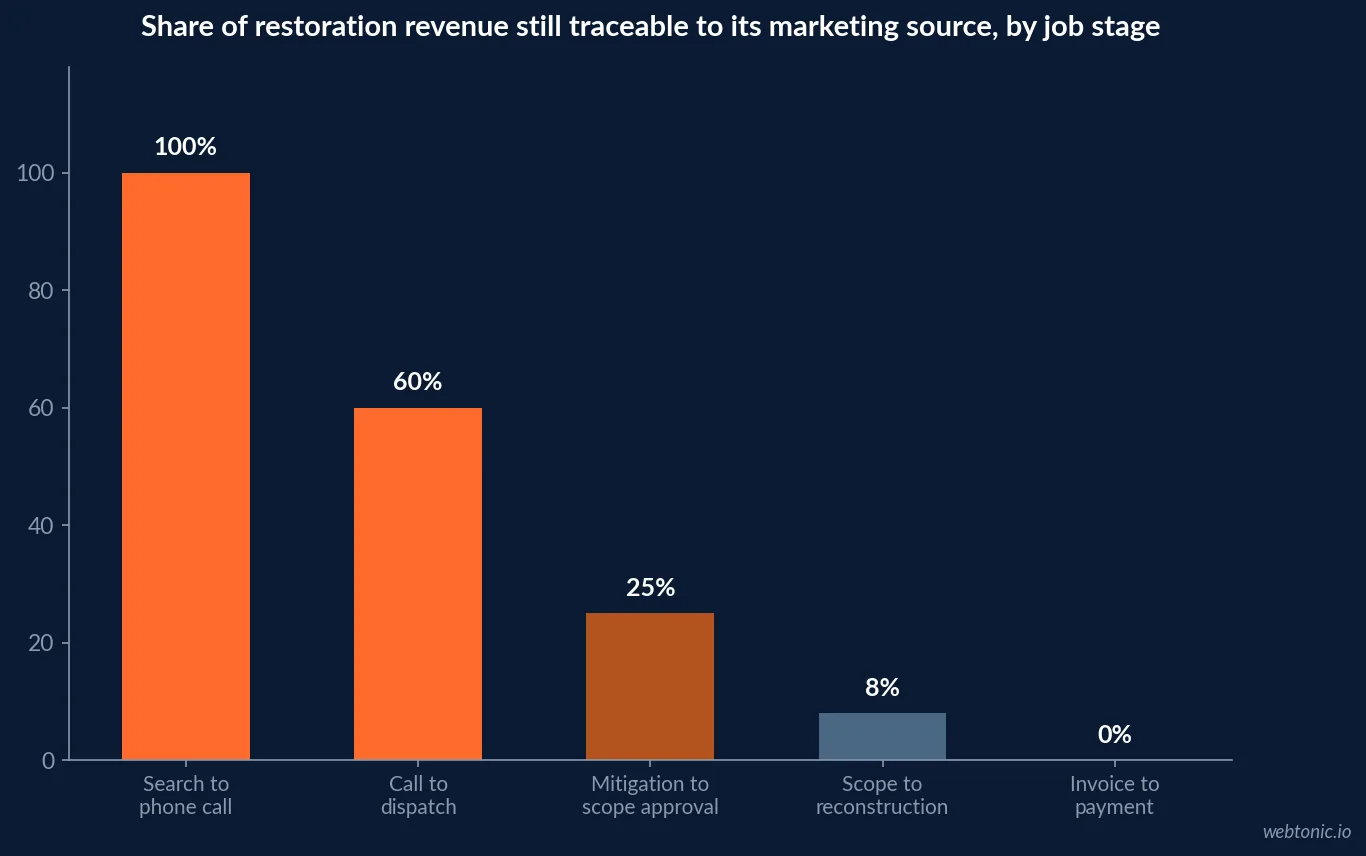
Most attribution guidance assumes a conversion that resolves in hours. Restoration resolves in quarters. A water mitigation job starts within hours of the call, the reconstruction decision follows at a 60-75% mitigation-to-reconstruction conversion rate, and payment clears weeks after that. The 2026 Restoration Benchmarking Survey puts most insurance payment waits at three to eight weeks, with more than 18% of contractors waiting beyond eight weeks.
Now compare that with the tooling. Google Analytics 4 will accept an offline conversion through the Measurement Protocol, but as of May 2026 the maximum backdating window for those hits is 72 hours, per practitioner documentation of the GA4 and CRM integration path, and deals that close more than roughly 90 days after the original session lose their click association. From 15 June 2026, Google Signals no longer governs ad data in GA4, which makes the customer record - not the analytics property - the most complete attribution source a restoration company owns.
| Stage | Typical elapsed time | What is still identifiable |
|---|---|---|
| Search to phone call | Minutes | Click ID, if the call is tracked |
| Call to dispatch | 0-4 hours | Lead source, if the CSR records it |
| Mitigation to scope approval | 3-14 days | Job ID only, unless source is stamped on it |
| Scope to reconstruction decision | 2-6 weeks | Nothing platform-visible |
| Invoice to payment | 3-8+ weeks | Revenue exists; the click is long expired |
The phone is the conversion, and the phone is the leak
Water damage demand is phone-first because it is panic-first. That is also where the data goes missing. The Invoca Home Services Lead Conversion Benchmarks Report 2026 measured what happens to those calls: only 52% of inbound calls to home services businesses are answered by a person, rising to 65% for calls over 15 seconds and 73% for calls over 30 seconds, with sub-industry answer rates spanning 32% to 74%. Of the calls that are answered, 38% are leads and 45% of those leads convert on the call itself - yet 55% of home services businesses never ask the caller to book the job. Independent restoration analyses put the missed-call rate near 30%, usually because technicians are on jobs and the office line is inconsistently staffed, per 99 Calls' restoration lead-cost analysis. Speed compounds the loss: the median first-response time for home service businesses is 42 minutes, only 12% of contractors consistently respond within five minutes, and 27% of inquiries never receive any response at all, per CustomerFlows' home-service benchmark set. Responding inside five minutes makes qualification 21 times more likely, and 78% of customers hire the first contractor who responds with a clear next step.
For measurement, the practical consequence is that your reporting is biased against high-intent channels. Emergency keywords generate calls; calls go untracked; the dashboard then credits the form-fill channels that happen to be measurable. This is the same distortion we documented in restoration SEO statistics, where organic emergency traffic is systematically undercounted.
Cost per lead by channel - and why it is the wrong headline metric
Water damage restoration has the highest median cost per lead of the 24 home-service trades in Blue Grid Media's 2026 Local Services Ads dataset, working from roughly USD 50 to USD 180 against a cross-trade median near USD 40, with mold remediation queries pushing past USD 150 and spikes in the first 24 hours of a major weather event. Paid search runs higher still: 99 Calls reports water damage cost per lead near USD 610 across 107 advertisers, rising to USD 705 for fire and smoke.
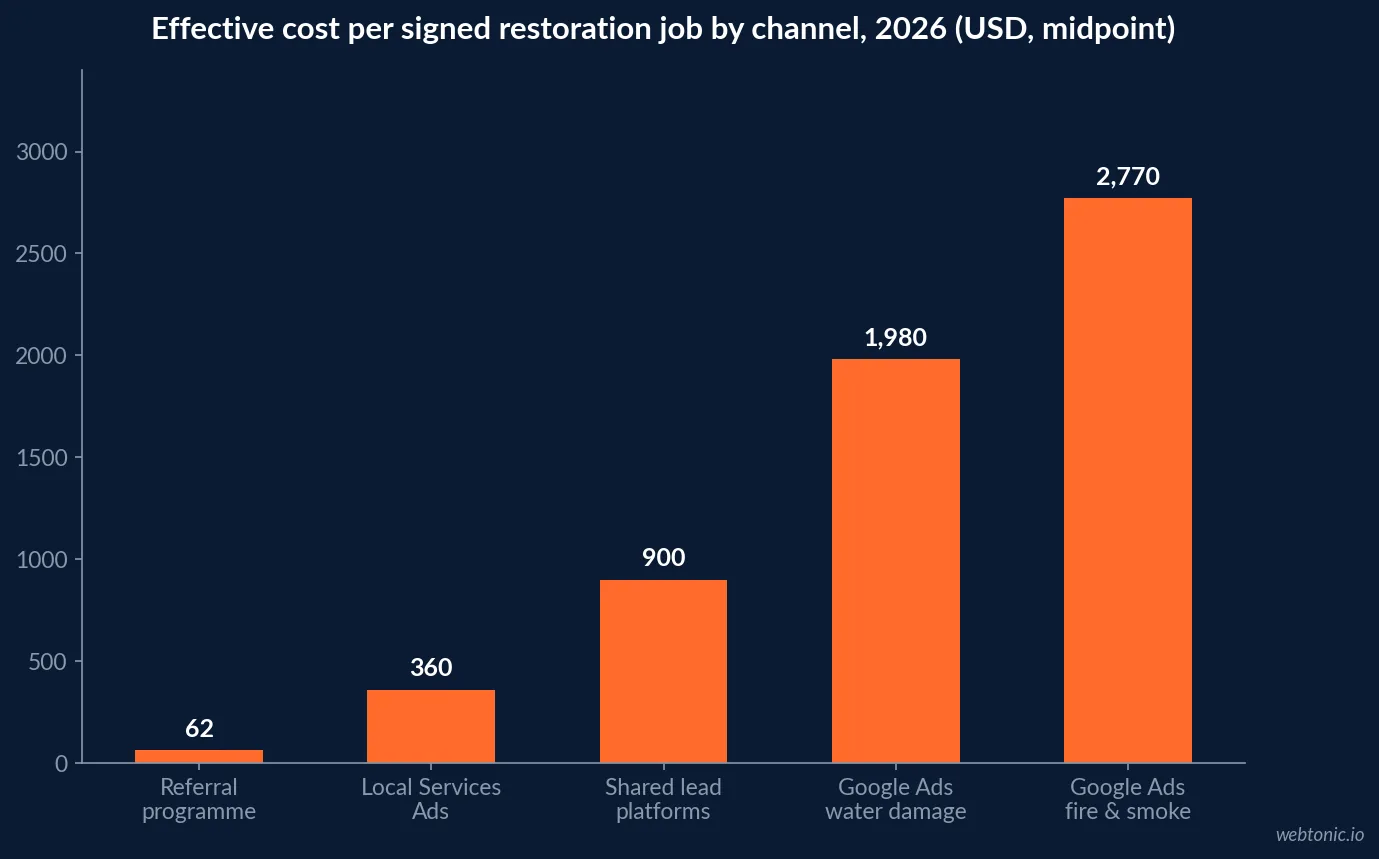
None of those numbers mean anything without a close rate beside them. The table below reprices each channel on cost per signed job, which is the only figure a restoration owner can act on.
| Channel | Cost per lead | Typical close rate | Effective cost per signed job |
|---|---|---|---|
| Referral programme | USD 25-50 | 60%+ | USD 40-85 |
| Local Services Ads (water damage) | USD 50-180 | 25-40% | USD 125-600 |
| Google Ads - water damage terms | USD 610 | 25-40% | USD 1,525-2,440 |
| Google Ads - fire and smoke | USD 705 | 20-35% | USD 2,015-3,525 |
| Shared lead platforms (Angi and similar) | USD 15-85 | 5-15% | USD 100-1,700 |
Two things fall out immediately. Shared-lead platforms with the lowest sticker price produce the widest and worst effective cost, because the lead is sold to several contractors at once. And Local Services Ads leads are disputable - Google reports roughly 15-20% of LSA leads are successfully disputed industry-wide, which means a company that never files disputes is overstating its own cost per lead by a sixth.
Attribution model adoption in 2026
Cross-industry, the models have moved faster than the discipline. Multi-touch attribution is now used by 47% of marketers against 31% in 2023, marketing mix modelling by 26% against 9%, and hybrid approaches by 33%. Yet last-touch is still in use at 41% of organisations, 67% still decide on last-touch regardless of what else is installed, and only 18% of multi-touch builds are rated accurate by their own operators. Privacy changes removed an estimated 30-40% of trackable conversions, with machine learning recovering perhaps 60-75% of them, and offline touchpoints are 2.4 times more predictive of revenue than the online ones most models over-weight.
For a restoration company, the ranking is unambiguous: the marginal value of a better model is far below the marginal value of a complete lead-source field. 75% of companies have moved to multi-touch models, but a model fed by 40% unattributed calls is a rounding exercise.
What a restoration attribution stack costs to build
The good news is that this is a four-figure problem, not a six-figure one. Call tracking runs USD 50-150 a month and cuts cost per lead 10-20% by exposing which campaigns produce answered calls. Restoration-specific job management platforms start at USD 99-150 a month, and the reporting tiers that carry job-level margin - DASH Enterprise at USD 400 a month, PSA Full Suite at USD 300 - sit below the cost of a single wasted month of paid search in a competitive market, where restoration clicks reach USD 80 and cost per lead exceeds USD 1,400.
| Layer | Monthly cost | Attribution gap it closes |
|---|---|---|
| Call tracking with dynamic number insertion | USD 50-150 | The ~40% of calls with no source |
| Required lead-source field in the job record | Process only | CSR tagging error of 30-50% |
| Job management platform with margin reporting | USD 99-400 | 62% job-level margin blind spot |
| Xactimate integration | USD 50 add-on | Ties approved scope value to the job ID |
| Offline conversion import to ad platforms | Setup only | Feeds signed jobs back into bidding |
Restoration vs all industries: the measurement gap
Restoration is not uniquely careless; it is uniquely penalised for the same carelessness, because average job values are high and the payment lag is long. A single mis-attributed decision moves more money here than in most verticals: residential jobs run USD 3,000-12,000 and commercial work runs USD 8,000-120,000 or more.
| Signal | Water damage restoration | Cross-industry / all sectors |
|---|---|---|
| Tracks cost per lead by channel | 53% | ~70% of mid-market marketers |
| Knows profit by service line | 38% | Majority in product businesses |
| Primary conversion type | Inbound phone call | Form or checkout |
| Revenue recognition lag | 3-8+ weeks | Same session to 30 days |
| Marketing spend as % of revenue | 3-9% (10-20% for startups) | 8-11% typical |
How to fix restoration attribution in the right order
- Install call tracking before anything else. Dynamic number insertion on the site plus unique numbers per channel. Expect a 10-20% cost-per-lead improvement from visibility alone, and audit the answered-call rate against the ~30% miss benchmark.
- Make lead source a required field on the job, not on the lead. The job ID is the only identifier that survives to payment. Stamp it on day one.
- Report cost per signed job, not cost per lead. Rebuild every channel table with close rate applied, as above.
- Import signed jobs back into the ad platforms. Offline conversion import inside the accepted window turns bidding toward jobs instead of form fills - our data intelligence team treats this as the first build, not the last.
- Reconcile monthly against the accounting system. Keep separate columns for event time, upload time, attributed click date and job stage date; a reconciliation report is what catches a broken click-ID hand-off before a quarter of budget is misread.
- Only then add a model. Data-driven attribution lifts measured return roughly 18% over last-click - on clean inputs. See our growth marketing approach or contact us for a stack review.
Limits of this data
Three caveats worth stating plainly. First, the strongest vertical figures here - the 47% channel-tracking gap, the 62% margin gap, the 38% service-profitability gap - come from the Restoration Industry Association's study of 400 member companies, so they describe organised, association-affiliated firms and likely understate the gap across the wider population of roughly 62,582 restoration businesses. Second, the phone and speed-to-lead figures are home-services aggregates rather than restoration-specific measurements; the direction is reliable, the exact percentage is not. Third, cost-per-lead ranges are advertiser-sample medians that move sharply with weather events, so treat them as planning ranges rather than forecasts.
Frequently Asked Questions
Why is attribution harder in water damage restoration than in most industries?
Because the conversion and the cash are separated by weeks. A burst-pipe search converts as a phone call, the call becomes a mitigation job, the mitigation job becomes an insurance claim, and the claim pays in three to eight weeks - with more than 18% of contractors waiting beyond eight weeks. Ad platforms need the outcome inside a much shorter window: the Google Analytics 4 Measurement Protocol caps backdated hits at 72 hours, and deals closing after roughly 90 days lose their Google Ads click association entirely. So the channel that produced the revenue is usually unprovable by the time the revenue exists, unless the job ID is stamped with the lead source on day one.
How many restoration leads arrive with no identifiable source?
Around 40% of home-services phone leads carry no source data at all, and businesses miss roughly 30% of inbound calls in the first place, according to research cited by Invoca - which in restoration means the highest-intent leads are the ones most likely to vanish from reporting. Customer service representatives also mis-tag lead sources 30-50% of the time when tagging is manual. That is why call tracking with dynamic number insertion is the single highest-leverage attribution fix in this vertical: it typically cuts cost per lead 10-20% simply by revealing which campaigns generate answered calls.
What should a restoration company measure instead of cost per lead?
Cost per signed job and cost per approved claim dollar. Cost per lead flatters shared-lead platforms, where close rates run 5-15%, and punishes referral programs that close above 60%. A USD 50 lead at a 10% close rate costs USD 500 per job; a USD 180 Local Services Ads lead at a 35% close rate costs roughly USD 514 but arrives with emergency intent and a larger scope. Companies that track ad spend through to closed jobs report 20-35% higher marketing return than companies tracking clicks alone.
Does multi-touch attribution make sense for a restoration company?
Only after the basics exist. Multi-touch attribution is now used by 47% of marketers, up from 31% in 2023, but only 18% of those builds are rated accurate by the teams running them - and 67% of organisations still make decisions on last-touch anyway. For a USD 1-5M restoration company, the sequence that pays is call tracking, then lead source as a required field in the job record, then channel-to-job margin reporting. Modelled multi-touch on top of untagged phone calls just adds decimal places to a guess.
How much wasted spend does better attribution actually recover?
Organisations with clear attribution models reduce wasted advertising spend by 15-30%, and mature attribution programmes show roughly 23% less wasted spend than immature ones. Switching from last-click to data-driven models lifts measured return on ad spend about 18%. In restoration terms, a company spending 3-9% of revenue on marketing at USD 2.5M in revenue is deciding the fate of roughly USD 75,000-225,000 a year, so a 20% waste reduction is USD 15,000-45,000 recovered without adding a single lead.
Sources
PushLeads - Restoration Financial Benchmarks & KPIs (2026)
Restoration Industry Association
Cleanfax - 2026 Restoration Benchmarking Survey
Blue Grid Media - LSA Cost Per Lead by Industry 2026
99 Calls - Water Damage Restoration Lead Costs
99 Calls Blog - Improving Restoration Lead Performance
Invoca - Call Tracking Statistics
CustomerFlows - Home Service Benchmarks
Ad Astra - GA4 + CRM Integration for Full Attribution
MetricFixer - Offline Conversion Reconciliation
Proofco - The State of Restoration