



Table of contents

A freight-quote landing page and a driver-application landing page are two different conversion problems wearing the same template, and no publisher tracks trucking-specific CRO benchmarks the way WordStream tracks paid-search benchmarks. This page builds the honest picture from the closest verified numbers - cross-industry landing page medians, three documented freight/logistics CRO case studies, and the driver-recruiting ad data that behaves nothing like a shipper quote form.
Key Takeaways
- 6.6% is the all-industry median landing page conversion rate, per Unbounce's analysis of 41,000+ pages.
- Truckstop.com lifted a broker/carrier quote form 26% through a structured CRO program with VWO.
- A separate 3PL saw a 143% jump in quote requests from fixing one hidden footer form.
- One auto-transport rebuild reported 15-25% conversion after cutting an over-long quote form.
- Career and Employment ads convert around 3.05% in WordStream's 2026 benchmark - the driver-recruiting proxy.
- Cost per lead for Career and Employment rose 7.26% year over year in the same 2026 report.
- The average Google Ads cost per lead is $66.69 across the 23 industries WordStream tracks.
- Average conversion rate across those industries is 8.18%, up in 87% of tracked industries.
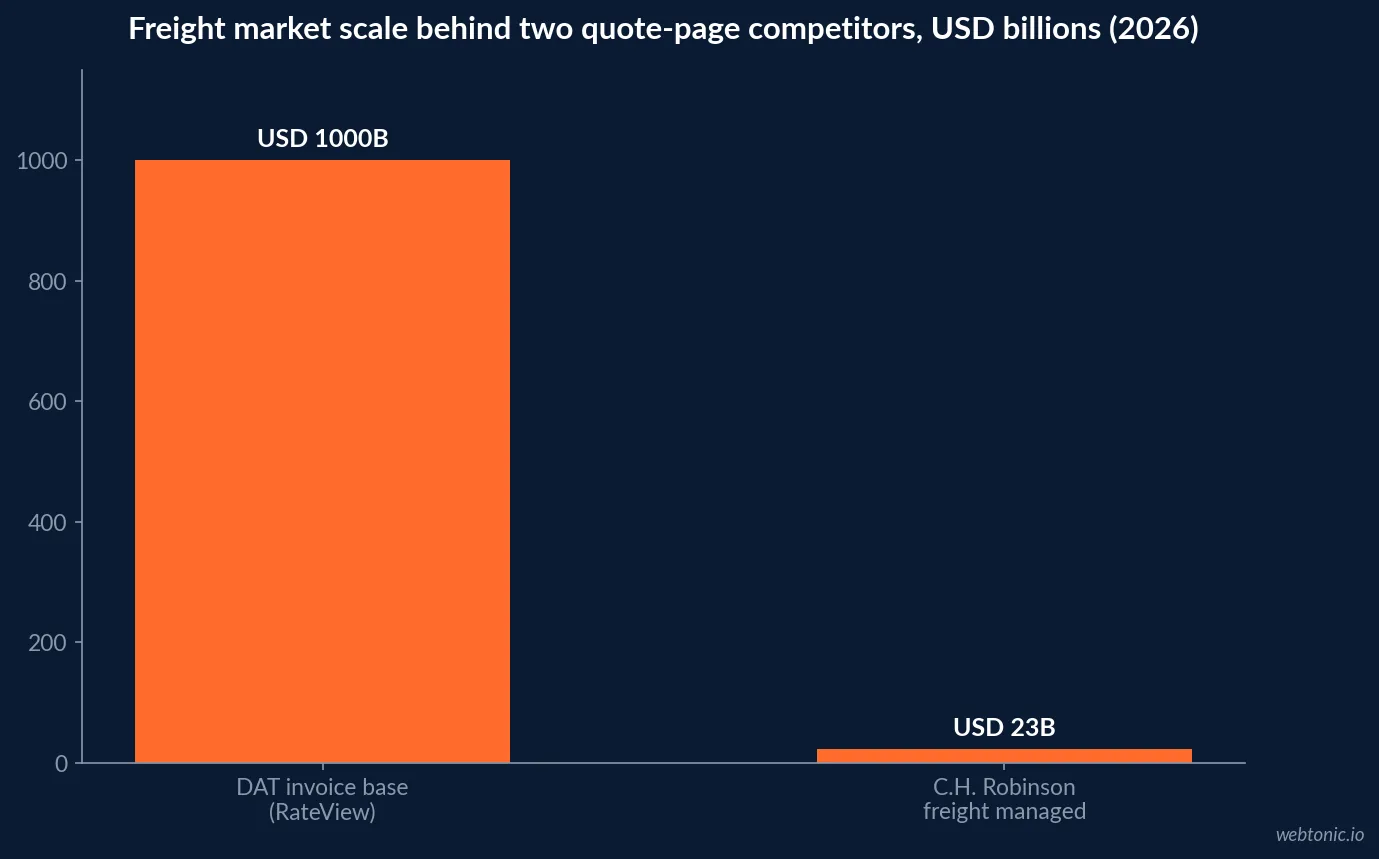
- DAT's RateView is built from $1 trillion in freight invoices, the scale a quote page has to sound credible against.
- C.H. Robinson manages about 37 million shipments a year for 75,000 active customers.
- Trucks moved 72.7% of U.S. freight tonnage in 2024, per American Trucking Associations.
- The 2024 U.S. trucking freight bill was $906 billion, ATA's own tracked figure.
- ATA's last published driver shortage estimate was 80,000, from an October 2021 update.
- ATRI's operating-cost data shows driver compensation above $1.00 a mile for the first time in 2025.
- Combined driver wages plus benefits reached $1.028 a mile in that same 2025 dataset.
- DAT's forecasting model runs over 7 million daily predictions at above 95% accuracy.
- EEOC has pursued active age-discrimination suits against carriers over hiring practices as recently as 2025.
- A 3-step calculator replacing a static form is the recurring pattern behind every reported win in this data set.
Why there is no trucking-specific CRO benchmark
Landing page benchmark studies segment by broad vertical - SaaS, legal, financial services, ecommerce - and trucking and logistics is not one of the segments Unbounce or WordStream break out. That leaves two honest options: the all-industry median, and documented case studies from companies that actually sell into freight. Both are used here, and neither is presented as a trucking-wide average.
Unbounce's dataset - more than 41,000 landing pages, 464 million pageviews, 57 million conversions - puts the all-industry median conversion rate at 6.6%. That is the fairest neutral anchor available for a shipper-facing quote page; it is not a trucking number, and this page says so every time it is used.
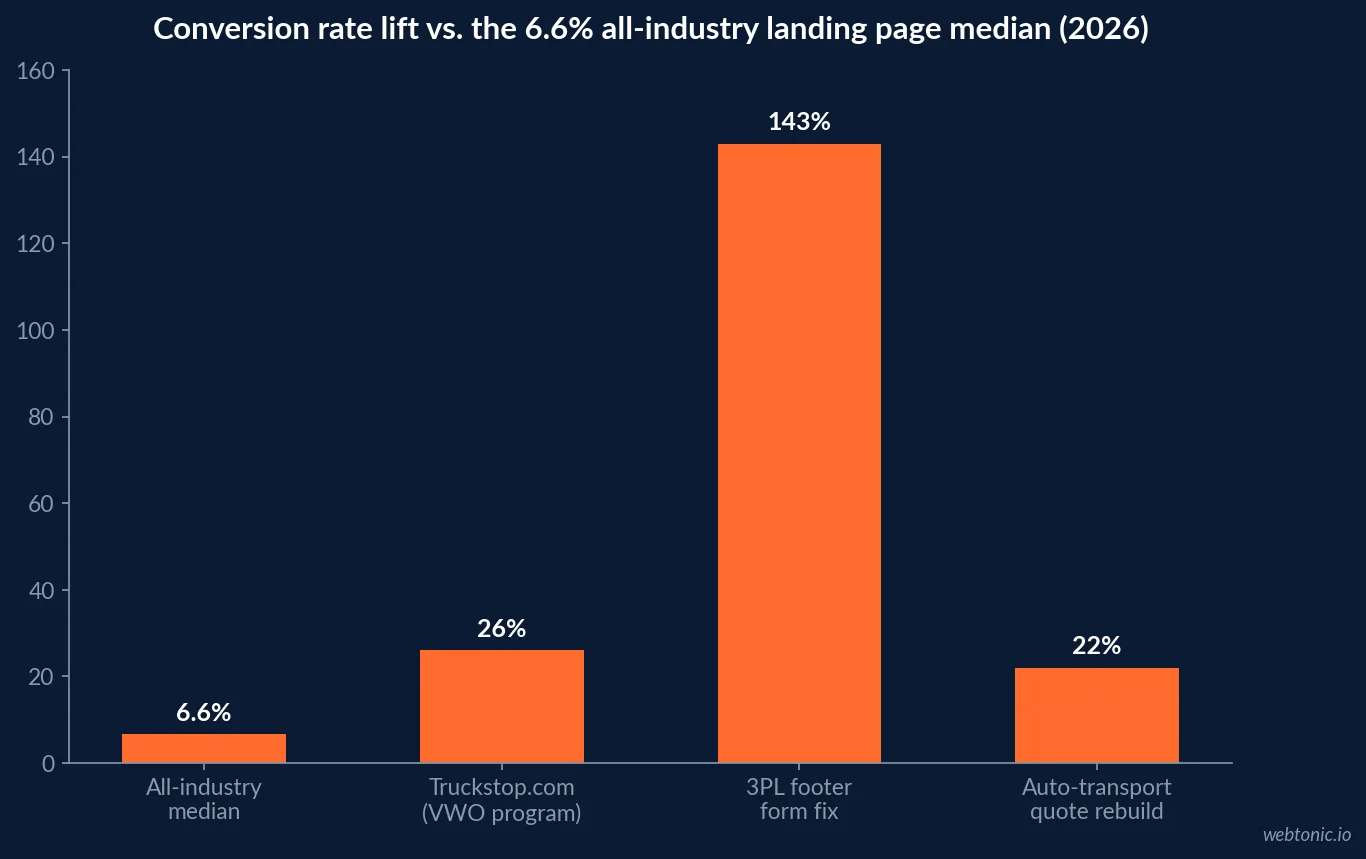
| Case | What changed | Reported result | Source |
|---|---|---|---|
| Truckstop.com (broker/carrier quote form) | Structured CRO program, 1,000+ session recordings reviewed | 26% lift (64.96% to 81.71% control vs. variant) | VWO case study |
| 3PL footer quote form | Fixed a hidden footer form | 143% increase in quote requests, one month | Agency-reported case study |
| Auto-transport quote page | Cut form fields, redesigned for mobile | From ~2% to a reported 15-25% | Agency-reported case study |
| Konnect Logistics | Built a 3-step instant freight calculator on a real-time rate API | Directional lift; exact rate not published | Agency-reported case study |
| All-industry landing pages | N/A - baseline | 6.6% median conversion rate | Unbounce, 41,000+ pages |
The pattern behind every reported win
Read across the case studies and one design decision repeats: price before contact information. Konnect Logistics' documented rebuild replaced a static request form with a three-step origin-destination-weight-or-volume calculator wired to a real-time rate API, paired with sticky "Get Instant Quote" and "Book Now" calls to action on mobile. The Truckstop.com program found the same friction from the other direction - reviewing over 1,000 session recordings before touching a single button.
None of these figures generalize into a universal freight-page conversion rate. What they do support is a testable hypothesis: a form that asks a shipper to guess their own rate before it will show a number is competing against a load board that will just show the number.
| Quote-page element | What the case data shows | Risk if skipped |
|---|---|---|
| Instant price before contact fields | Konnect Logistics: origin-destination-weight calculator with live rate API | Shipper bounces to a load board that prices instantly |
| Session-recording review before redesign | Truckstop.com/VWO: 1,000+ recordings reviewed pre-test | Redesign fixes the wrong friction point |
| Footer/placement audit | 3PL case: a hidden footer form was the single biggest fix | A working form nobody scrolls to still converts at zero |
| Mobile-first CTA structure | Konnect Logistics: sticky mobile header CTAs | Freight brokers and dispatchers work heavily from a phone |
The scale a freight quote page is competing against
A carrier's quote form is not just competing with another carrier's form - it is competing with software that already knows the market rate. DAT's RateView pulls from $1 trillion in verified freight invoices and runs more than 7 million daily rate predictions at over 95% accuracy, and C.H. Robinson reports managing about 37 million shipments a year, worth roughly USD 23 billion in freight, for 75,000 active customers across more than 450,000 contract carriers. A landing page that asks a shipper to "request a quote" and wait is competing with tools that already show one.
That context is also why an instant-quote widget outperforms a lead-capture form in every case study collected here - the buyer's expectation has already been set by the largest players in the market.
Driver-recruiting pages are a separate funnel, with separate math
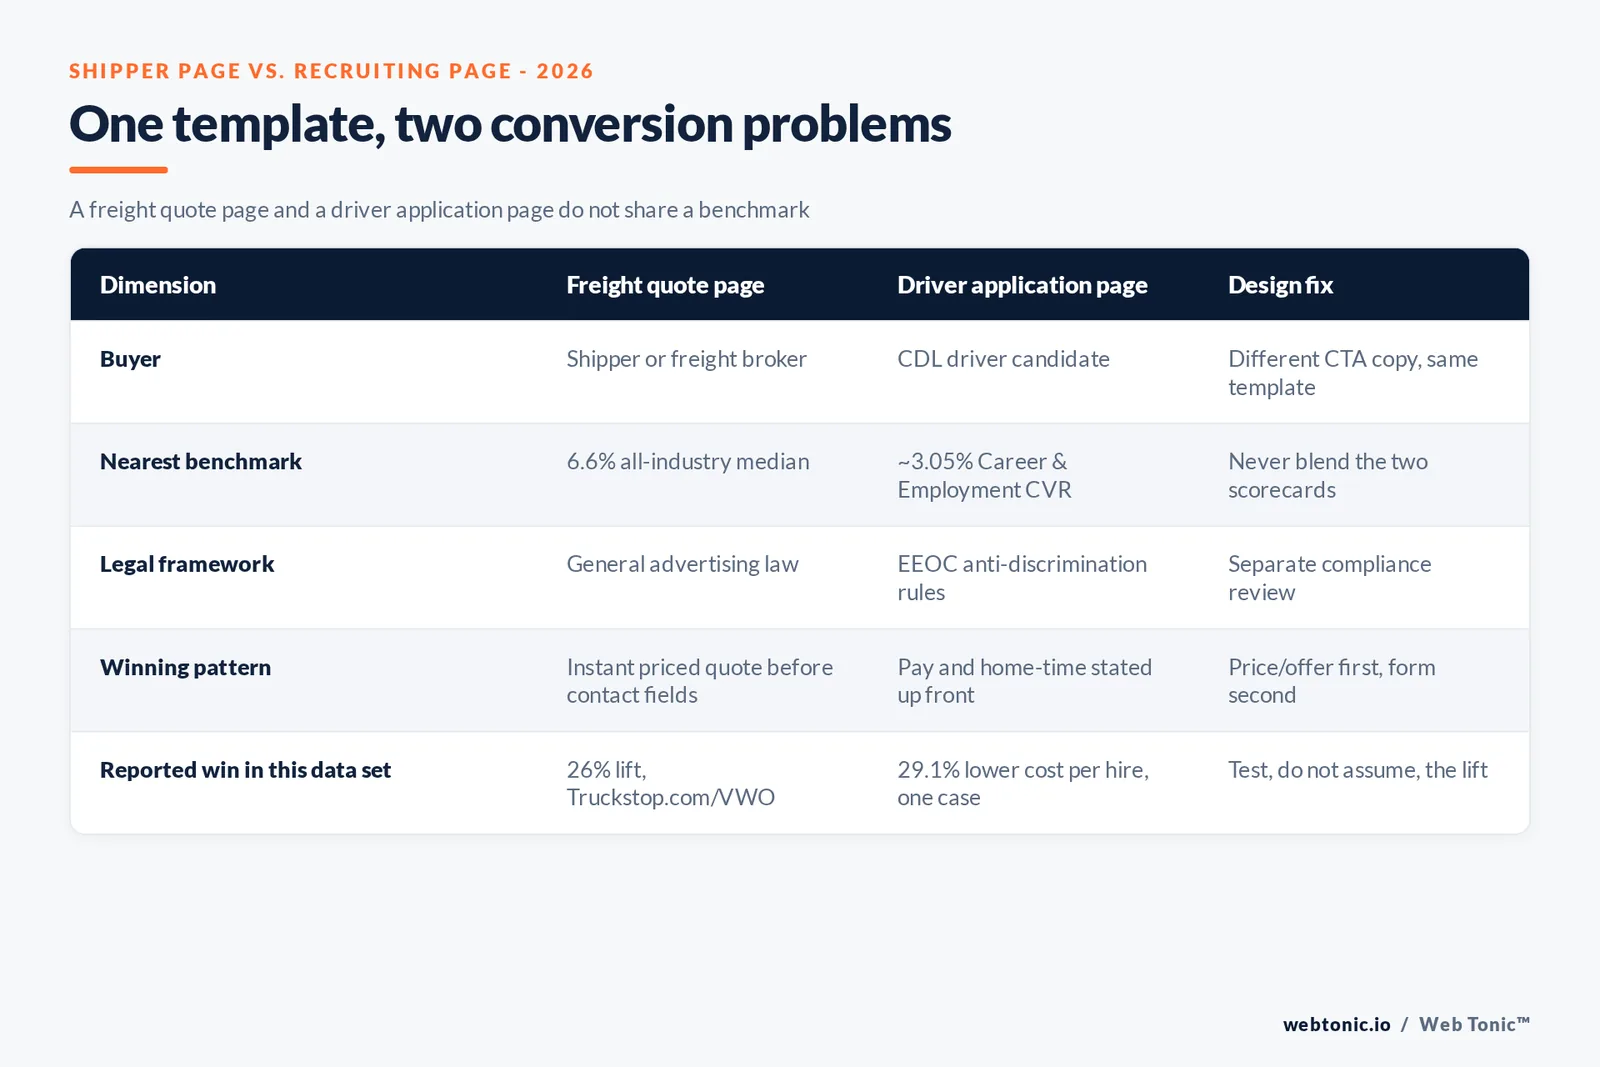
Publishers do not track "trucking driver recruiting" as a paid-search category either, so the closest proxy is WordStream's 2026 Google Ads benchmark report's "Career and Employment" vertical - the category a job-ad landing page actually competes in. That category converts around 3.05%, among the lowest of the 23 tracked industries, and its cost per lead rose 7.26% year over year, one of the three biggest increases in the report. The all-industry average cost per lead is $66.69 and the average conversion rate is 8.18%, so a driver-application page benchmarked against that all-industry number will look broken when it is actually performing in line with every other job-ad category.
| Metric (WordStream 2026) | All-industry average | Career & Employment (recruiting proxy) |
|---|---|---|
| Conversion rate | 8.18% | ~3.05% (among the three lowest categories) |
| Cost per lead | $66.69 | Up 7.26% YoY - one of the three largest increases |
| Click-through rate | 6.64% | Not among top or bottom three; mid-pack |
| Year-over-year CVR trend | Increased in 87% of industries | Down 2 years running per WordStream's category notes |
The industry the pages are actually selling into
Every conversion number on this page sits on top of a freight market that has not gotten easier to sell into. American Trucking Associations reports that trucks moved 72.7% of the nation's freight by weight in 2024, generating an estimated $906 billion freight bill. ATA's chief economist last publicly updated the driver-shortage estimate to 80,000 in an October 2021 release, projecting it could reach 160,000 by 2030 - a figure that is frequently re-quoted at higher numbers in trade press without a matching ATA update, which is worth knowing before citing it in a proposal.
On the cost side, the American Transportation Research Institute's 2026 operating-cost update, reported by Heavy Duty Trucking, found combined driver wages and benefits reached $1.028 a mile in 2025 - the first year that figure passed a dollar - which is the budget context any driver-recruiting landing page is arguing against.
| Industry fact (verified year) | Figure | Source |
|---|---|---|
| Share of U.S. freight tonnage moved by truck | 72.7% (2024) | American Trucking Associations |
| U.S. trucking freight bill | $906 billion (2024) | American Trucking Associations |
| ATA's last published driver shortage estimate | 80,000 (Oct. 2021 release) | American Trucking Associations |
| Combined driver wages + benefits per mile | $1.028/mile (2025), first year above $1.00 | ATRI, reported by Heavy Duty Trucking |
| Freight invoices behind DAT's rate data | $1 trillion | DAT Freight & Analytics |
What "good" looks like, by page type
Because no single benchmark covers both funnels, a workable target has to borrow the closest verified number for each page type rather than average them together.
| Page type | Nearest verified benchmark | Reasonable target | Do not benchmark against |
|---|---|---|---|
| Shipper freight-quote page | Unbounce all-industry median, 6.6% | 6.6%+ once an instant-quote step is live | Career & Employment CVR (3.05%) - different buyer |
| Driver-application page | WordStream Career & Employment CVR, ~3.05% | 3-4% is competitive for this category | All-industry median (6.6%) - too high a bar |
| Broker/carrier portal login or signup | Truckstop.com/VWO documented 26% lift on a comparable form | Treat as a CRO test target, not a static rate | A single blended trucking benchmark - none is published |
The cost of blending the two funnels into one number
Blending a driver-recruiting funnel into a shipper-facing CRO scorecard produces a number that undersells the freight side and oversells the recruiting side. If the Career and Employment cost-per-lead trend (up 7.26% year over year) gets reported next to the freight-quote conversion rate as one blended "landing page performance" metric, a marketing team ends up cutting freight-quote spend that is working to chase a recruiting metric that is behaving exactly as the category predicts.
The fix is reporting structure, not a design change: split the dashboard by funnel before the first review, using the two benchmark rows above as the baseline each is measured against.
A short self-audit before the next redesign
- Is the quote priced before contact fields are asked for? Every reported CRO win in this data set made that change first.
- Is the form actually visible? The 3PL case study's entire fix was moving a form out of the footer.
- Are driver-application pages reported against Career & Employment data, not the all-industry median? A 3.05% recruiting page and a 6.6% shipper page are not the same scorecard.
- Does any recruiting-ad copy reference an age range or physical requirement not tied to the job itself? That is the exact fact pattern in the EEOC's 2025 suit against a carrier.
What a compliance review should check separately
A driver-application page is a job posting, and job postings sit under EEOC anti-discrimination rules - the EEOC's 2025 suit against Gamer Logistics over an age-based hiring policy is a live reminder that "35 and under" or "must be under 65" language in a recruiting landing page is a real legal exposure, not a copywriting choice. A shipper-facing quote page carries no such restriction. Auditing the two funnels under one "landing page compliance" checklist misses that the rules genuinely differ.
How to read a freight or recruiting page's numbers honestly
Compare a freight-quote page against the 6.6% all-industry landing-page median and the documented CRO case pattern - instant pricing before contact fields - rather than against another carrier's unverified claim. Compare a driver-application page against the Career and Employment category, not the all-industry average, since the two run roughly 5 percentage points apart on conversion rate. Our performance creative team builds both page types from that split benchmark rather than one blended number, and our broader conversion-rate research covers how that 6.6% median compares across other industries. If the quote experience needs a rebuild, talk to us about what an instant-rate page takes to ship.
Frequently Asked Questions
What is a good conversion rate for a trucking company landing page?
There is no trucking-specific published benchmark, so the honest anchor is the closest verified numbers. Unbounce's analysis of over 41,000 landing pages puts the all-industry median at 6.6%, and one documented auto-transport quote-form rebuild moved from roughly 2% to a reported 15-25% after cutting fields and adding an instant price step. A freight quote form sitting under 3% is closer to the industry floor than the ceiling.
Does a shorter quote form actually convert more freight leads?
The direction is consistent across the case data even where the exact lift is not comparable across studies. Truckstop.com's VWO-run program lifted a broker/carrier quote form 26% by fixing friction the team found through session recordings, and a separate 3PL rebuild reported a 143% increase in quote requests from fixing one hidden footer form. Neither number generalizes to every carrier, but both point the same direction: forms buried in navigation or asking for too much up front lose freight leads before the quote is even priced.
Should a driver-application landing page be judged by the same benchmark as a shipper quote page?
No, and treating them the same is the most common measurement mistake we see. WordStream's 2026 benchmark puts Career and Employment among the lowest-converting Google Ads categories at roughly 3.05% conversion rate, with cost per lead up 7.26% year over year - and a driver-application page is a job-ad landing page, not a B2B quote page. Report the two funnels separately or the driver-recruiting numbers will drag down a shipper-facing CRO scorecard that is actually healthy.
What actually moves freight-quote conversion, based on the published case work?
An instant, priced quote before any contact information is asked for. Konnect Logistics' documented rebuild replaced a static form with a three-step origin-destination-weight calculator wired to a real-time rate API, paired with sticky mobile CTAs. That sequencing - price first, contact details second - is the pattern behind every reported win in this batch of sources, not any particular headline color or button copy.
Are driver-recruiting landing pages subject to different legal rules than shipper pages?
Yes. Driver-recruiting ads and application pages are job postings, which puts them under the same EEOC anti-discrimination framework as any other hiring ad - the EEOC has pursued age-discrimination cases against carriers over hiring practices, including a 2025 suit against Gamer Logistics. Shipper-facing quote pages carry no such restriction; conflating the two funnels in one compliance review is a common gap.
Sources
Unbounce - Conversion Benchmark Report
VWO - Truckstop.com success story (26% conversion lift)
WordStream/LocaliQ - Search Advertising Benchmarks by Industry, 2026
DAT Freight & Analytics - RateView Analytics
C.H. Robinson - Investor Relations overview
American Trucking Associations - Economics and Industry Data
American Trucking Associations - Driver shortage estimate, October 2021
Heavy Duty Trucking - ATRI 2026 operating cost update
U.S. Equal Employment Opportunity Commission - EEOC v. Gamer Logistics
Compare The Carrier - Auto transport landing page redesign (agency's own client case study)


