Table of contents
TikTok has evolved from an experimental add-on channel into a dominant e-commerce advertising platform, with TikTok Shop US GMV hitting $32 billion in H1 2026 (up 61% YoY) and US ad revenue crossing $12.4 billion annually. Here is the comprehensive statistical picture of TikTok advertising performance for online retailers in 2026.
Key Takeaways
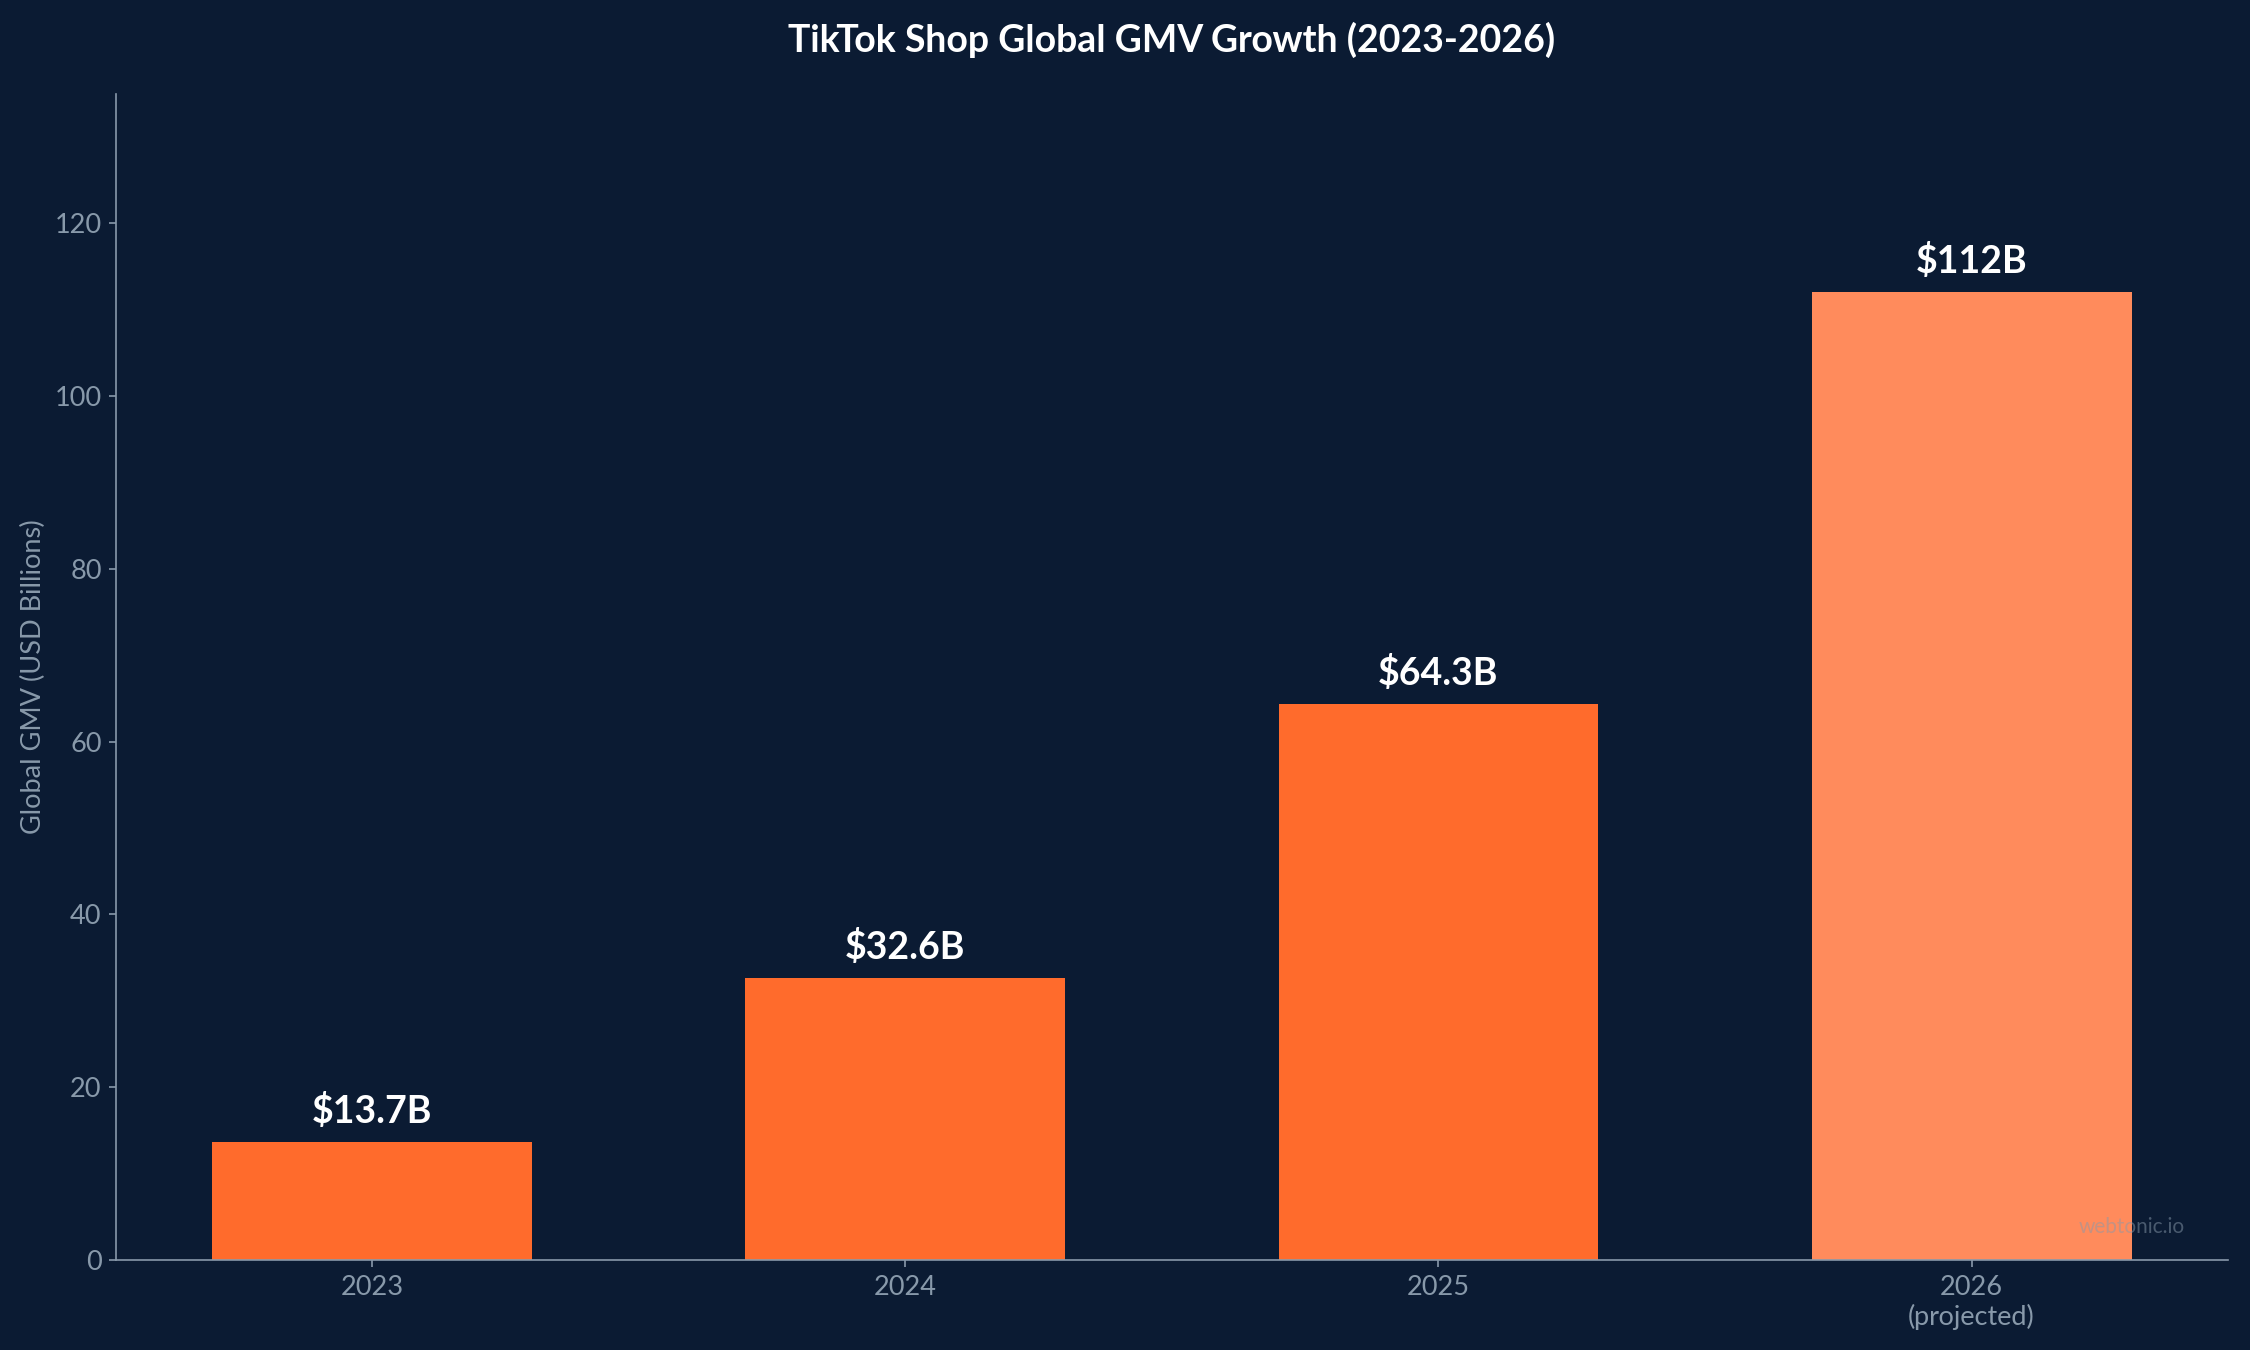
- TikTok Shop global GMV reached $64.3 billion in 2025, nearly doubling from $32.6 billion in 2024, and is projected to surpass $112 billion in 2026.
- US TikTok Shop GMV hit $32 billion in H1 2026 alone, up 61% year-over-year, per Momentum Commerce data.
- E-commerce ROAS benchmark is 2.5x or higher, with top DTC brands achieving 3.5-5.0x after the initial 60-day optimization window.
- Average e-commerce CPM ranges from $9 to $14, materially cheaper than Meta on a raw basis according to agency benchmarks.
- TikTok Shop destination campaigns convert at 3.7%, nearly double the 1.92% average for external landing page campaigns.
- TikTok currently captures approximately 2.3% of the median DTC ad budget, but this share is growing as TikTok Shop subsidizes ad credits and creator commissions.
- Spark Ads deliver 2.4x higher engagement than standard in-feed ads, making creator-amplified content the strongest performing format.
E-Commerce TikTok Ads Benchmarks at a Glance
| Metric | E-Commerce Benchmark | Source |
|---|---|---|
| CPM | $9-$14 | D2C Times / Pilothouse |
| CPC | $1.00-$2.00 | ConversionStudio |
| CTR | 1.18% median | AdLiftr |
| CVR (external LP) | 1.92% | Triple Whale / AIAdvantage |
| CVR (TikTok Shop) | 3.7% | AIAdvantageAgency |
| CPA (purchase) | $12-$35 | ConversionStudio |
| ROAS (baseline) | 2.5x | AGrowth.io |
| Spark Ads Engagement Lift | 2.4x | TikTokAdSuite |
TikTok Shop: The Commerce Engine Reshaping E-Commerce
TikTok Shop has transformed the platform from a demand-generation channel into a full-funnel commerce engine. According to Axis Intelligence, global TikTok Shop GMV reached $64.3 billion in 2025, nearly doubling from $32.6 billion in 2024. For 2026, projections range from a conservative $50 billion to an aggressive $72 billion globally, with the base case at $60 billion.
In the US market specifically, Momentum Commerce data shows TikTok Shop hit $32 billion in GMV during H1 2026 alone, up 61% year-over-year. This rapid growth is forcing Amazon and Shopify to accelerate their own social commerce responses. The commerce share is breaking down by vertical: beauty captures approximately 22% of TikTok Shop sales, fashion 24%, and food 7%, according to Eightx vertical analysis.
TikTok's aggressive merchant acquisition strategy for Q4 2026 includes subsidized ad credits totaling an estimated $12 billion, expanded creator commission matching, and a Guaranteed Sale fulfillment program, per Ecommerce Times reporting. This signals commitment to building a commerce ecosystem that rivals established marketplaces.
TikTok Ads Cost Benchmarks for E-Commerce Brands
TikTok's cost structure has evolved significantly as the platform matures. According to AdLiftr's 2026 benchmarks, the median e-commerce CTR is 1.18%, approximately 38% higher than equivalent Meta inventory. However, Influee's analysis notes that CPM rose 16% and CTR rose 13.74% in 2025, but CVR fell 6.2% and ROAS fell 5.7% meaning more clicks but fewer sales.
| Campaign Objective | Typical CPM | Typical CPC | Typical CPA |
|---|---|---|---|
| Video Views | $4-$8 | N/A | $0.02-$0.05/view |
| Traffic | $6-$10 | $0.50-$1.00 | N/A |
| Conversions (E-Commerce) | $8-$15 | $1.00-$2.00 | $12-$35/purchase |
| App Install | $8-$12 | $1.00-$2.50 | $3-$8/install |
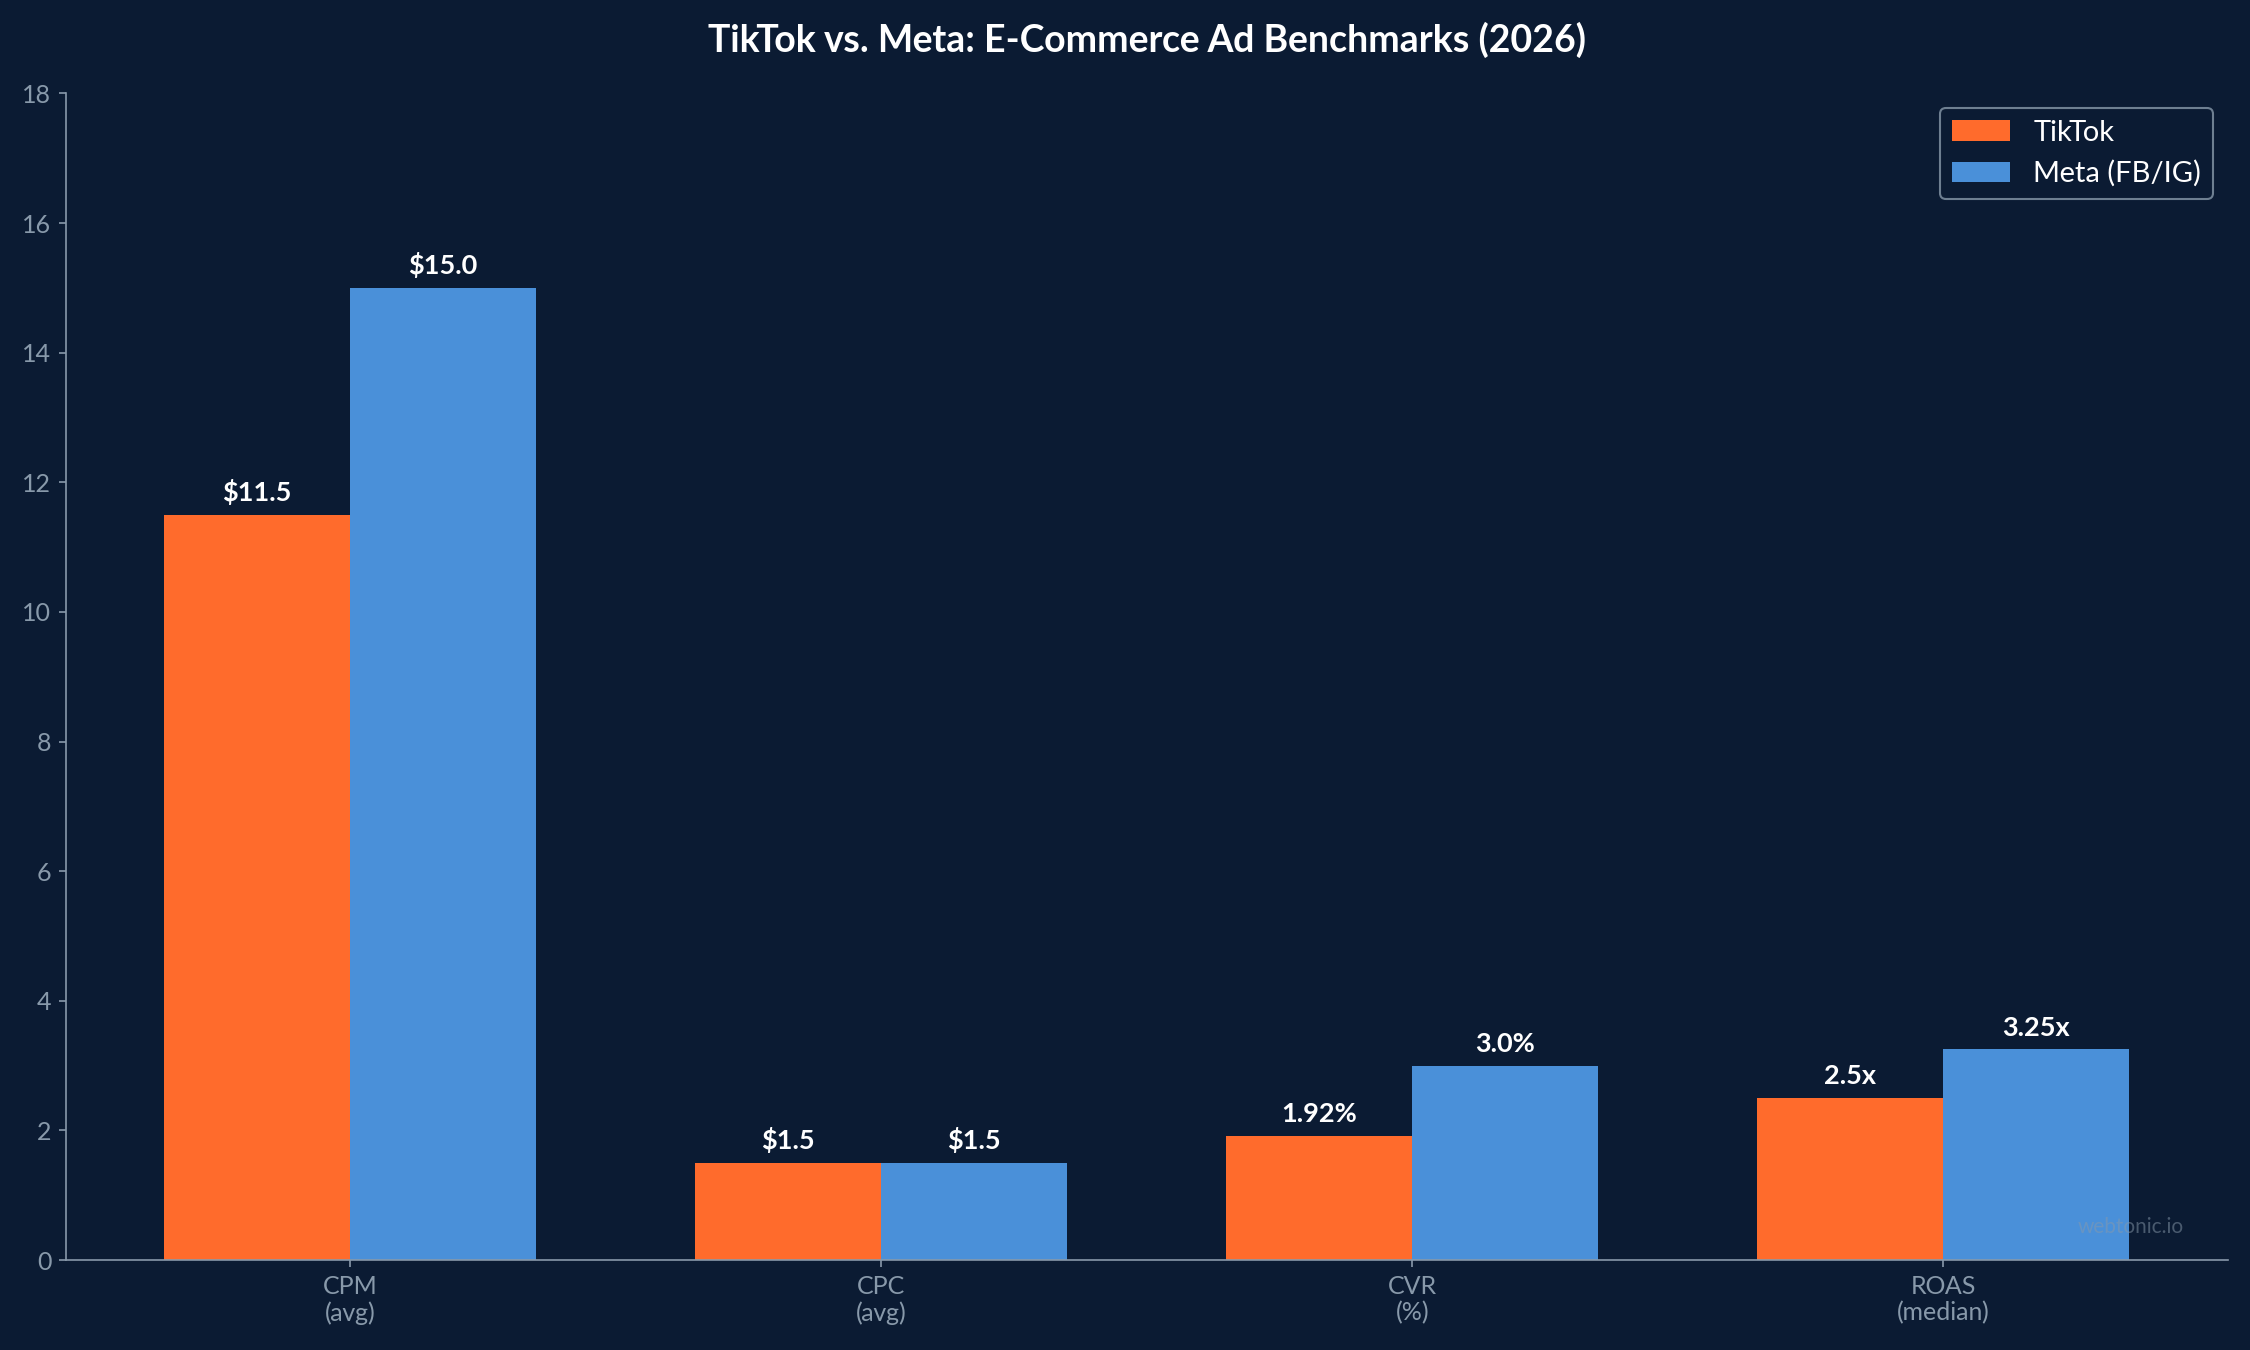
The cost advantage over Meta is most visible in raw CPMs: TikTok e-commerce CPMs of $9 to $14 in Q2 2026 are materially cheaper than Meta's $12-$18 range, per agency benchmarks from Pilothouse and Structured Social. However, TikTok's conversion rate is lower (1.9% vs. 2.5-3.5% on Meta), as noted by True Margin, because TikTok creates intent rather than capturing it, interrupting entertainment rather than targeting existing search behavior.
ROAS Performance and Optimization Windows
E-commerce ROAS on TikTok follows a distinct maturation curve. AIAdvantageAgency reports that brands should expect cold-start ROAS of 1.0-1.5x during the first 30 days, climbing to 2.5-4.0x by day 60 as the pixel accumulates conversion data and the algorithm optimizes delivery. Most e-commerce brands reach peak efficiency between days 60 and 90.
The TikTok Shop destination changes the equation dramatically: campaigns driving traffic to TikTok Shop listings convert at 3.7% versus 1.92% for external landing pages. This nearly doubles conversion rates by eliminating the friction of leaving the TikTok app, keeping shoppers in a native browsing environment where social proof (reviews, creator videos, live shopping) reinforces purchase intent.
Budget allocation matters significantly. According to Triple Whale's full-year 2025 data across 33,000+ brands and $18.4 billion in tracked spend, Meta commands 68.3% of e-commerce ad budgets, Google 25-33%, and TikTok approximately 2.3%. This disproportionately low TikTok allocation relative to the platform's audience scale suggests significant room for budget rebalancing as TikTok Shop's commerce infrastructure matures.
TikTok US Advertising Revenue and Growth Trajectory
TikTok's US advertising revenue has reached a scale that positions it as a genuine alternative to Meta and Google for e-commerce brands. According to Magna Global data reported by USA Business Times, TikTok's US advertising revenue crossed $12.4 billion in the twelve months ending March 2026, making it the third-largest digital ad platform in the US behind Google and Meta.
The platform's total global revenue structure breaks down as follows: advertising contributes approximately $25.5 billion (77% of revenue), TikTok Shop commissions add $5.0 billion (15%), and in-app purchases account for $2.6 billion (8%), per Axis Intelligence estimates. This diversification means TikTok's advertising business is increasingly intertwined with its commerce ambitions, with each reinforcing the other.
For e-commerce advertisers, this revenue growth signals both opportunity and caution. The opportunity lies in TikTok's continued investment in commerce infrastructure (better ad formats, improved measurement, Shopify integrations). The caution is that rising advertiser adoption will inevitably increase auction competition and drive CPMs higher over time, mirroring Meta's cost trajectory from 2018-2024. Brands that establish TikTok advertising programs now benefit from the current cost advantage before the window narrows.
Creative Format Performance for E-Commerce
Creative quality is the primary determinant of TikTok e-commerce ad performance, more than targeting, bidding, or budget level. Spark Ads deliver 2.4x higher engagement than standard in-feed ads, according to TikTokAdSuite data, because they leverage existing creator content that already has social proof (likes, comments, shares).
The bottom-quartile performance gap is overwhelmingly explained by creative quality and Spark Ads non-adoption, per AdLiftr's analysis. Brands that invest in creator-generated content rather than polished studio ads consistently outperform on TikTok, where authenticity and entertainment value drive engagement more than production value.
Optimal video length for e-commerce ads is 15-30 seconds, with hook-driven opening frames critical for retention. The first 2 seconds determine whether a viewer stops scrolling, making the hook the most valuable piece of real estate in TikTok creative. Brands that test 3-5 creative variations weekly maintain lower creative fatigue and more consistent delivery. For e-commerce specifically, product demonstration videos (unboxings, before/after reveals, side-by-side comparisons) consistently outperform brand awareness-style content, as they provide immediate product value within the entertainment format TikTok users expect.
TikTok Shop Performance by E-Commerce Vertical
TikTok Shop performance varies dramatically by product category, making vertical selection a critical strategic decision for e-commerce advertisers. Based on Eightx and Axis Intelligence data:
| Vertical | TikTok Shop GMV Share | Typical ROAS | Key Success Factor |
|---|---|---|---|
| Fashion / Apparel | ~24% | 2.0-3.5x | Creator try-on hauls, trend alignment |
| Beauty / Skincare | ~22% | 3.0-5.0x | Before/after demos, GRWM content |
| Food / Beverage | ~7% | 1.5-2.5x | Taste tests, recipe integration |
| Home / Lifestyle | ~12% | 2.0-3.0x | Cleaning hacks, room transformations |
| Electronics / Tech | ~8% | 1.5-2.5x | Unboxing, feature comparisons |
Beauty and skincare lead TikTok Shop economics with the highest ROAS range (3.0-5.0x), driven by the platform's visual format advantage for before/after demonstrations and the low price-point impulse purchase behavior that TikTok's algorithm excels at surfacing. Fashion follows closely with strong creator-driven sales through try-on hauls and trend-aligned content.
TikTok vs. Other Platforms for E-Commerce Advertising
| Platform | Avg. CPM | Avg. CPC | CVR (E-Commerce) | Key Advantage |
|---|---|---|---|---|
| TikTok | $9-$14 | $1.00-$2.00 | 1.9% (ext.) / 3.7% (Shop) | TikTok Shop, viral discovery, creator UGC |
| Meta (FB/IG) | $12-$18 | $1.20-$1.80 | 2.5-3.5% | Mature pixel, broadest targeting |
| Snapchat | $6-$10 | $0.62-$0.94 | Varies | Lowest CPM, AR try-on |
| Google Shopping | N/A | $0.50-$1.50 | 3.0-5.0% | High-intent search, product feeds |
TikTok's unique value proposition for e-commerce lies in its discovery-driven commerce model. Unlike Google (intent capture) or Meta (retargeting-heavy), TikTok excels at creating demand for products consumers did not know they wanted. This makes it particularly effective for impulse-driven categories like beauty, fashion, and novelty products, where emotional engagement drives purchase decisions.
Best Practices for E-Commerce TikTok Ad Campaigns
- Start with TikTok Shop if eligible because the 3.7% conversion rate versus 1.92% on external landing pages makes Shop the default destination for product-focused campaigns.
- Budget $50-$150/day during the learning phase and allow 60 days for the pixel to accumulate enough conversion data before evaluating ROAS (expect 2.5-4.0x by day 60).
- Invest in Spark Ads and creator partnerships since the 2.4x engagement lift over standard ads makes creator content the highest-ROI creative investment on the platform.
- Test 3-5 creative variations weekly because TikTok's algorithm rewards fresh content and creative fatigue sets in faster than on Meta due to the platform's content velocity.
- Optimize for the first 2 seconds as hook-driven opening frames determine scroll-stop rates and directly impact CPM efficiency and delivery volume.
- Track blended ROAS across platforms since TikTok's last-click attribution underreports its contribution to the purchase journey. Use MER (marketing efficiency ratio) for a more accurate picture.
- Leverage the Q4 2026 subsidy programs as TikTok's estimated $12B ad credit initiative and Guaranteed Sale fulfillment program create a limited-time cost advantage for early adopters.
Measurement and Attribution Considerations
TikTok's attribution presents unique challenges for e-commerce advertisers. The platform's default attribution window is a 7-day click and 1-day view model, which systematically underreports TikTok's contribution to the purchase journey. True Margin's analysis found that TikTok's last-click ROAS of 1.9x jumps to 2.5-3.0x when measured through multi-touch attribution or media mix modeling.
Triple Whale's data across 33,000+ brands confirms this gap: brands that rely solely on TikTok's in-platform reporting consistently undervalue the channel and underallocate budget relative to its actual contribution. The recommended approach is to track MER (marketing efficiency ratio) at the business level, blending all channel spend against total revenue to assess whether TikTok advertising contributes to overall growth, rather than evaluating it in isolation.
For TikTok Shop specifically, attribution is cleaner because the entire purchase journey (discovery, consideration, checkout) happens within the TikTok ecosystem, eliminating cross-platform tracking gaps. This is one reason TikTok Shop conversion rates (3.7%) dramatically outperform external landing page campaigns (1.92%) as both a genuine UX advantage and a measurement artifact.
Frequently Asked Questions
What is the average ROAS for e-commerce TikTok ads?
The baseline ROAS benchmark for e-commerce TikTok ads is 2.5x or higher, according to AGrowth.io. However, brands should expect lower returns during the initial 30-day learning phase (1.0-1.5x), with performance climbing to 2.5-4.0x by day 60 as the pixel accumulates sufficient conversion data. Top-performing DTC brands achieve 3.5-5.0x ROAS after the optimization window.
How much does TikTok advertising cost for e-commerce?
E-commerce TikTok ad costs in 2026 include CPMs of $9-$14, CPCs of $1.00-$2.00, and CPAs of $12-$35 per purchase. These rates are generally lower than Meta on a CPM basis but deliver lower conversion rates (1.9% vs. 2.5-3.5%), making the effective cost-per-acquisition comparable for many product categories.
Is TikTok Shop worth it for e-commerce brands?
Yes. TikTok Shop campaigns convert at 3.7% compared to 1.92% for external landing page campaigns, nearly doubling conversion rates. With US GMV hitting $32 billion in H1 2026 and aggressive seller subsidies planned for Q4, TikTok Shop is increasingly a must-have channel for DTC brands in beauty, fashion, and consumer goods.
What percentage of ad budget should go to TikTok?
Currently, TikTok captures approximately 2.3% of the median DTC ad budget, with Meta at 68.3% and Google at 25-33%. Agencies recommend starting with 5-10% of total social ad spend on TikTok and increasing based on ROAS performance after the 60-day optimization window. Brands seeing 2.5x+ ROAS can justify scaling to 15-20% allocation. The key consideration is ensuring sufficient pixel maturity before scaling: TikTok's algorithm requires approximately 50 conversion events per week per ad group to optimize delivery effectively, and brands that scale budget before reaching this threshold consistently see inflated CPAs and unstable ROAS.
How do Spark Ads perform for e-commerce?
Spark Ads, which amplify existing creator content as paid ads, deliver 2.4x higher engagement than standard in-feed ads. They perform particularly well for e-commerce because they combine social proof (existing likes, comments, shares) with paid distribution, creating a more authentic shopping experience that aligns with TikTok's entertainment-first content format. For e-commerce brands, the optimal Spark Ads strategy is to seed products with 5-10 micro-creators, identify the top-performing organic videos, and then amplify those winners with paid spend rather than creating ads from scratch.
Sources
axis-intelligence.com — TikTok Shop Statistics 2026
ecommerce-times.com — TikTok Shop US GMV $32B
adliftr.com — TikTok Ads Cost Benchmarks 2026
truemargin.ai — TikTok Ads ROAS Benchmarks
aiadvantageagency.com — TikTok Ads Cost for E-Commerce
influee.co — TikTok Ads Benchmarks 2026
d2c-times.com — TikTok Shop Ads vs. Meta Shops
superscale.ai — E-Commerce Ad Spend Benchmarks 2026
eightx.co — TikTok Shop Revenue Share by Vertical