Table of contents
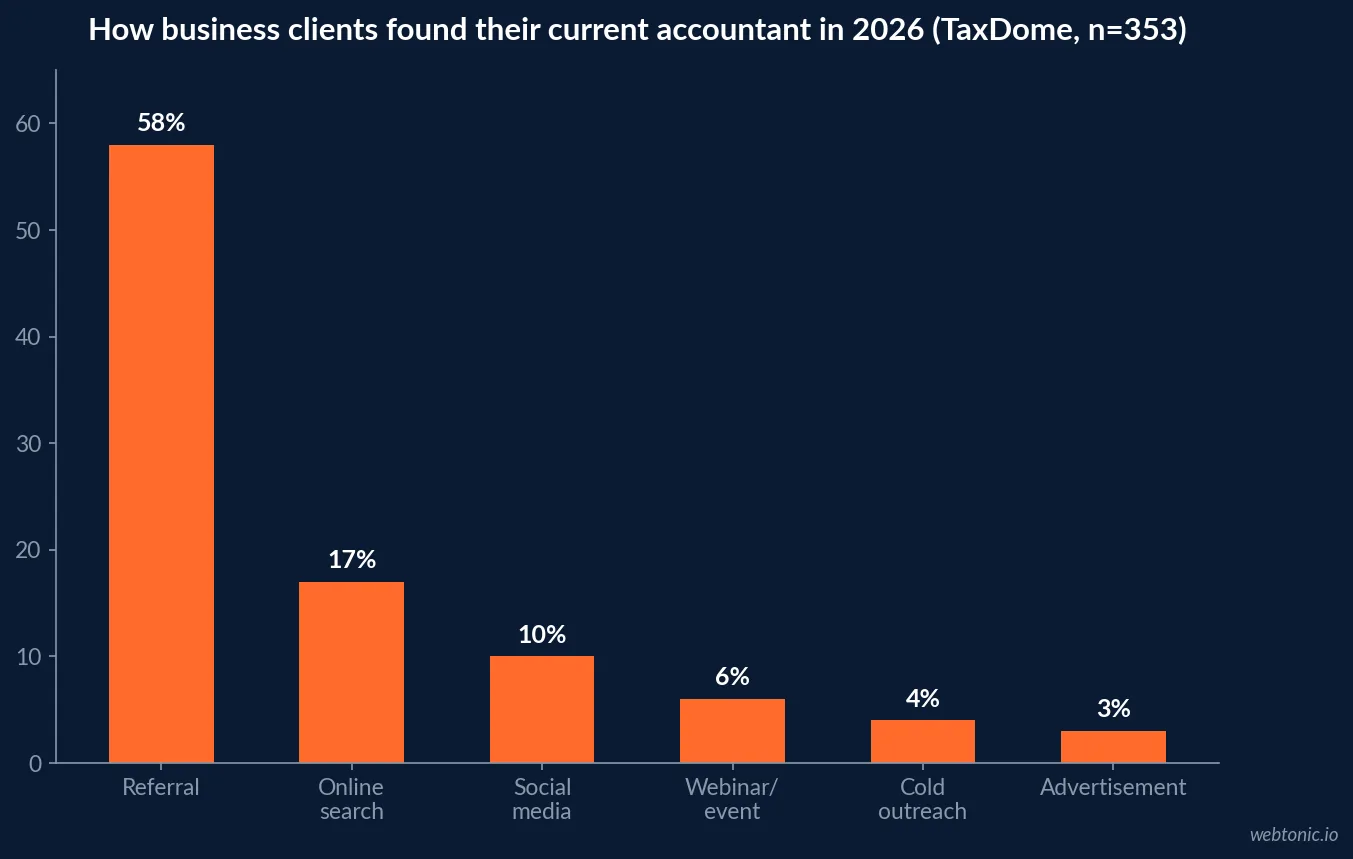
58% of business clients say a referral was the primary reason they found their current accountant, against 3% who credit an advertisement - a 353-business survey, not an assumption. That single number reframes what "demand generation" should even mean for a tax and accounting firm.
Key Takeaways
- 58% of clients found their accountant through referral, per TaxDome's 2025 survey of 353 US businesses.
- Online search is a distant second channel at 17%; social media sits at 10%.
- Advertising is the least-credited channel at 3% of primary discovery.
- 92% of business clients rank referrals as important when choosing an accountant.
- 85% say responsiveness is very or extremely influential in the selection decision.
- A separate Australian survey found 69% via word of mouth (Agile Market Intelligence, n=506).
- Fewer than 4 in 10 accountants explicitly ask most clients for referrals, the same survey found.
- Finance and accounting cost per lead fell to USD 74.44 in 2026 (LocaliQ), the first drop in five years.
- Search click-through rate for the category sits at 9.83%.
- Google Ads search CPA for accounting runs USD 81.93, display USD 41.40.
- 60%-plus of annual client acquisition happens January through April, tax season.
- Traffic rises roughly 45% during that same window.
- High Growth accounting firms spend 2.1% of revenue on marketing against 1.0% for the rest.
- High Growth firms grew revenue 38.5% against that spend.
- Net remaining per partner rose 11.9% to USD 252,663 (AICPA-affiliated MAP Survey, 2025).
- Roughly 95% of buyers in any category aren't ready to buy today, per LinkedIn's cross-industry 95-5 Rule.
Demand creation versus demand capture, for a trust purchase
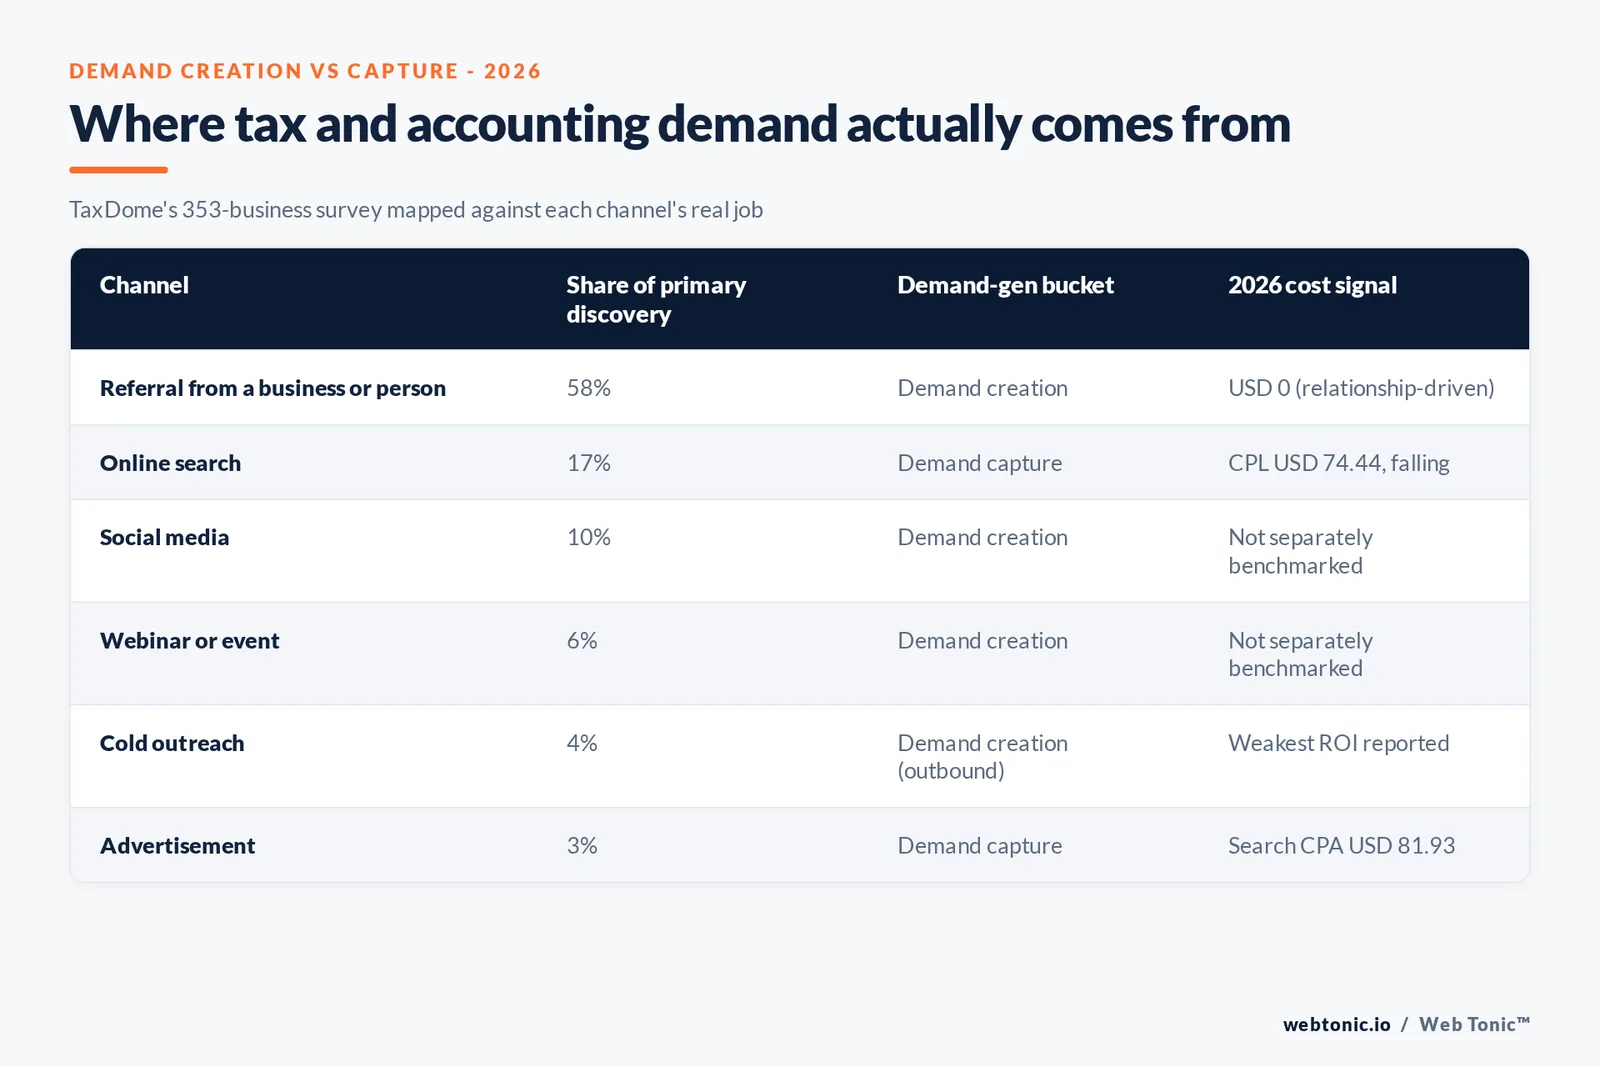
Demand generation splits into two jobs: creating awareness among people who aren't searching yet (demand creation) and capturing intent from people who already are (demand capture). For most B2B and home-service categories both halves matter roughly equally. Accounting skews hard toward the first half, because hiring an accountant is a trust purchase most buyers make through someone they already know. TaxDome's 2025 Niche Business Accounting Report, surveying 353 US business decision-makers directly rather than asking accountants to guess, found 58% named referral as the primary way they found their current firm, with online search at 17%, social media at 10%, webinars or events at 6%, cold outreach at 4% and advertising last at 3%.
That is a demand-creation-dominated funnel with a thin demand-capture tail - the opposite shape from a category like e-commerce, where paid search and social routinely originate a third or more of new customers.
| Discovery channel (TaxDome 2025, n=353) | Share of clients | Demand-gen bucket |
|---|---|---|
| Referral from a business or person | 58% | Demand creation (relationship-driven) |
| Online search (Google, Yelp, etc.) | 17% | Demand capture |
| Social media | 10% | Demand creation |
| Webinar or event | 6% | Demand creation |
| Cold outreach from the accountant | 4% | Demand creation (outbound) |
| Responded to an advertisement | 3% | Demand capture |
A second survey, a different country, the same shape
Cross-checking a single survey against another reduces the risk of a one-off sample skewing the picture. Agile Market Intelligence's 2025 SMB Navigator Report, commissioned by Intuit QuickBooks and surveying 506 Australian businesses plus 404 practising accountants, found 69% of SMBs found their accountant through word of mouth - higher than TaxDome's 58%, but the same conclusion. The same survey found fewer than 4 in 10 accountants explicitly ask a majority of their clients for referrals, which is the real gap: firms already know where clients come from and mostly do not systematize it.
Name the gap plainly rather than averaging it away: 58% is a US survey of business clients on primary discovery method; 69% is an Australian survey of SMBs on word of mouth specifically, a slightly broader definition. Both point the same direction.
| Survey | Geography / sample | Referral figure | What it measures |
|---|---|---|---|
| TaxDome Niche Business Accounting Report 2025 | US, n=353 business decision-makers | 58% | Primary discovery method, exclusive categories |
| Agile Market Intelligence SMB Navigator 2025 | Australia, n=506 SMBs + 404 accountants | 69% | Word of mouth broadly, may overlap other channels |
Where the demand-capture budget actually goes: paid search
The thin slice of demand that is capturable through paid channels still needs to be priced correctly. WordStream's 2026 Google Ads Benchmarks (LocaliQ, drawn from over 13,000 US search campaigns run April 2025-March 2026) put the Finance and Insurance category's Google Ads cost per click at USD 3.39 and conversion rate at just 2.64% - the third-lowest CVR of the 23 tracked industries - with cost per lead falling to USD 74.44 on a 9.83% search click-through rate, the category's first CPL decline in five years.
Falling CPL is a genuine opening for firms that have avoided paid search, but the 3% primary-discovery share above is the reminder that this channel augments referral flow, it does not replace it.
| Paid channel benchmark (2026) | Figure | Source |
|---|---|---|
| Google Ads CPC, finance & insurance | USD 3.39 | WordStream / LocaliQ 2026 benchmarks |
| Google Ads CVR, finance & insurance | 2.64% | WordStream / LocaliQ 2026 benchmarks |
| Finance & accounting CPL (2026, first fall in 5 yrs) | USD 74.44 | WordStream / LocaliQ 2026 benchmarks |
| Search click-through rate, finance & accounting | 9.83% | WordStream / LocaliQ 2026 benchmarks |
The compressed buying window: tax season
Unlike most B2B categories, tax and accounting demand is seasonal in a way that concentrates the capturable share of the funnel. Industry benchmarking places 60%-plus of annual client acquisition activity between January and April, with overall site traffic rising roughly 45% over the same window. Traffic mix through the year runs roughly 48-54% organic, 26-28% direct and 8-18% paid, with bounce rate around 51.3% - a firm that only stands up paid search or content in March is arriving after the steepest part of the search-volume curve, not during it.
Referral relationships do not carry the same seasonality problem, because they are built year-round through client service quality rather than triggered by a filing deadline - one more reason the channel dominates a 12-month view even though search volume itself spikes for four of those months.
| Seasonal factor (2026 benchmarking) | Figure | Planning implication |
|---|---|---|
| Share of annual acquisition, Jan-Apr | 60%+ | Front-load paid and content spend before January |
| Traffic increase during tax season | +45% | Site and server capacity should scale ahead of it |
| Organic share of traffic, year-round | 48-54% | SEO compounds outside the seasonal spike too |
| Paid share of traffic, year-round | 8-18% | The smallest of the three channels by volume |
Firm economics behind the marketing decision
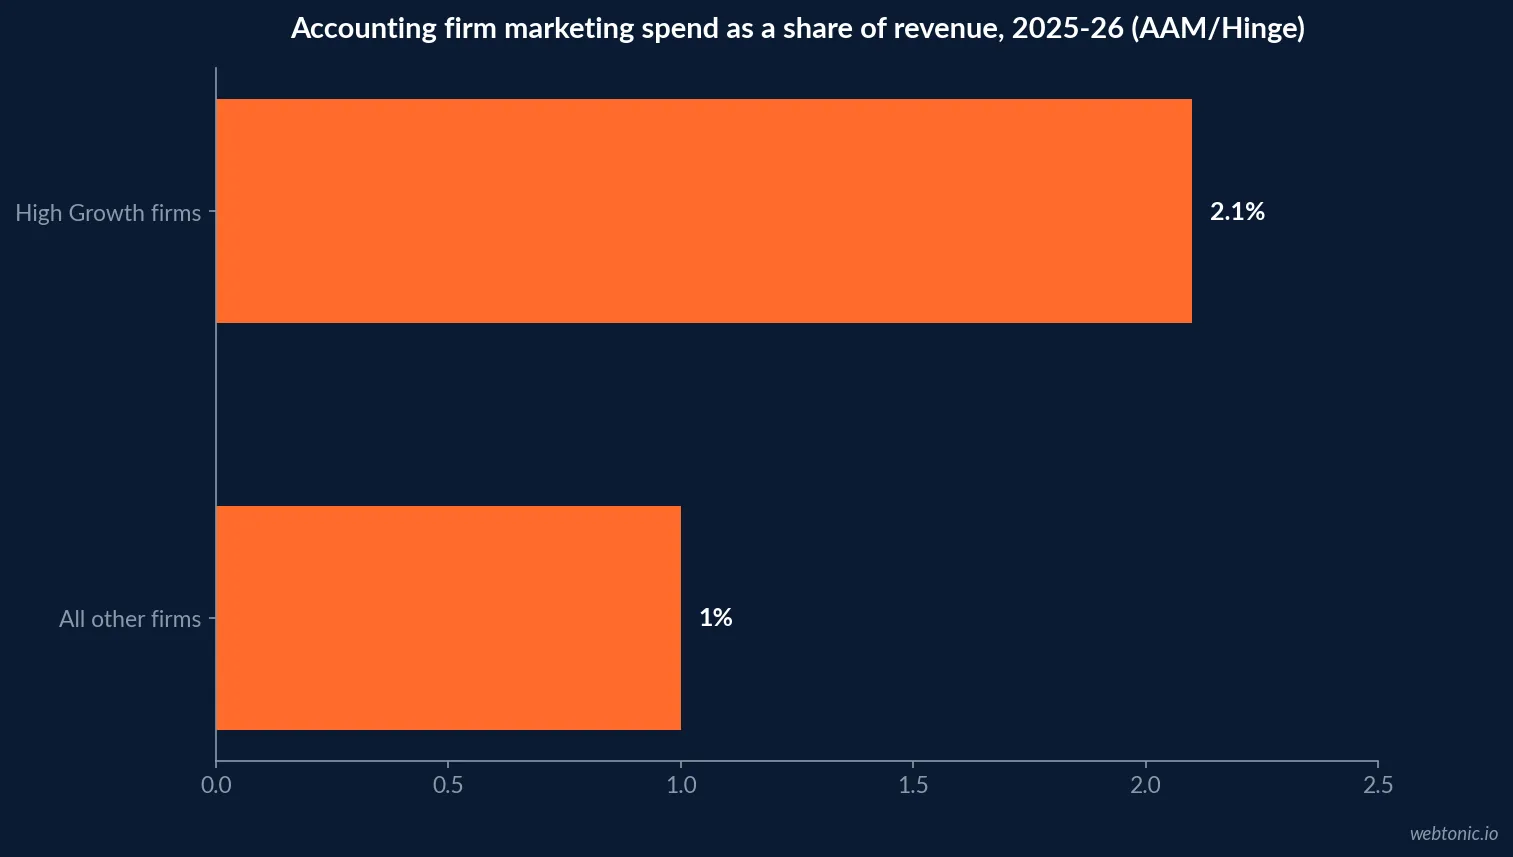
The budget case for treating referral as infrastructure rather than luck shows up in the profitability data. The 2025 National Management of an Accounting Practice Survey found net remaining per partner climbed 11.9% to USD 252,663 in fiscal year 2024, up from USD 225,725, with net client fee cash flow (NCF) growing 6.7% median year over year. AAM/Hinge's 2025-26 benchmark study found High Growth firms spend 2.1% of revenue on marketing against 1.0% for the rest, and grew revenue 38.5% against that spend - a correlation, not a guarantee, but a large one.
Firms with healthy margins can afford to invest in the parts of demand generation that do not show a same-week return: referral systematization, client experience, and content that ranks for the 17% who do search.
| Firm economics figure (2025-26) | Value | Source |
|---|---|---|
| Net remaining per partner, FY2024 | USD 252,663 (+11.9% YoY) | National MAP Survey 2025 |
| Median NCF growth, prior year | 6.7% | National MAP Survey 2025 |
| High Growth firm marketing spend | 2.1% of revenue | AAM/Hinge 2025-26 study |
| All other firms' marketing spend | 1.0% of revenue | AAM/Hinge 2025-26 study |
| High Growth firm revenue growth | 38.5% | AAM/Hinge 2025-26 study |
What a cross-industry B2B lens adds, and where it does not apply
It is tempting to import general B2B demand-gen research wholesale, but that data was not measured on accounting buyers and should be labeled as such. LinkedIn's B2B Institute 95-5 Rule, built with the Ehrenberg-Bass Institute, holds that roughly 95% of a category's buyers are "out-market" at any given time and will only become reachable through bottom-funnel channels once a trigger event puts them in market. Forrester's State of Business Buying 2026 separately reports that 68% of B2B buyers already have a front-runner vendor in mind at the start of a purchase process, and that preferred vendor wins 55% of the time overall.
Both frameworks support the same practical conclusion an accounting-specific survey already gave more directly: by the time a prospect is actively comparing firms, the decision is substantially pre-made by reputation and referral, and paid channels are competing for what is left over.
Building a demand-gen plan that matches the real channel mix
Size the budget to the evidence: put the majority of structured effort into a referral system (asking systematically, not hoping), keep enough paid search live to capture the 17% who search and the falling USD 74.44 CPL opportunity, and front-load both before January rather than during it. If the firm wants referral tracking and seasonal capacity planning built and instrumented, our growth marketing team and data and analytics practice build that pairing together; see our related cost per lead by industry breakdown for how accounting's paid figures compare across other professional services.
Frequently Asked Questions
Is referral really the main driver of new accounting clients in 2026?
Yes, by a wide margin, according to one of the few surveys that asked clients rather than firms. TaxDome's 2025 Niche Business Accounting Report, surveying 353 US business decision-makers directly, found 58% named referral from a business or person as the primary way they found their current accountant, with online search a distant second at 17% and advertising last at 3%. A separate Australian SMB survey (Agile Market Intelligence, commissioned by Intuit QuickBooks, n=506 businesses) found an even higher 69% via word of mouth - two different countries, two different survey houses, the same shape.
Does that mean paid advertising is a waste of budget for accounting firms?
Not necessarily, but it changes the job paid channels are hired for. LocaliQ's 2026 Search Advertising Benchmarks report found finance and accounting cost per lead fell to USD 74.44 with a 9.83% search click-through rate - the first CPL decline in five years for the category. Paid search is a demand-capture tool for the 5% of prospects already searching, not a substitute for the trust-building that produces referrals in the first place.
Why is tax season such a dominant factor in the demand curve?
Because the buying window compresses into four months. Industry benchmarking places 60%-plus of annual client acquisition activity between January and April, with site traffic rising roughly 45% over that window. A firm that only turns on demand generation in March has already missed the search volume spike; referral relationships, unlike ads, keep working in the other eight months.
What share of marketing budget should go toward referral versus paid channels?
There is no single published ratio, but the firm-economics data points toward weighting effort, not necessarily dollars, toward referral systems. The Association for Accounting Marketing and Hinge's 2025-26 study found High Growth firms spend 2.1% of revenue on marketing against 1.0% for the rest, and grew revenue 38.5% - yet a separate Agile Market Intelligence survey found fewer than 4 in 10 accountants explicitly ask a majority of clients for referrals, meaning most firms are underinvesting in the channel that already produces the most clients before spending a dollar on paid media.
Do B2B buyer-journey benchmarks from outside accounting still apply here?
Partially, and it should be labeled as a cross-industry benchmark rather than an accounting-specific one. LinkedIn's B2B Institute 95-5 Rule, built on Ehrenberg-Bass Institute research, holds that roughly 95% of any category's buyers aren't ready to buy today - a framing that supports why referral and brand-style trust-building outperform bottom-funnel ads for a considered, relationship-driven purchase like an accountant, but it was not measured on accounting buyers specifically.
Sources
TaxDome - 2025 Niche Business Accounting Report (n=353)
Agile Market Intelligence - 2025 SMB Navigator Report
WordStream - Google Ads Benchmarks 2026
AICPA-affiliated - 2025 National MAP Survey Executive Summary
Hinge Marketing / AAM - 2025-26 High Growth Study
LinkedIn B2B Institute - The 95-5 Rule
Forrester - The State of Business Buying, 2026