Table of contents

A surrogacy agency is a two-sided marketplace, so a marketing-only dashboard reports the wrong business. The binding constraint is matched surrogates - and no volume of intended-parent leads fixes a matching backlog. Here is the 2026 data, and the panel structure that reflects it.
Key Takeaways
- Enterprise dashboard adoption reached about 67%, up from 52% in 2020.
- Roughly 78% to 79% of executives use dashboards or reports to guide strategy, up from 75% in 2018.
- Mobile report consumption rose from 40% to 68%; interactive reporting from 42% to 65%.
- Only about 32% of marketers express high confidence in their data quality.
- Only 14% of agency marketers and 12% of in-house marketers have extensively automated data tasks.
- 73% of CMOs increased analytics budgets in the last 12 months.
- Healthcare marketers tie 10% to 25% of spend to patient outcomes against a 26% to 50% target.
- Only 9% of healthcare marketing teams have integrated call-centre data.
- 80% to 90% of healthcare appointments are booked by phone; about 39.2% of conversions happen by phone.
- 15% to 25% of healthcare calls convert to a booked appointment.
- True patient acquisition cost is often 3 to 4 times the reported figure.
- Intended-parent acquisition costs $800 to $3,000; journey revenue is $120,000 to $200,000-plus.
- Cost per qualified surrogate is $1,500 to $8,000; per matched surrogate $3,000 to $15,000.
- Only 2% to 3% of surrogate inquiries pass full screening.
- Eligibility filters remove more than 95% of candidates before screening begins.
- A 30 to 50 times pipeline ratio is needed to hit a matching target.
- Intended-parent decisions take 3 to 12 months; commitment runs 18 to 24 months.
- Multi-touch attribution adoption is 47%; only 21% of marketers trust their attribution.
- 91% of CRM records are incomplete, capping any dashboard's accuracy.
- 35.6% of US fertility practices sit below 4.0 stars, against a weighted average of 4.20 across 671 practices and 63,513 reviews.
- Fertility paid search averages $9.84 CPC, 5.28% CTR, 6.8% CVR and $112 CPA.
- The global surrogacy market reached $28.91 billion in 2026 at a 22.19% CAGR.
Dashboard adoption is high; dashboard trust is not
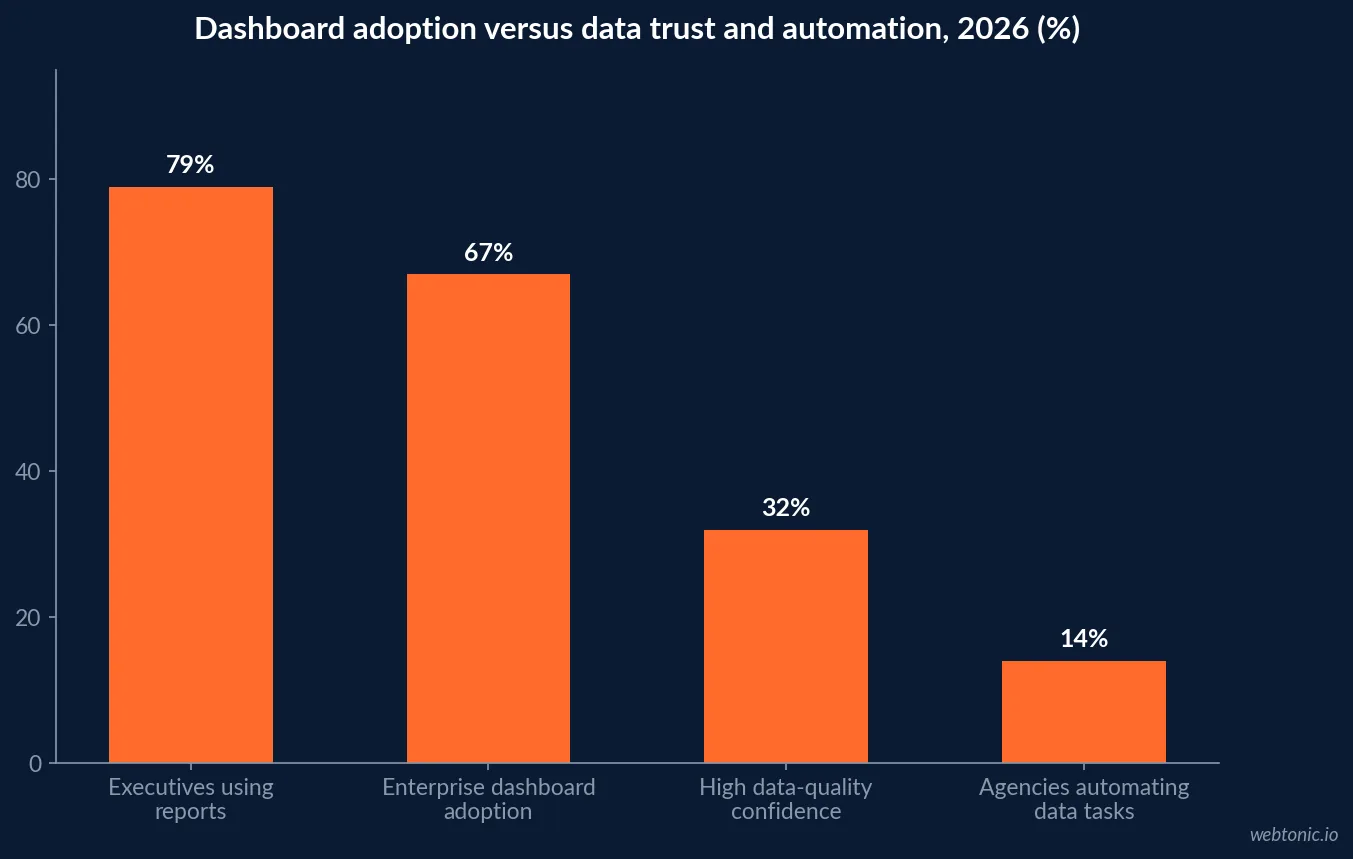
The tooling argument is over - executives read dashboards. 2026 dashboard research puts enterprise adoption at about 67% against 52% in 2020, and reporting industry data has 79% of executives using reports to guide strategic decisions, up from 75% in 2018. The problem has moved downstream, into whether the numbers can be believed: only about 32% of marketers report high confidence in their data quality even as 73% of CMOs raised analytics budgets, per 2026 marketing analytics research.
| Metric | 2026 figure | Prior benchmark | What it means for an agency |
|---|---|---|---|
| Enterprise dashboard adoption | About 67% | 52% (2020) | Dashboards are table stakes |
| Executives guiding strategy with reports | About 79% | 75% (2018) | The dashboard is the argument |
| Mobile report consumption | 68% | 40% | Design for a phone screen |
| Interactive reporting use | 65% | 42% | Static PDFs are read less |
| Marketers with high data-quality confidence | About 32% | - | Trust, not tooling, is the gap |
| Agency marketers automating data tasks extensively | 14% | - | Most reporting is still manual |
| In-house marketers automating data tasks | 12% | - | Automation is the cheap win |
| CMOs increasing analytics budgets | 73% | - | Budget exists for this work |
Manual reporting is where agency dashboards die. With only 14% of agency marketers having extensively automated data tasks per 2026 marketing intelligence research, most surrogacy reports are rebuilt by hand every month, which means they are late, inconsistent and quietly abandoned by the third quarter.
The three-panel structure a surrogacy agency needs
Most marketing dashboards report one funnel. A surrogacy agency has two, plus a matching engine between them. Panel three is the one that never gets built, and it is the one that governs revenue.
| Panel | Primary question | Core metrics | Target or benchmark |
|---|---|---|---|
| Intended parents | Are we creating qualified demand? | Inquiries, consultations, signed agreements, cost per stage | $800-$3,000 per signed client |
| Surrogates | Are we creating usable supply? | Applications, pre-screen pass, clearance, matches | $1,500-$8,000 qualified, $3,000-$15,000 matched |
| Matching capacity | Can we absorb what marketing produced? | Unmatched cleared surrogates, waiting signed parents, days to match | Balance, not growth |
| Reputation strip | Are we passing the first screen? | Google rating, review velocity, response rate | Above 4.20 average, never below 4.0 |
| Call layer | Where do inquiries actually arrive? | Calls by source, answer rate, call-to-consult rate | 15%-25% of calls booked |
The capacity panel is what stops an agency from buying leads it cannot serve. With only 2% to 3% of surrogate inquiries passing full screening and eligibility filters removing more than 95% of candidates beforehand - per surrogate recruitment benchmarks - supply, not demand, sets the ceiling.
Metrics that belong on the weekly board, and ones that do not
Cadence discipline is what makes a dashboard used instead of admired. A metric that only moves quarterly should not be refreshed weekly.
| Metric | Cadence | Owner | Why |
|---|---|---|---|
| Inquiries by funnel | Weekly | Marketing | Directly responsive to spend and creative |
| First response time | Weekly | Intake | The single most fixable conversion lever |
| Pre-screen pass rate | Weekly | Intake and screening | Earliest honest quality signal |
| Calls by source and answer rate | Weekly | Intake | Phone carries most healthcare bookings |
| Cost per qualified lead by funnel | Monthly | Marketing | Needs a month of volume to be stable |
| Consultation and clearance rates | Monthly | Operations | Reflects process, not media |
| Cost per signed journey | Quarterly | Leadership | 3-12 month decision cycle |
| Cost per match | Quarterly | Leadership | Terminal supply-side metric |
| Cohort revenue by first touch | Annually | Ownership | 18-24 month journey lag |
The reconciliation habit is what closes the measurement gap. Healthcare lead conversion benchmarks and Freshpaint's 2026 report together explain why: only 9% of healthcare marketing teams have integrated call-centre data, so nine in ten dashboards silently omit the channel where most bookings happen.
The phone panel most agency dashboards omit
If your dashboard has no call section, it is not measuring the business. In healthcare roughly 80% to 90% of appointments are booked by phone and about 39.2% of conversions occur there, with true acquisition cost frequently landing at 3 to 4 times the reported number once offline stages are counted, per 2026 healthcare acquisition analysis.
| Call metric | Benchmark | Dashboard treatment |
|---|---|---|
| Appointments booked by phone | 80%-90% | Headline tile, not a footnote |
| Conversions occurring by phone | About 39.2% | Split every channel row into web and call |
| Calls converting to a booked appointment | 15%-25% | Weekly trend by source |
| Caller speed advantage | About 30% faster to convert | Justifies response-time targets |
| Teams with call data integrated | 9% | The gap you are closing |
| Reported versus true acquisition cost | True is 3-4x reported | Quarterly true-up line |
| Spend tied to outcomes today | 10%-25% versus 26%-50% target | Track as a maturity score |

Data quality decides whether anyone believes the board
Only about 32% of marketers have high confidence in their data quality, and 91% of CRM records are incomplete. A dashboard built on that foundation is a very fast way to lose an argument in a leadership meeting.
| Data quality issue | Consequence on the dashboard | Cheapest fix |
|---|---|---|
| Empty lead-source field | Channel rows understate everything | Make it required at intake |
| No self-reported source question | The 38% dark funnel is invisible | One required form field |
| Unenforced CRM stages | Stage conversion rates are fiction | Lock stage progression |
| Screening data in a separate sheet | No supply-side panel possible | Join weekly on a shared ID |
| Blended cost per lead | Both funnels are misread | Split every metric by audience |
| No call tracking on some pages | Best pages look like the worst | Dynamic number insertion everywhere |
| Manual monthly rebuild | Reports arrive late and inconsistently | Automate the pipeline once |
The measurement thinking behind those fixes is unpacked in our surrogacy branding statistics, and the reputation tile belongs on the board too: 35.6% of US fertility practices sit below 4.0 stars against a weighted average of 4.20 across 671 practices, per fertility rating research.
A 30-day build plan
Sequenced so the hardest joins happen after the easy wins prove the dashboard will be used.
| Days | Deliverable | Data source | Success test |
|---|---|---|---|
| 1-5 | Split every existing metric by funnel | Ad platforms and CRM | No blended cost per lead anywhere |
| 6-10 | Call tracking on all landing pages | Dynamic number insertion | Every inquiry has a source |
| 11-15 | Required self-reported source at inquiry | Web form and intake script | Field populated on 95%+ of records |
| 16-22 | Screening data joined to the CRM | Screening tracker | Pre-screen and clearance rates visible |
| 23-27 | Capacity panel built | CRM plus matching records | Unmatched counts and days to match live |
| 28-30 | Cadence agreed and automated | Reporting layer | Weekly, monthly and quarterly views ship themselves |
Against fertility paid benchmarks of $9.84 CPC, 5.28% CTR, 6.8% conversion and $112 CPA - per fertility clinic benchmarks - and a market reaching $28.91 billion in 2026 at a 22.19% CAGR per 2026 surrogacy statistics, a month of reporting work is cheap. Our data intelligence team builds exactly this, and the demand side it measures is quantified in our surrogacy Google Ads statistics.
Frequently Asked Questions
What should a surrogacy agency marketing dashboard actually show?
Three panels, not one. Panel one is the intended-parent funnel: inquiries, consultations held, signed agreements, cost per stage against an $800 to $3,000 acquisition target. Panel two is the surrogate funnel: applications, pre-screen pass rate, full clearance, matches, against $1,500 to $8,000 per qualified candidate and $3,000 to $15,000 per match. Panel three is capacity - unmatched cleared surrogates, unmatched signed parents, and average days to match - because the business is constrained by matching throughput, not by lead volume. A dashboard showing only marketing metrics will celebrate a lead surge that operations cannot absorb.
How widely are marketing dashboards actually used in 2026?
Broadly, but shallowly. Enterprise dashboard adoption reached about 67% (up from 52% in 2020) and roughly 78% to 79% of executives report using dashboards or reports to guide strategic decisions, up from 75% in 2018. Mobile consumption of reports has climbed from 40% to 68% and interactive reporting from 42% to 65%. The gap shows up in trust and automation: only about 32% of marketers express high confidence in their data quality, and just 14% of agency marketers and 12% of in-house marketers say they have extensively automated data tasks.
Why do surrogacy dashboards need capacity metrics as well as marketing metrics?
Because a surrogacy agency cannot convert demand it has no supply for. Only 2% to 3% of surrogate inquiries pass full medical, psychological and legal screening, and eligibility filters remove more than 95% of candidates before screening even begins, so a 30 to 50 times pipeline ratio is required. Meanwhile intended parents wait through 3 to 12 month decisions and 18 to 24 month journeys. If the dashboard shows lead growth while cleared surrogates sit unmatched or signed parents sit waiting, the number that needs attention is the match rate, not the ad budget.
What reporting cadence works for an 18-month sales cycle?
Weekly for inputs, monthly for efficiency, quarterly for revenue truth, annually for cohort economics. Weekly should carry only things you can change this week: inquiry volume by funnel, response time, pre-screen pass rate. Monthly carries cost per qualified lead by funnel and consultation and clearance rates. Quarterly is where cost per signed journey and cost per match are trued up, because healthcare marketers currently tie only 10% to 25% of spend to outcomes against a 26% to 50% target and that reconciliation is the only way to close the gap.
What are the most common surrogacy dashboard mistakes?
Blending the two funnels into one cost-per-lead number; reporting phone inquiries as an afterthought when 80% to 90% of healthcare bookings happen by phone and only 9% of healthcare teams have integrated call-centre data; showing traffic and impressions instead of stage conversion; omitting review rating when 35.6% of fertility practices sit below the 4.0 stars patients screen on; and refreshing weekly a metric that only moves quarterly, which trains everyone to ignore the dashboard.
Sources
Gitnux - Dashboard Statistics 2026
Zipdo - Business Analysis and Reporting Statistics
Digital Applied - Marketing Analytics Statistics 2026
Funnel - 2026 Marketing Intelligence Report
Invoca - Healthcare Lead Conversion Benchmarks 2026
Freshpaint - Healthcare Attribution Blind Spots
Praxxii - Healthcare Patient Acquisition 2026
Tandem - Surrogate Recruitment Marketing
Inside Reproductive Health - Fertility Center Google Ratings
Benchmarketing - Fertility Clinic Benchmarks
ACRC Global - Surrogacy Statistics 2026