Table of contents
A solar Shopping budget only covers hardware: Google's Unsupported Shopping content policy excludes installation and any service bundled with goods, and Google publishes no minimum spend. The budget is therefore built from Google's own caps and multipliers, not from an industry rate card.
Key Takeaways
- Google publishes no minimum spend for Shopping campaigns.
- Free product listings cost 0 and are on by default for new Merchant Center accounts.
- A campaign can spend up to 2x its average daily budget on one day.
- Monthly charges are capped at 30.4x the average daily budget.
- Google advises a Performance Max daily budget of at least 3x CPA.
- Local Services Ads guidance: budget for at least 10 leads per week.
- Residential solar installed 1,179 MWdc in Q1 2026, up 6% (SEIA/Wood Mackenzie).
- Median quoted residential price: USD 2.49/W (EnergySage, H2 2025).
- Quote spread widened 24% to USD 0.72/W.
- Google Shopping CPC fell 1% year over year in Q4 2025 (Tinuiti clients).
- Performance Max generated 61% of Shopping sales for brands running both types.
What in solar is eligible for Shopping
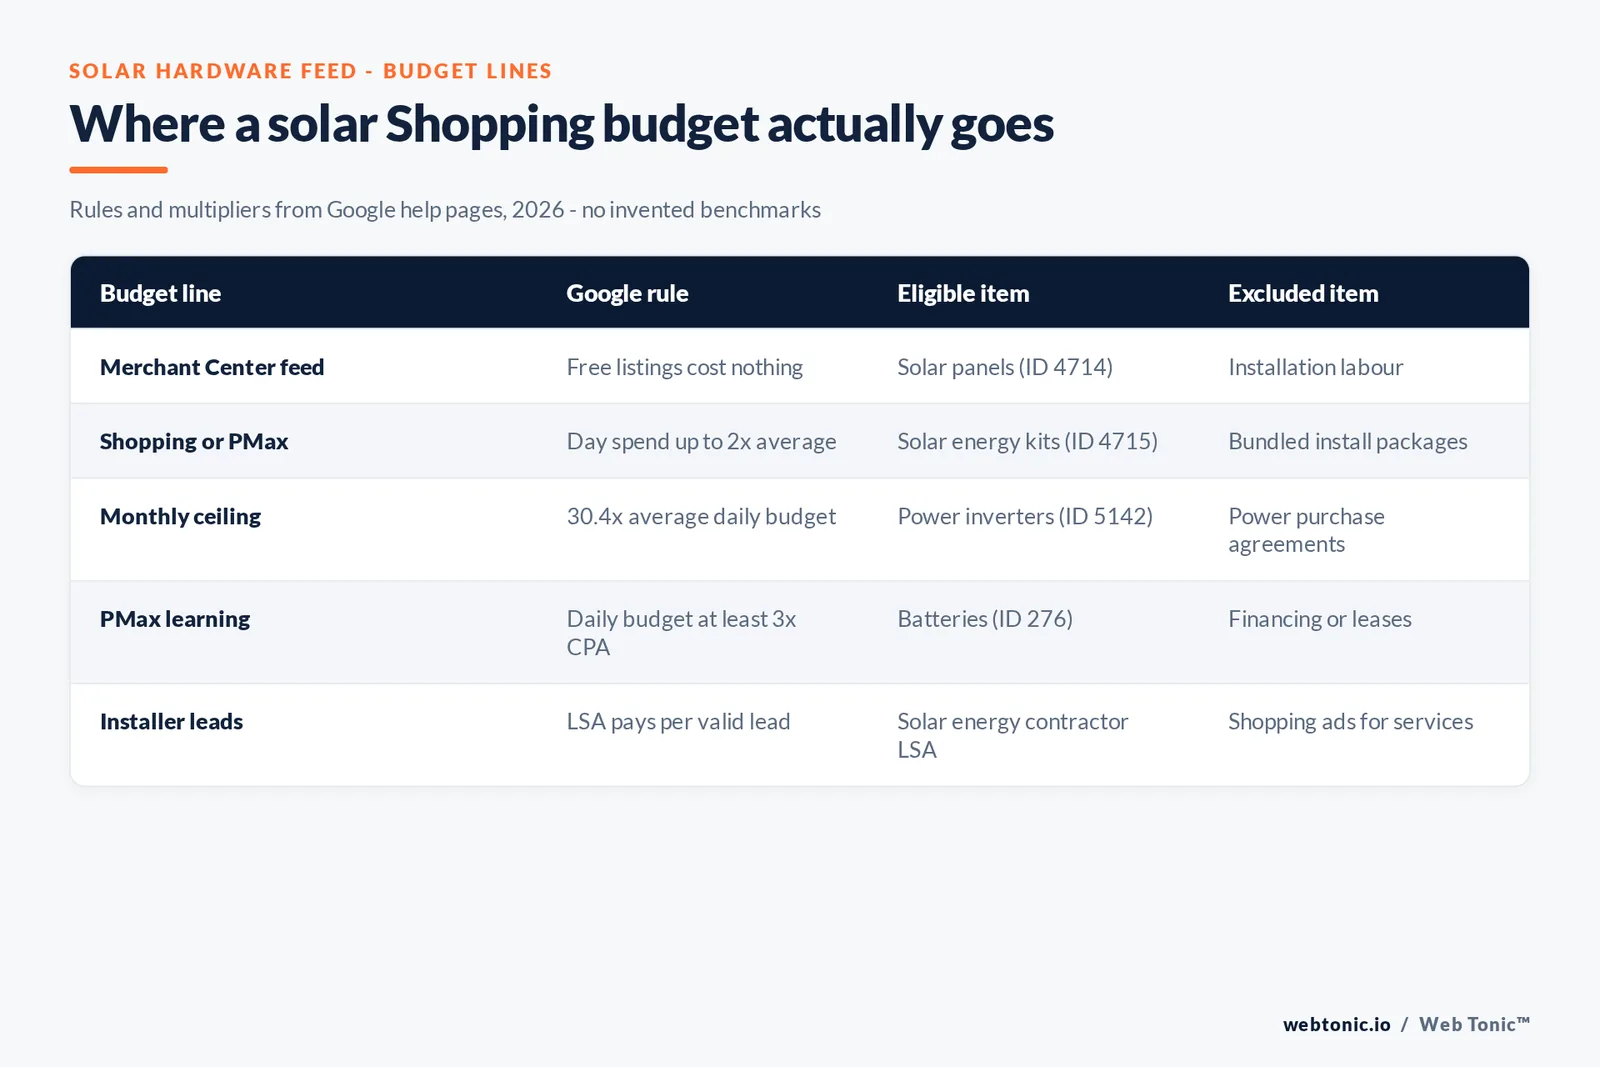
Google's policy disallows "labor, time, effort, expertise, or actions, which do not result in ownership of a tangible product" and adds that "this includes any services sold bundled with physical goods". A solar installation contract, a lease or a power purchase agreement is therefore outside Shopping. Financing sits in the policy's separate financial-products exclusion. What remains is equipment sold as goods, and Google's product taxonomy gives it exact homes.
| Solar item | Google product category | Shopping status | Budget implication |
|---|---|---|---|
| Solar panels | Hardware > Power and Electrical Supplies > Solar Panels (4714) | Eligible | Core feed line |
| Plug-and-play solar kits | Solar Energy Kits (4715) | Eligible | Bundles of goods, no labour |
| String and micro inverters | Power Inverters (5142) | Eligible | High-price, low-volume SKUs |
| Home and portable batteries | Batteries (276) or parent power categories | Eligible | Storage retrofit demand |
| Panel plus installation package | - | Not eligible | Services bundled with goods |
| Solar lease or PPA | - | Not eligible | Service / financial product |
The market the feed is selling into
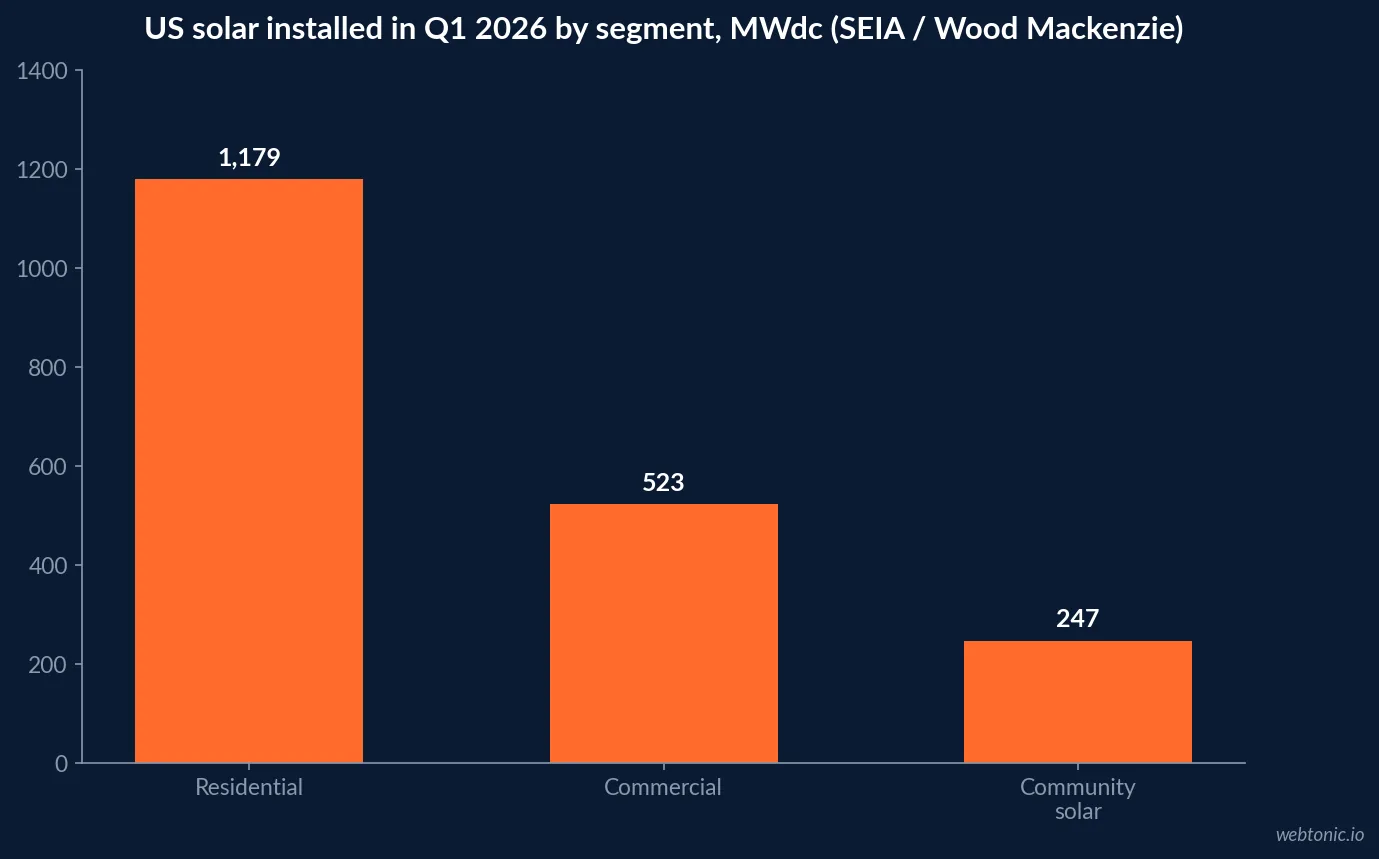
The SEIA/Wood Mackenzie Solar Market Insight Q2 2026 reports 7.8 GWdc installed in Q1 2026, down 27% on Q1 2025. The residential segment moved the other way: 1,179 MWdc, up 6% year over year, buoyed by installations initiated before the Section 25D credit expired. Commercial installed 523 MWdc (down 4%) and community solar 247 MWdc (down 4%). For a hardware seller, those residential volumes set the ceiling on how much Shopping demand exists; a larger budget does not create installs that the market is not making.
The medium-term picture is flat rather than growing. SEIA says its 2026 to 2031 outlook changed by only 1.4%, mostly from the utility sector, that the US solar fleet should double over the next five years while annual additions stagnate, and that more than 200 GWdc of safe-harbored capacity underpins near-term installations. A hardware seller planning a Shopping budget for 2026 and 2027 should therefore expect to win share inside a steady market, which puts the weight on feed quality, price competitiveness and product data completeness rather than on ever-larger bids.
| Segment, Q1 2026 | Installed | Year over year | Quarter over quarter |
|---|---|---|---|
| Residential | 1,179 MWdc | +6% | -15% |
| Commercial | 523 MWdc | -4% | -25% |
| Community solar | 247 MWdc | -4% | -67% |
| Utility-scale | 5.9 GWdc | -34% | -45% |
| All segments | 7.8 GWdc | -27% | -42% |
Price signals for hardware listings
EnergySage's 22nd Home Electrification Marketplace Report found median quoted residential solar prices rose just 0.4% to USD 2.49 per watt in H2 2025, touching USD 2.47/W in Q3 before USD 2.50/W in Q4. The spread between the highest and lowest average quotes widened 24%, from USD 0.58/W to USD 0.72/W. Those are installed-system prices, not equipment prices, so they cannot be pasted into a feed - but they show why the [price] attribute on a panel or kit is compared against a buyer's whole-system expectation.
How Google's own rules set the budget
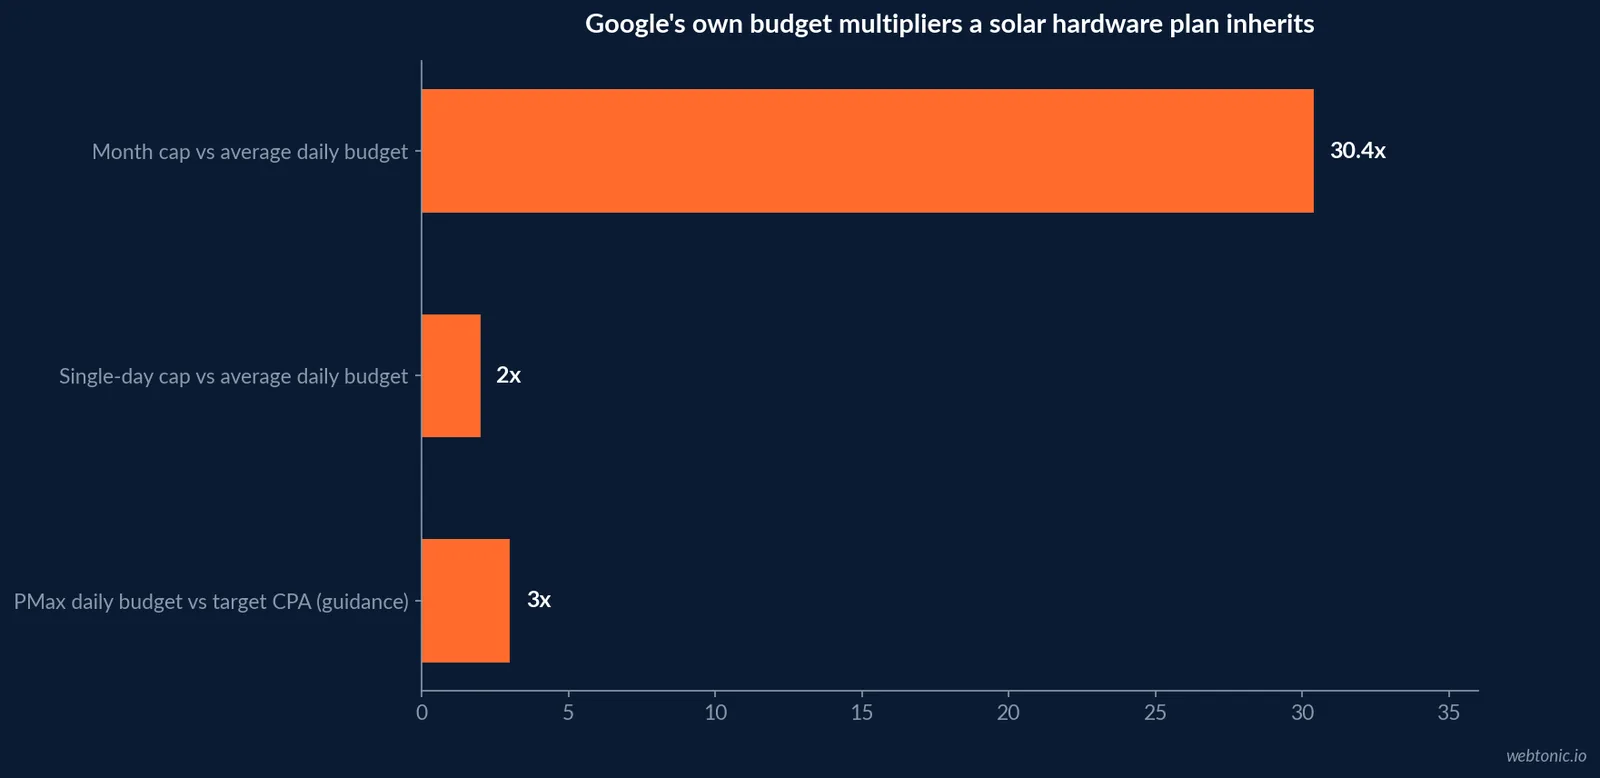
Because no third party publishes a solar Shopping rate card, the defensible answer comes from Google's help centre. Its budget page states a campaign "might spend up to twice your average daily budget" on a given day and that by month end "you will have spent no more than 30.4 times your average daily budget". The Performance Max setup page adds: "set an average daily budget of at least 3 times your CPA". So a seller whose target cost per sale is known can derive a floor: three times that target per day, with the month capped at 30.4 days of it.
The feed side can start at zero. Google's free listings page says new Merchant Center accounts are opted in by default and products can appear at no cost on Search, Maps, YouTube, the Shopping tab, Images and Lens.
| Budget line | Google's published rule | What it means for a solar seller |
|---|---|---|
| Free listings | No cost; on by default for new accounts | Test feed quality before paying |
| Daily pacing | Up to 2x the average daily budget on a day | Spikes on high-demand days are normal |
| Monthly cap | No more than 30.4x the average daily budget | Set daily budget = monthly plan / 30.4 |
| Performance Max floor | Daily budget at least 3x CPA | High-ticket inverters and batteries need a larger floor |
| Local Services Ads | Pay per valid lead; 10 leads/week suggested | Installer lead budget, not a feed budget |
Feed optimization costs that are not media
Google's product data specification sets the attributes every item needs, and its 2026 specification update adds work to the budget. Google introduced a video_link attribute on April 14, 2026, with serving from June 30, 2026, and will enforce a 500 x 500 pixel minimum for product images from January 31, 2027. For panel and inverter catalogues that often reuse small manufacturer images, the image rule is the most concrete feed-optimization line to budget in 2026.
Storage: the retrofit line in a solar feed
Batteries are the product line where hardware demand and installation demand come apart most clearly. EnergySage reports national battery attachment rates falling from 41% to 38% in H2 2025, while homeowner interest in storage slipped only from 74% to 73%; the report calls the gap "deferred adoption" and a retrofit opportunity for 2026. On the utility and commercial side, SEIA reports the US energy storage industry installed 9.7 GWh in Q1 2026, its strongest first quarter on record, and says solar and storage together accounted for 91% of new electricity-generating capacity added in the quarter.
For a feed, that argues for separating battery SKUs into their own campaign or asset group with their own budget, rather than letting panels and batteries share one daily budget. Retrofit buyers already own panels; they search for capacity, chemistry and compatibility, which belong in the title and product_detail attributes rather than in ad copy. It also argues for keeping stock and price data current: a battery that is out of stock or mispriced against the landing page is disapproved, and the budget then flows to whichever SKUs remain eligible rather than to the ones you meant to push.
| Storage signal | Figure | Period | Source |
|---|---|---|---|
| Residential battery attachment rate | 41% to 38% | H1 to H2 2025 | EnergySage |
| Homeowner interest in storage | 74% to 73% | H1 to H2 2025 | EnergySage |
| US storage installed | 9.7 GWh (record Q1) | Q1 2026 | SEIA |
| Solar + storage share of new capacity | 91% | Q1 2026 | SEIA |
| Solar alone share of new capacity | 60% | Q1 2026 | SEIA |
Cross-industry Shopping cost trend
There is no published solar-specific Shopping CTR, conversion rate or ROAS, and we do not estimate one. The closest named data is Tinuiti's Q4 2025 benchmark (vendor, same-client data): Shopping ad spend up 16%, CPC down 1%, and Performance Max taking 62% of Shopping spend and generating 61% of Shopping sales for brands running both campaign types. Performance Max conversion rates ran 3% below standard Shopping in that quarter, with a 1% ROAS deficit. For budgeting, the flat CPC means spend growth bought more clicks rather than dearer ones.
| Cross-industry signal | Figure | Period | Issuer |
|---|---|---|---|
| Shopping ad spend growth | +16% | Q4 2025 | Tinuiti (client data) |
| Shopping CPC | -1% | Q4 2025 | Tinuiti (client data) |
| PMax share of Shopping sales | 61% | Q4 2025 | Tinuiti (client data) |
| Search ad revenue | USD 114.2 billion | 2025 | IAB/PwC |
| E-commerce share of US retail | 17.1% | Q2 2026 | US Census Bureau |
The installer budget lives outside the feed
Installers that sell labour belong in formats built for services. Google's US Local Services Ads list includes Solar energy contractor; you pay per valid lead, and Google recommends a minimum budget of 10 leads per week. Google's transition notice says these campaigns move into Performance Max with pay-per-lead goals from August 2026, with remaining categories following through 2027. Search campaigns are the other route; our Google Ads strategy guide covers structure.
Claims your listings must not make
Solar titles and descriptions are marketing claims. The FTC's Green Guides, 16 CFR 260.15 state that "it is deceptive to misrepresent, directly or by implication, that a product or package is made with renewable energy" and that marketers should "clearly and prominently qualify" renewable energy claims they cannot fully substantiate. Keep feed titles to specifications - wattage, cell type, dimensions - and keep savings promises out of product data.
A budget sequence for solar hardware sellers
- Load panels, kits, inverters and batteries with correct categories and 500 x 500 images; strip any bundled installation.
- Run free listings first to see which SKUs Google matches.
- Set a paid daily budget from your target CPA x 3, and a monthly plan divided by 30.4.
- Fund installer leads separately through Local Services Ads or Search.
- Review price competitiveness against the USD 2.49/W installed benchmark buyers already see.
For the awareness channel, see our solar CTV data, and our data intelligence team can tie sales and leads back to each budget line.
Frequently Asked Questions
Is there a minimum budget for Google Shopping?
Google does not publish a minimum spend for Shopping or Performance Max. What it does publish are the rules that shape a budget: free product listings cost nothing, a campaign may spend up to 2 times its average daily budget on a given day, the monthly charge is capped at 30.4 times the average daily budget, and for Performance Max Google advises a daily budget of at least 3 times your CPA.
Can a solar installer advertise installation in Google Shopping?
No. Google's Unsupported Shopping content policy excludes labor, time, effort or expertise that does not result in ownership of a tangible product, and explicitly includes services sold bundled with physical goods. A panel-plus-installation package is therefore not listable; the panels alone, sold as goods, can be.
Which Google product categories fit solar hardware?
Google's product taxonomy has Hardware > Power and Electrical Supplies > Solar Panels (ID 4714), Solar Energy Kits (ID 4715) and Power Inverters (ID 5142), plus Electronics > Power > Batteries (ID 276).
What should a solar installer use instead of Shopping?
Google's US Local Services Ads list includes Solar energy contractor. Local Services Ads charge per valid lead and Google recommends budgeting for at least 10 leads per week under Maximise leads bidding. Search and Performance Max without a product feed are the other Google options.
How big is the residential solar market right now?
SEIA and Wood Mackenzie report 1,179 MWdc of residential solar installed in Q1 2026, up 6% year over year, within a total of 7.8 GWdc across all segments, which was down 27% on Q1 2025.
Sources
Google Merchant Center - Unsupported Shopping content
Google product taxonomy
Google Ads - Average daily budget
Google Ads - Performance Max budget
Google Merchant Center - 2026 specification update
Google Local Services Ads - Categories (US)
SEIA/Wood Mackenzie - Solar Market Insight Q2 2026
EnergySage - H2 2025 marketplace report
eCFR - 16 CFR Part 260 Green Guides
Tinuiti - Digital Ads Benchmark Report Q4 2025
IAB/PwC - Internet Advertising Revenue Report FY 2025
US Census Bureau - Quarterly Retail E-Commerce