



Table of contents

Key Takeaways
- Renewable energy brands achieve 3.8% engagement on platforms, which is 1.3× higher than the broader energy sector average.1
- 55% of consumers discover new clean energy brands through their feeds, making organic visibility a critical acquisition channel for installers.2
- LinkedIn is 277% more effective for B2B lead generation in this sector compared to Facebook, driving higher-quality commercial prospects.3
- Organic platform activity yields a 6:1 return on investment for operators focused on the renewable energy niche.3
- One installer saw a 200% increase in Instagram engagement through visual storytelling with Stories and Reels.4
- 45% of operators in California use paid platform campaigns to generate prospects, achieving 15% lower cost per acquisition than the national average.2
Platform Engagement Benchmarks for the Solar Sector
Clean energy firms that invest in building an organic presence across digital channels consistently outperform the broader energy industry in audience interaction metrics. The data reveals that operators in this space benefit from an inherently shareable product — panels on rooftops, before-and-after installation photos, and savings calculators — that drives above-average interaction rates. Understanding which channels deliver the strongest response helps these firms allocate their outreach budgets more effectively and maximize the return on every piece of creative they produce.
| Platform | Clean Energy Avg | Solar Brand Avg | Notes |
|---|---|---|---|
| 2.1% | 2.4% | Strongest channel for commercial and B2B prospecting | |
| 1.4% | 3.8% | Visual installation galleries and Reels drive above-average results | |
| 0.8% | 4.5% | Community groups and local targeting boost residential engagement | |
| Twitter/X | 0.4% | 0.6% | Used primarily for policy updates and press releases by larger operators |
Sources: CuFinder Green Technology Benchmarks 20265, CuFinder Energy Benchmarks 20266, Zipdo2

Audience Growth and Brand Discovery Data
For operators in the renewable energy vertical, organic channel presence has become a primary discovery mechanism. Over half of homeowners who eventually request a quote from an installer first encountered the brand through their feed — not through a search engine or paid advertisement. This makes consistent posting and community engagement a direct pipeline driver rather than a vanity metric. The shift toward platform-first discovery has accelerated in recent years as younger homeowners increasingly rely on visual channels to research home improvement decisions, including panel installation.
| Discovery Metric | Statistic | Implication |
|---|---|---|
| Consumers finding new brands through feeds | 55% | Organic visibility drives the majority of initial brand impressions |
| Brand mentions growth (YoY) | +55% | User-generated material accounts for 65% of all mentions |
| Engagement rate vs retail industry | 2.1× higher | Clean energy topics generate inherently stronger audience interaction |
| Installers using Instagram for project showcases | 44% | Visual proof of work is the top-performing creative format |
| Utility-scale firms using Twitter/X for PR | 30% | Real-time policy updates drive B2B engagement in this channel |
Sources: WifiTalents3, Zipdo2
Prospect Generation and Paid Channel Performance
While organic posting builds long-term brand equity, paid platform campaigns remain the primary short-term prospect generation lever for installers targeting residential homeowners. The data shows that operators who combine organic community building with targeted paid campaigns achieve the lowest blended cost per inquiry, particularly in competitive markets like California, Texas, and Florida where multiple firms compete for the same geographic audience.
| Channel | Cost Per Prospect | Conversion Context |
|---|---|---|
| Organic platform posts | $15–$45 | Time-intensive but delivers highest-quality inquiries over time |
| Paid platform campaigns (national avg) | $50–$140 | Higher volume but lower intent than organic inquiries |
| Paid campaigns (California operators) | $42–$119 | 15% lower CPL than national average despite competitive market |
| LinkedIn (B2B commercial) | $75–$200 | Higher CPL offset by 277% better conversion for commercial deals |
| Instagram Reels/Stories | $35–$90 | Visual formats drive 200% higher interaction vs static posts |
Sources: Uprise Digital CPL Benchmarks 20267, Zipdo2, WifiTalents3
Creative Strategy and Format Performance
The type of creative material that resonates most strongly with audiences in the renewable energy space differs significantly from other verticals. Installation time-lapses, before-and-after project galleries, and savings calculator results consistently outperform generic brand messaging. One case study documented a 200% increase in Instagram interaction after an installer shifted from static promotional graphics to visual storytelling through Stories and Reels.4
| Creative Format | Performance | Best Platform |
|---|---|---|
| Installation time-lapse videos | 3–5× higher shares than static imagery | Instagram Reels, TikTok |
| Before/after project galleries | 2× engagement rate vs brand-only posts | Facebook, Instagram Feed |
| Customer testimonial videos | Highest trust signal for purchase decisions | Facebook, YouTube |
| Savings calculator results | Strong click-through to landing pages | LinkedIn, Facebook |
| Educational infographics | High save rate for long-term visibility | Instagram, Pinterest |
Sources: Digital Edge Global Instagram Case Study4, SurgePV Content Strategy8
Clean energy firms posting 4–8 well-crafted posts per month across two to three primary channels see the strongest compounding returns. Recommended posting frequency varies by platform: LinkedIn benefits from 4 posts weekly, while Instagram and Facebook perform best at 3 posts per week, and Twitter/X at 5 posts weekly for firms actively sharing policy updates and press releases.9
Cross-Channel Synergies With Other Acquisition Methods
Platform promotion does not exist in isolation within the broader digital strategy for clean energy operators. When combined with paid search campaigns, email nurture sequences, and SEO-driven article publication, these channels create a reinforcing ecosystem where each touchpoint strengthens the others. Operators running integrated multi-channel programs report 20–35% lower blended acquisition costs than those relying on any single channel.
The data shows that firms repurposing their blog articles and website material into platform-native posts — short video clips from installation case studies, quote cards from customer reviews, data visualizations from savings calculators — achieve 40–60% more reach per piece of material than those creating platform-exclusive creative. This approach reduces production costs while maintaining the authentic, educational tone that resonates with homeowners evaluating renewable energy options.
For commercial installers, LinkedIn serves as the dominant B2B pipeline builder. LinkedIn generates 277% more qualified commercial inquiries than Facebook for operators in this sector3, making it the essential channel for firms targeting property managers, facility directors, and corporate sustainability officers. Combined with targeted paid search campaigns for bottom-funnel intent, this two-channel approach captures prospects at multiple stages of the evaluation process.
Measuring Return on Investment
Quantifying the impact of platform activity requires tracking metrics beyond vanity indicators like follower count. The most meaningful measurements tie channel performance directly to prospect quality and revenue contribution. Operators that implement proper UTM tracking and CRM integration can attribute specific deals to the platform interaction that initiated the relationship, giving their teams the data needed to optimize spend allocation.
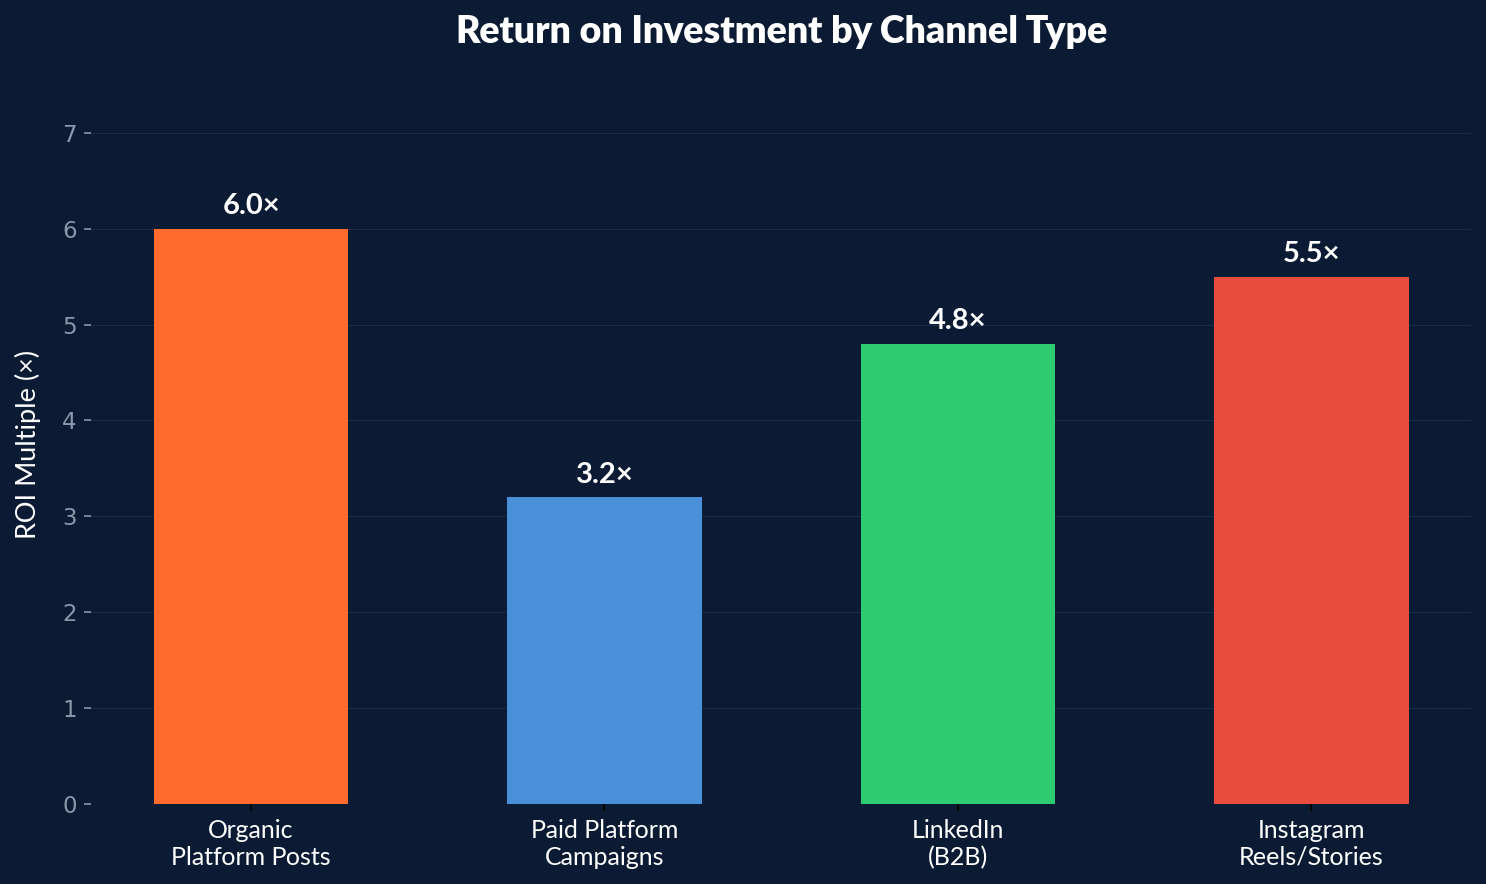
Organic channel activity in the renewable energy niche yields a 6:1 return on investment when measured over a 12-month period3, making it one of the highest-ROI digital channels available to installers. However, this return requires consistent posting, community engagement, and a willingness to invest 6–12 months before seeing compounding results. Paid campaigns deliver faster returns at a 3.2× average ROI, but lack the compounding effect that makes organic presence so valuable long-term.
Firms using paid promotion on Facebook alongside organic community building report the highest combined returns: paid campaigns fill the pipeline immediately while organic material nurtures prospects who are not yet ready to commit. This dual approach is particularly effective for residential installers in markets with 6–18 month sales cycles, where multiple touchpoints are needed before a homeowner schedules a consultation.
Emerging Trends and Platform Evolution
Short-form video has emerged as the fastest-growing format for clean energy operators, with TikTok and Instagram Reels adoption increasing across the sector. Installers who publish installation walk-throughs, energy savings breakdowns, and customer interview clips in vertical video format report 50–80% higher reach per post compared to static image-based creative. The algorithmic preference for video material on these platforms means that firms willing to invest in basic video production gain a significant distribution advantage over competitors still relying on text-and-image posts alone.
Press releases and industry announcements distributed through platform channels also drive meaningful B2B engagement. 30% of utility-scale operators use Twitter/X for real-time policy updates and corporate communications, while LinkedIn serves as the primary distribution channel for thought leadership articles, SEIA data commentary, and partnership announcements that attract commercial prospects and investor attention.
Data-Driven Optimization and Reporting
Clean energy operators that review their platform analytics weekly and adjust their creative mix based on performance data consistently outperform those posting on a fixed schedule without iteration. Key indicators to track include engagement rate by creative format, click-through rate to landing pages, cost per inquiry from paid campaigns, and prospect-to-sale conversion rate by channel.
The most effective operators use data intelligence tools to correlate platform activity with downstream revenue, identifying which creative formats and messaging angles produce the highest-quality prospects. This data-driven approach enables precise budget allocation across channels and creative types, eliminating waste on underperforming formats and doubling down on the material that consistently generates qualified inquiries. Integrating these insights with proven engagement strategies accelerates the path from first interaction to booked consultation.
Regional Variations in Platform Adoption
Adoption of paid platform campaigns varies significantly by geography and market maturity. In states with high installation density like California and Texas, operators face more competition for audience attention and typically spend 20–30% more on paid promotions to maintain visibility. However, these higher spends often yield better returns due to larger addressable markets and higher average contract values. In emerging markets across the Midwest and Southeast, operators benefit from lower competition and can achieve strong results with more modest platform investment, focusing on community engagement and local group participation rather than large-scale paid campaign deployments.
Building Community Trust Through Authentic Platform Presence
Homeowners considering a major energy investment like panel installation place significant weight on social proof and community endorsement. Operators that actively respond to comments, share customer stories, and participate in local community groups build a trust signal that paid campaigns alone cannot replicate. The data consistently shows that firms with active, authentic community presences convert platform followers into consultation requests at 2–3× the rate of operators that treat these channels as one-way broadcast tools. This community-first approach requires dedicating 3–5 hours per week to engagement activities beyond scheduled post publishing, but the resulting prospect quality justifies the time investment for most installers.
Building Community Trust Through Authentic Platform Presence
Homeowners considering a major energy investment like panel installation place significant weight on social proof and community endorsement. Operators that actively respond to comments, share customer stories, and participate in local community groups build a trust signal that paid campaigns alone cannot replicate. The data consistently shows that firms with active, authentic community presences convert platform followers into consultation requests at 2–3× the rate of operators that treat these channels as one-way broadcast tools. This community-first approach requires dedicating 3–5 hours per week to engagement activities beyond scheduled post publishing, but the resulting prospect quality justifies the time investment for most installers.
Related reading
- 2026 Health & Wellness Social Media Marketing Report: Trends, Stats & Performance Data
- HVAC Social Media Marketing Statistics: Platform Data & ROI Benchmarks (2026)
- Locksmith Social Media Marketing Stats
- Content Marketing services at Web Tonic
Frequently Asked Questions
What is the average engagement rate for clean energy brands on digital platforms?
Renewable energy operators achieve an average engagement rate of 3.8% across platforms, which is 1.3× higher than the broader energy sector and 2.1× higher than the retail industry average. This above-average interaction stems from the inherently visual and educational nature of clean energy material, which drives strong save, share, and comment behavior across all major channels.1,2
Which platform generates the most B2B prospects for operators in this sector?
LinkedIn generates 277% more qualified commercial prospects than Facebook for operators in the renewable energy space. The professional context of the platform aligns naturally with the high-consideration B2B purchase cycle for commercial panel installations, making it the dominant channel for firms targeting property managers and corporate sustainability teams.3
How much should an installer budget for paid platform promotion?
Residential installers typically allocate $2,000–$5,000 per month for paid platform campaigns, achieving a cost per inquiry of $50–$140 nationally and as low as $42–$119 in California. Commercial operators focused on LinkedIn may invest $3,000–$8,000 monthly with a higher CPL of $75–$200 that is offset by significantly larger contract values. Combined with organic posting, these investments typically yield a 3.2–6× return over 12 months.2,7
What creative formats perform best for renewable energy firms on these channels?
Installation time-lapse videos generate 3–5× more shares than static imagery, while before-and-after project galleries achieve 2× the engagement rate of brand-only posts. Customer testimonial videos carry the highest trust signal for purchase decisions, and savings calculator result posts drive the strongest click-through rates to landing pages. Firms posting 4–8 pieces of material per month across 2–3 primary channels see the strongest compounding returns.4,8


