Table of contents
Referral leads convert at 29% to 37% for a cost per lead of USD 0 to 50, while purchased search ad leads convert at 8% to 15% for USD 100 to 300 - and that gap, not the headline lead price, is the number that should decide where a solar installer's 2026 demand generation budget goes.
Key Takeaways
- Residential solar CAC hit a 5-year low of USD 0.60/W in 2025, per Wood Mackenzie.
- CAC is projected to spike 40% to USD 0.84/W in 2026 as the market contracts.
- US residential solar cost per watt fell 10% from 2024 to 2025 on AI-enabled sales tools and an ITC pull-forward rush.
- Homeowners actively working with installers surged 205% year over year in late 2025 (EnergySage).
- That surge followed the OBBBA's elimination of the 30% federal residential tax credit after Dec 31, 2025.
- Total US solar installations fell 27% year over year in Q1 2026 (SEIA).
- Residential solar still grew 6% year over year in that same quarter.
- SEIA projects a 21% residential market contraction across 2026 before 2027 recovery.
- 67% of homeowners cite strong warranties as a top installer trust signal (Aurora Solar Snapshot 2026).
- 54% cite technical expertise and 54% cite verified reviews as top trust signals.
- 62% of installers saw increased interest tied to the IRA, and 63% believe the OBBB's credit repeal will hurt their business.
- Referral and repeat-customer channels carry a structurally lower acquisition cost than cold lead generation, per Wood Mackenzie.
The demand shock that reshaped the funnel
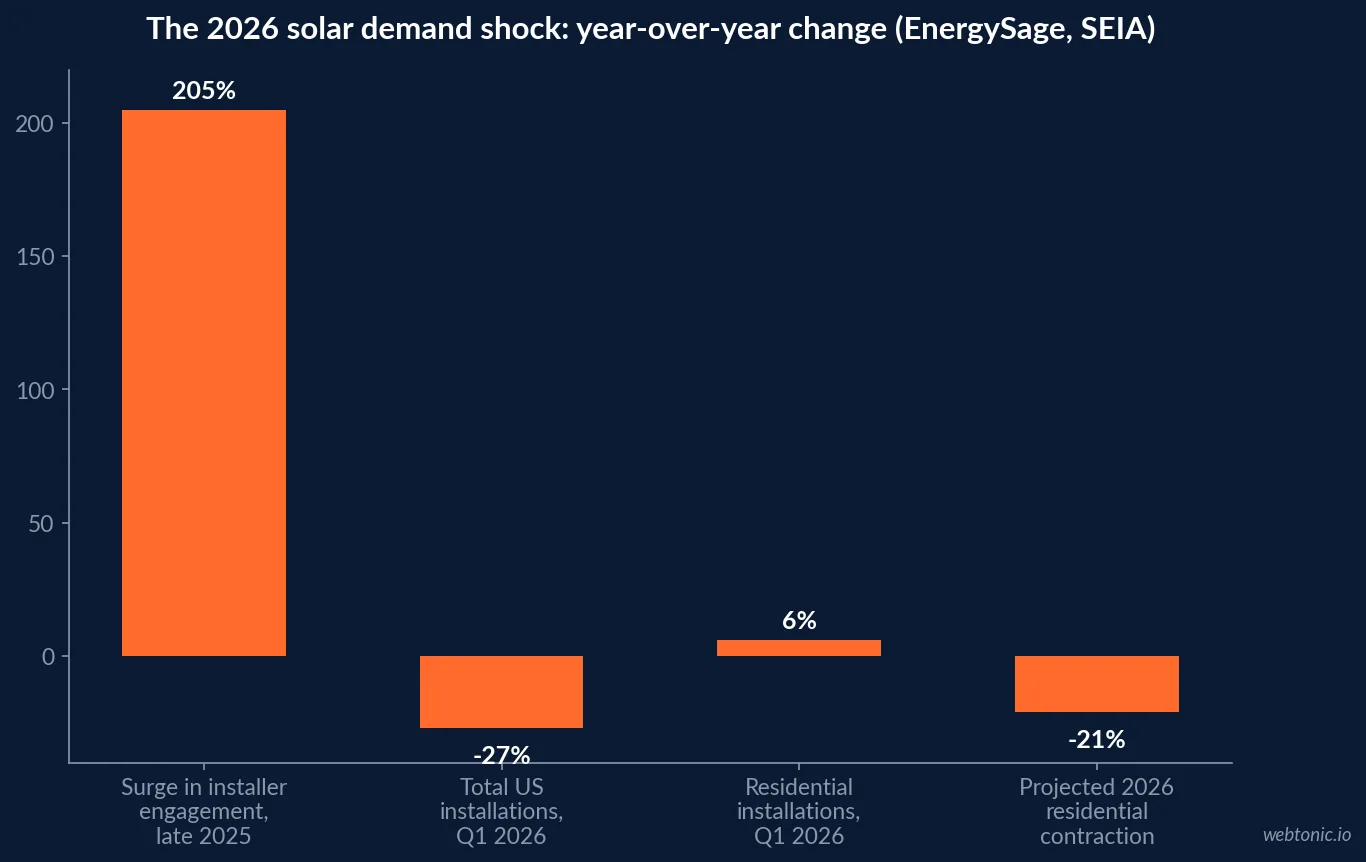
Residential solar demand generation cannot be read in 2026 without the policy event that distorted it. The One Big Beautiful Bill Act, passed in July 2025, eliminated the 30% federal tax credit for purchased residential solar systems installed after December 31, 2025. EnergySage's 22nd Intel: Home Electrification Marketplace Report recorded a 205% year-over-year surge in homeowners actively working with installers through late 2025, with most installers reaching annual capacity by October. Solar prices barely moved despite the rush - up just 0.4% to USD 2.49/W - which EnergySage credits to marketplace price transparency limiting panic pricing even under record demand.
That pulled-forward demand then cleared out. SEIA's Solar Market Insight Report, Q2 2026 found total US installations fell 27% year over year in Q1 2026, even as residential capacity specifically still grew 6% year over year on the strength of the overflow from Q4 2025. SEIA now projects a 21% residential market contraction across all of 2026 before recovery begins in 2027. Pv magazine's independent reporting on the same EnergySage data confirms the 205% figure and adds that the average system size was 11.8 kW, with storage attachment rates declining as customers rushed to close before the deadline.
The rebound that followed is real but uneven by segment. A Wood Mackenzie/SEIA press release covering Q2 2026 shows total US solar capacity additions rising 45% year over year that quarter - but the growth is utility-scale (up 61% year over year), not residential, which is the segment this page is about. Reading a utility-scale headline as a residential demand-gen signal is a common and avoidable mistake.
| Demand-shock benchmark (2026) | Figure | Source |
|---|---|---|
| Surge in active installer engagement, late 2025 | +205% YoY | EnergySage 22nd Marketplace Report |
| Residential solar price move despite the surge | +0.4% to USD 2.49/W | EnergySage 22nd Marketplace Report |
| Total US installed capacity, Q1 2026 | 7.8 GWdc (-27% YoY) | SEIA Solar Market Insight Q2 2026 |
| Residential installed capacity, Q1 2026 | 1,179 MWdc (+6% YoY) | SEIA Solar Market Insight Q2 2026 |
| Projected 2026 residential contraction | 21% | SEIA Solar Market Insight Q2 2026 |
What "demand generation" means for a physical, permitted product
Google's own Demand Gen campaign documentation describes the format as built to "capture engagement and action" across YouTube, Discover, Gmail and Display - a demand-creation tool for products people don't yet know they want. Solar sits in an odd spot for that framing: awareness is already high (most homeowners have heard of solar), so conviction and trust are the real barriers, which is consistent with why referral and site-based research dominate the channel mix below rather than pure top-of-funnel reach.
Channel mix: what the acquisition-cost data actually supports
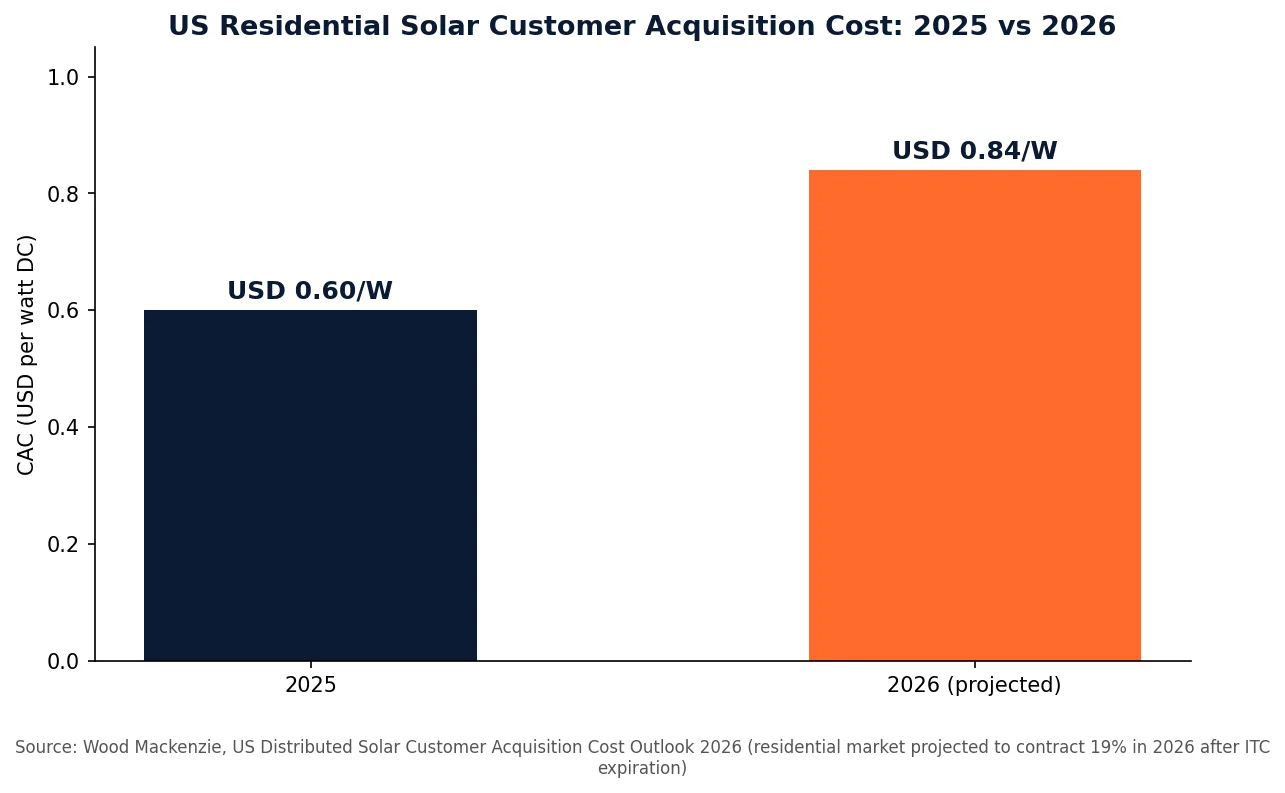
Cost per lead alone misleads in solar because the channel that produces the cheapest lead is rarely the channel that produces the cheapest signed contract, and the industry-wide acquisition-cost trend shows why the underlying arithmetic is getting harder, not easier. Wood Mackenzie's US Distributed Solar Customer Acquisition Cost Outlook 2026 puts national residential CAC at a five-year low of USD 0.60/W in 2025 - a 10% drop from 2024 driven by AI-enabled sales tools and an ITC pull-forward demand rush - before projecting a 40% surge to USD 0.84/W in 2026 as the residential market contracts roughly 19% following the federal tax credit's expiration and installers compete harder for a shrinking pool of buyers.
Wood Mackenzie is explicit about where that 2026 cost increase lands: companies are pouring the extra spend into customer engagement platforms, referral programs, and multi-product ecosystems (storage, EV chargers, roofing) specifically because repeat and referral revenue carries a lower acquisition cost than cold lead generation - the same logic that makes referral the channel worth protecting when overall demand-gen budgets are under pressure.
| Metric | Figure | Source |
|---|---|---|
| Residential solar CAC, 2025 (5-yr low) | USD 0.60/W | Wood Mackenzie CAC Outlook 2026 |
| Residential solar CAC, 2026 (projected) | USD 0.84/W | Wood Mackenzie CAC Outlook 2026 |
| YoY CAC increase, 2025 to 2026 | +40% | Wood Mackenzie CAC Outlook 2026 |
| CAC decline, 2024 to 2025 | -10% | Wood Mackenzie CAC Outlook 2026 |
| Projected residential market contraction, 2026 | ~19% | Wood Mackenzie CAC Outlook 2026 |
Why trust signals - not just cost per lead - decide whether a demand-gen channel closes
Solar has one of the longest sales cycles in home services because a physical site survey, an engineering design, and permitting sit between a raw lead and a signed contract, and buyers spend that time comparing installers on more than price. The 2026 Aurora Solar Snapshot (surveying 1,112 homeowners and 600+ solar professionals) found that when homeowners select an installer, they weigh three trust signals above everything else: strong warranties, cited by 67% of interested buyers, and technical expertise and verified reviews, each cited by 54%. A demand-gen channel that generates a lead without giving the sales team a way to prove warranty strength and review credibility loses deals it should have won on price alone.
The same survey found demand itself is policy-driven right now: 62% of installers reported increased homeowner interest tied directly to the Inflation Reduction Act, and 45% saw a surge specifically from homeowners racing to use IRA-linked benefits before the 2025 deadline - the urgency wave behind 2025's CAC dip. Looking forward, 63% of installers believe the OBBB's repeal of the homeowner tax credit will hurt their business, with 27% predicting a significant negative impact, which is the demand-side mechanism behind Wood Mackenzie's 2026 CAC spike above.
| Aurora Solar Snapshot 2026 finding | Figure |
|---|---|
| Buyers citing strong warranties as a top trust signal | 67% |
| Buyers citing technical expertise as a top trust signal | 54% |
| Buyers citing verified reviews as a top trust signal | 54% |
| Installers reporting increased interest tied to the IRA | 62% |
| Installers seeing a surge from homeowners racing the 2025 deadline | 45% |
| Installers who believe OBBB's credit repeal will hurt their business | 63% |
The margin case for shifting the mix toward referral
Wood Mackenzie's outlook is explicit that the 2026 cost increase is not evenly distributed: installers who lean on referral, repeat customers and multi-product ecosystems are absorbing less of that 40% cost-per-watt spike than installers still dependent on cold digital and door-to-door lead generation, because repeat and referral revenue carries a structurally lower acquisition cost. That matters more this year because SEIA's Solar Market Insight Report, Q2 2026 already projects a 21% contraction in the addressable residential market for 2026 - fewer buyers, competing for the same installer base, is exactly the condition under which a lower-CAC channel mix becomes a margin advantage rather than a nice-to-have.
In a shrinking market, the installers whose demand-gen mix already skewed toward referral and organic are the ones with the CAC headroom to keep bidding competitively on the leads that remain. That headroom matters because acquisition cost has been rising for structural reasons beyond the tax credit too: the Department of Energy's Tracking the Sun report from Lawrence Berkeley National Laboratory attributes most of the last decade's residential price declines to falling module costs, with soft costs - customer acquisition chief among them - now the dominant lever left to cut.
So, is it still worth it?
The honest answer from the data is conditional: aggregate residential demand contracted in 2026, but the channels with the best unit economics - referral and organic search - did not get more expensive, and SEIA still recorded 6% year-over-year residential growth even inside a contracting overall market. The installers losing ground are disproportionately the ones over-indexed on the priciest, lowest-converting channels: telemarketing and shared purchased leads. Demand generation is still worth funding in 2026; the channel mix it should fund looks different than it did before the tax credit expired.
If the goal is rebuilding that mix - shifting budget toward referral systems and organic content while keeping paid search live for the leads that are still searching - our growth marketing team and data and analytics practice build that pairing together; see our related cost per lead by industry breakdown for how solar compares to other home-services categories.
Frequently Asked Questions
Is solar demand generation still worth it after the tax credit expired?
The data says yes, but the channel mix that pays off changed. SEIA's Q2 2026 report shows residential solar installed capacity still grew 6% year over year in Q1 2026 even as the overall market contracted 27% - demand did not disappear, it concentrated among installers with efficient acquisition. The channels with the best documented economics, referrals and organic search, remained cheap and high-converting throughout; the channels that got worse were the expensive, low-intent ones like cold telemarketing and shared purchased leads.
What triggered the sudden 2026 change in solar demand?
The One Big Beautiful Bill Act, passed in July 2025, eliminated the 30% federal tax credit for purchased residential solar systems installed after December 31, 2025. EnergySage's 22nd Marketplace Report recorded a 205% year-over-year surge in homeowners actively working with installers ahead of that deadline, with most installers reaching annual capacity by October 2025 - then SEIA's Q1 2026 data shows the hangover: total US installations fell 27% year over year as that pulled-forward demand cleared out.
Which lead channel actually converts best for residential solar?
There is no independently audited, channel-by-channel conversion benchmark publicly available for residential solar, but Wood Mackenzie's own CAC Outlook 2026 points to referral and repeat-customer channels as the lower-cost path: it names referral programs and multi-product ecosystems as the specific investments installers are making to keep acquisition cost down as the overall market's CAC rises 40% in 2026. The 2026 Aurora Solar Snapshot backs that with the buyer side of the equation - homeowners say strong warranties (67%), technical expertise (54%) and verified reviews (54%) decide who they choose, all trust signals a referral or reviewed lead arrives with pre-built, which is why referral tends to out-convert colder, paid-media leads even without a published conversion-rate benchmark.
How many installer quotes does a homeowner typically get, and how far does a lead actually travel?
There is no single published industry figure for quotes-per-homeowner, but the sales cycle is verifiably long: a physical site survey, an engineering design and a permitting step sit between a raw lead and a signed contract, stages that do not exist in most other home-service categories. That is also why Wood Mackenzie ties 2026's cost increase partly to installers investing in customer engagement platforms to keep leads warm through that longer chain, and why the trust signals in the Aurora Solar Snapshot above (warranties, technical expertise, reviews) matter more the longer a homeowner has to wait between first contact and installation.
Does solar demand generation still have a seasonal pattern in 2026?
It has a policy-driven pattern that has temporarily overtaken the old weather-driven one. Historically, solar demand tracked summer electricity bills; in late 2025 it instead tracked a regulatory deadline, producing the 205% EnergySage surge before December 31, 2025 and the subsequent Q1 2026 pullback SEIA recorded. Expect the funnel to re-normalize toward ordinary seasonality as the one-time credit-driven demand works through the pipeline over 2026 and 2027.
Sources
EnergySage - 22nd Intel: Home Electrification Marketplace Report
SEIA - Solar Market Insight Report, Q2 2026
Pv magazine - Expiring US tax credit drives record solar demand in H2 2025
Wood Mackenzie / SEIA - Q2 2026 US solar capacity press release
Google Ads Help - About Demand Gen campaigns
Wood Mackenzie - US Distributed Solar Customer Acquisition Cost Outlook 2026
Aurora Solar - 2026 Aurora Solar Snapshot (n=1,112 homeowners, 600+ solar pros)
Lawrence Berkeley National Laboratory - Tracking the Sun report