Table of contents
A roofing website has one hard test a year, and it is not a design review - it is the 72 hours after a hail swath, when call volume spikes 5 to 10 times and the first contractor to respond books about 62% of jobs. Here is what the 2026 data says about running that site on Webflow.
Key Takeaways
- Webflow powers about 2.8% of websites in 2026, up from 0.6% in 2022 - a 4.7x four-year rise.
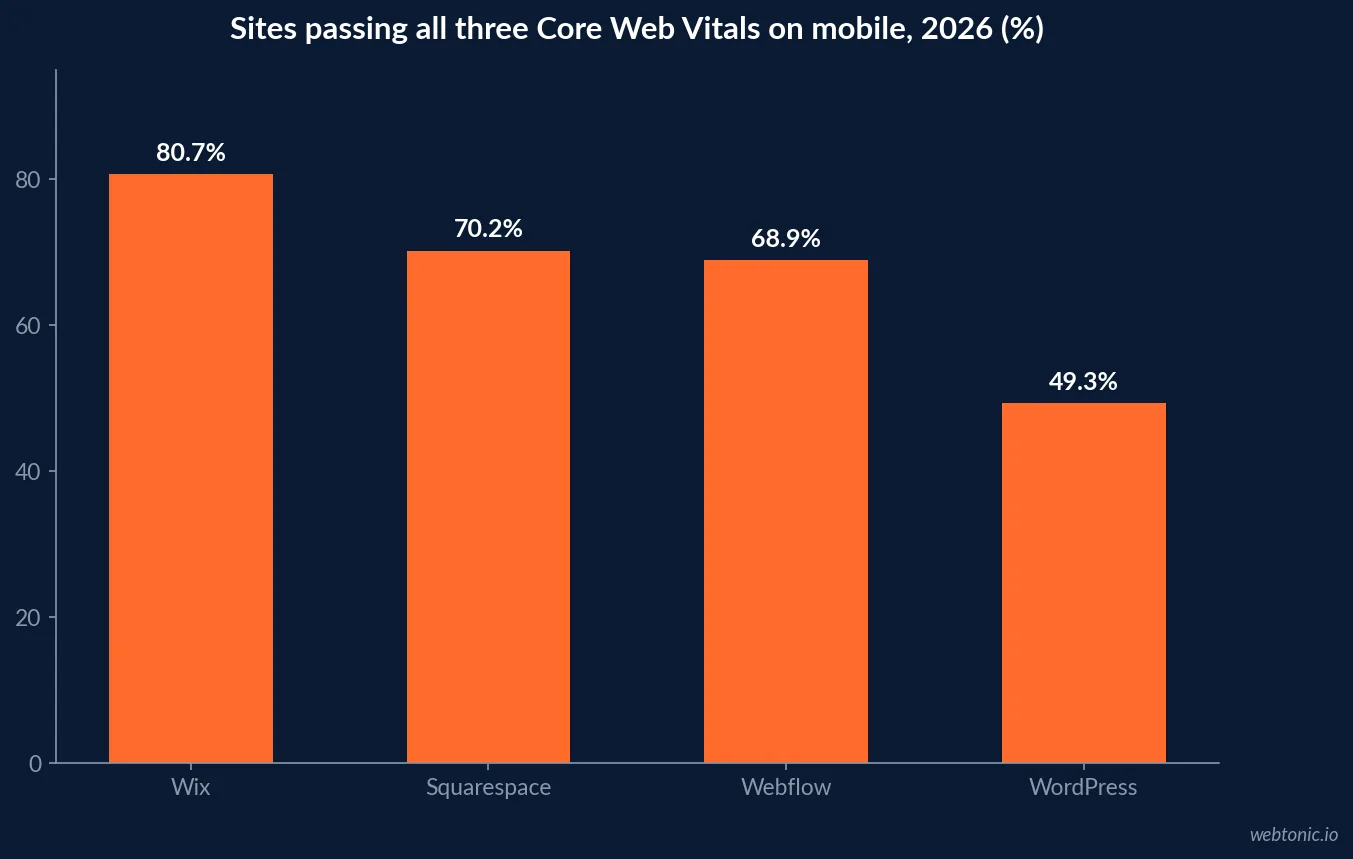
- 68.9% of Webflow sites pass all three Core Web Vitals on mobile, against 49.3% of WordPress sites.
- Wix (80.7%) and Squarespace (70.2%) both beat Webflow on that same pass rate, so Webflow is fast, not fastest.
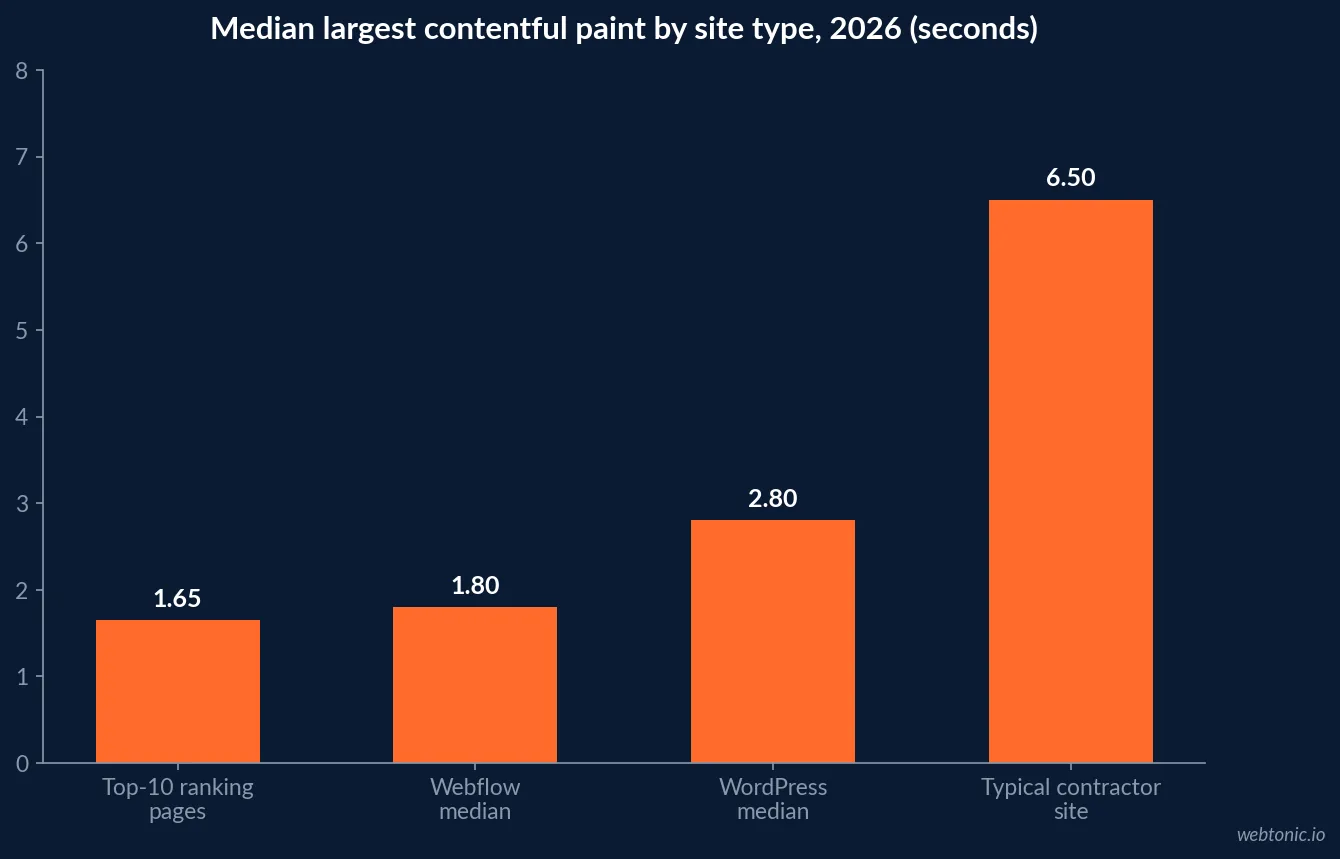
- Median Webflow largest contentful paint is roughly 1.8 seconds versus 2.8 seconds on WordPress.
- Webflow ships a median 918 KB of JavaScript per page against 1,707 KB on Wix.
- Typical contractor sites load in 5 to 8 seconds, while top-ten ranking pages cluster near 1.65 seconds.
- The median contractor site converts 2% to 4% of visitors; the top 6% convert at 8% to 12%.
- Click-to-call runs 3% to 5% on weak contractor sites and 10% to 15% on well-built ones.
- Roofing traffic is 65% to 75% mobile, and above 80% during emergency windows.
- Roofing buys the most expensive clicks in home services at $14.66 per click and $313 per lead - every bounce is paid for twice.
- Webflow plan pricing after May 2026: $14 Basic, $23 CMS, $39 Business per month billed yearly, with Premium at $25.
- Construction and AEC website redesigns averaged 340% ROI with break-even at 8.3 months.
- Design-plus-content redesigns returned up to 70% more than visual-refresh-only projects.
- In a 16-million-page study, 61.94% of pages were never indexed - templated city pages are the usual culprit.
- Webflow revenue reached $213 million in 2024, up 66% year over year, and 95% of marketing leaders say current website governance hurts their ability to manage sites.
Platform benchmarks at a glance
The honest comparison for a roofing contractor is not Webflow versus WordPress in the abstract - it is what each platform does to mobile speed, editing time and indexation. Share and pricing figures come from 2026 website builder market share data and aggregated Webflow statistics; the speed column comes from a WordPress vs Webflow vs Squarespace speed comparison.
| Platform | Share of websites (2026) | Passes all 3 CWV (mobile) | Median LCP | Median JS per page |
|---|---|---|---|---|
| Webflow | About 2.8% | 68.9% | About 1.8 s | 918 KB |
| WordPress | 42.4% | 49.3% | About 2.8 s | About 1,100 KB |
| Wix | Around 4% | 80.7% | About 2.1 s | 1,707 KB |
| Squarespace | Around 3% | 70.2% | About 2.2 s | About 1,300 KB |
| Shopify | 8.4% | Not comparable (commerce) | About 2.4 s | About 1,500 KB |
Two readings follow. First, Webflow is a large improvement on the platform most roofing sites actually run on. Second, it is not the fastest builder in the field - Wix leads that table - so the argument for Webflow in roofing is speed plus CMS control over dozens of city and service pages, not raw benchmark supremacy.
Speed is capacity in roofing, not vanity
Most industries treat page speed as an SEO chore. Roofing has a harder version of the problem: demand arrives in weather-shaped pulses, and the site has to hold up on cellular connections in a neighbourhood that may have lost power. Typical contractor sites load in 5 to 8 seconds, while well-built ones sit at 1.5 to 2.5 seconds and top-ten ranking pages cluster near 1.65 seconds. Bounce rates rise about 32% at three seconds and 90% at five seconds.
| Load time | Bounce behaviour | Roofing consequence | Cost at $14.66 per click |
|---|---|---|---|
| 1.5-2.5 s | Baseline | Storm traffic converts at full rate | Full value captured |
| 3 s | Bounce about +32% | Roughly one in three storm clicks lost | About $4.85 wasted per 3 clicks |
| 5 s | Bounce about +90% | Most emergency traffic gone before the phone number renders | Half the media budget |
| 5-8 s (typical contractor site) | Compounding abandonment | Homeowner moves to the next of 3.4 contractors | Lead lost to a faster competitor |
The cost column is the part contractors underestimate. Roofing pays the highest click prices in home services - $14.66 per click and around $313 per lead - so a slow site is a media tax that compounds every time the weather turns. The full picture on those acquisition costs sits in our roofing Google Ads statistics breakdown, and the technical detail behind these speed thresholds is in our roofing technical SEO statistics guide.
What the conversion data actually says
Platform choice does not convert visitors; layout, offer and phone handling do. The benchmark spread is wide: contractor website conversion research puts the median site at 2% to 4% and the top 6% at 8% to 12%, while a study of contractor websites found most failing on the same handful of elements.
| Element | Median contractor site | Top-performing site | Why it matters in roofing |
|---|---|---|---|
| Conversion rate | 2-4% | 8-12% | Triples lead volume on identical traffic |
| Click-to-call rate | 3-5% | 10-15% | 56% of roofing homeowners prefer phone |
| Mobile share of traffic | 65-75% | Same traffic, better handling | Above 80% in emergency windows |
| Pricing transparency | Rarely shown | Ranges or starting prices shown | 65% more likely to call when pricing is visible |
| Proof of work | Stock photos | Real project galleries by city | 74% follow a neighbour referral pattern |
| Form length | 8+ fields | 4-6 fields with call fallback | Storm-week homeowners abandon long forms |
The lesson for a Webflow rebuild is to spend the budget where the spread is, not on animation. Moving from a 3% to a 9% conversion rate on the same traffic is the equivalent of tripling the ad budget, which is why redesign economics in this sector look unusually good: website redesign ROI research reports 340% average ROI in construction and AEC with break-even at 8.3 months, and up to 70% higher returns when content is rebuilt alongside the design.
The CMS trap: fifty fast pages nobody sees
Webflow's CMS is the reason most agencies recommend it for multi-location trades, and it is also the fastest route to a bloated site. Generating 60 near-identical "roof repair in {city}" pages takes an afternoon. In a study of 16 million pages, 61.94% were never indexed by Google at all, with thin templated location pages heavily represented.
| Location page type | Typical build effort | Indexation outlook | Verdict for roofing |
|---|---|---|---|
| Pure template swap (city name only) | Minutes per page | Very likely to stay unindexed | Do not ship |
| Template plus local storm history | 1-2 hours per page | Indexed but thin | Acceptable for tier-3 towns |
| Local projects, crew, permits, pricing | 3-5 hours per page | Indexes and ranks | Correct for target cities |
| Service hub plus 3-5 deep city pages | Concentrated effort | Strongest per hour invested | Best starting structure |
The discipline is to treat the CMS collection as a content commitment, not a page generator. Ten substantial city pages outperform sixty templated ones, and they leave the crawl budget pointed at pages that can actually win. Our roofing local SEO statistics guide covers how those city pages interact with map-pack visibility.
Cost of ownership after the May 2026 pricing change
Webflow simplified its plans in 2026, which changed the arithmetic for small contractors. Current plan pricing is published in Webflow's own pricing announcement and summarised alongside historical tiers in this Webflow pricing reference.
| Plan | Monthly (billed yearly) | CMS items | Fit for a roofing company |
|---|---|---|---|
| Basic | $14 | None | Single-location roofer, brochure site |
| CMS | $23 | 2,000 | Multi-city roofer with a project gallery and blog |
| Premium | $25 | Expanded | Regional roofer with heavy content output |
| Business | $39 | 10,000 | Multi-branch or franchise roofing group |
| Workspace seat | Added per editor | n/a | Only if in-house marketing edits pages |
Against a $13,400 median roofing job at 35% to 50% gross margin, every plan on that table is decided by a single job. The meaningful costs are the build, the photography and the ongoing content - and, unlike WordPress, there is no plugin bill and no security patching cycle. Webflow's own trajectory suggests the platform is not going anywhere: $213 million in 2024 revenue, up 66% year over year.
Where Webflow costs a roofer something
An honest comparison names the gaps. Webflow has no plugin marketplace, so the tools roofing companies lean on - aerial measurement, instant estimate calculators, financing widgets, insurance claim intake - must arrive as embeds, API work or third-party scripts. Every added script also erodes the speed advantage that motivated the move.
| Requirement | WordPress route | Webflow route | Practical impact |
|---|---|---|---|
| Instant roof estimate tool | Plugin | Embed or custom API build | Higher one-off build cost |
| Insurance claim intake form | Plugin plus add-ons | Native forms plus automation | Usually simpler on Webflow |
| Multi-language service area | Plugin | Localization add-on | Extra subscription line |
| Blog and city pages at scale | Plugin stack | Native CMS collections | Clear Webflow advantage |
| Security and updates | Ongoing patching | Managed by Webflow | Fewer maintenance hours |
| Third-party script bloat | Common | Still possible | Speed advantage is not automatic |
That last row is the one that gets missed. A Webflow site with six marketing scripts, a chat widget and an autoplaying hero video will lose to a lean WordPress build. The platform gives a roofing company a better starting point, not immunity.
Storm-week checklist for a roofing website
Post-storm behaviour is well documented: homeowners contact roughly 3.4 contractors, the first responder books about 62% of the time, call volume spikes 5 to 10x, and a missed call is worth $8,000 to $15,000. Details on that behaviour sit in this account of the homeowner's roofing journey in 2026 and in 2026 roofing marketing benchmarks.
- Sticky click-to-call bar on every mobile page, above the fold, with a tracked number.
- An emergency banner component an office manager can edit in under five minutes.
- Inspection request form capped at four to six fields, with the phone option beside it.
- No autoplay hero video on mobile; keep total page weight under about 1 MB.
- Service-area map with named towns, so a homeowner confirms coverage without calling to ask.
- Pricing ranges or starting figures published - homeowners are 65% more likely to call when they see them.
- Review proof near every call-to-action, with a target of 200-plus reviews at 4.9 stars.
- Real project photos by city, replacing stock imagery entirely.
- Insurance and claims content built as its own hub - about 40% of residential roofing revenue is storm work.
- Forms and calls firing conversion events, so the media data matches reality.
- Quarterly Core Web Vitals check after every new script or tracking tag.
Migration order that protects the storm season
The wrong time to move platforms is spring. Sequence the work so the new site is stable before the first severe-weather window, and so nothing structural changes while paid traffic is peaking.
| Window | Work | Risk controlled |
|---|---|---|
| Weeks 1-2 | Crawl the old site, map every URL, freeze content edits | Lost rankings on redirect gaps |
| Weeks 3-5 | Build design system, service hub and 3-5 deep city pages | Thin templated location pages |
| Week 6 | Photography shoot, review widgets, pricing ranges | Stock-photo trust gap |
| Week 7 | Forms, call tracking, conversion events, speed budget under 1 MB | Unmeasurable media spend |
| Week 8 | 301 map deployed, launch, monitor Core Web Vitals and calls daily | Traffic loss at cutover |
| Weeks 9-12 | Add remaining city pages one at a time with real local content | Index bloat |
If you would rather have it built and measured by a team that does this for home-services operators, our growth marketing team handles the build and channel work, our data intelligence team wires the measurement, and you can get in touch for a roofing-specific plan.
Frequently Asked Questions
Is Webflow a good platform for a roofing company website?
For most roofing contractors, yes - on speed and maintenance grounds rather than design ones. Webflow sites pass all three Core Web Vitals on mobile 68.9% of the time against 49.3% for WordPress, with a median largest contentful paint near 1.8 seconds versus 2.8 seconds. That matters because typical contractor sites load in 5 to 8 seconds and 65% to 75% of roofing traffic is mobile. The trade-off is that Webflow has no plugin ecosystem, so an aerial-measurement or instant-quote tool has to be an embed or a custom integration.
How much does a Webflow site cost for a roofing contractor?
After the May 2026 pricing change, a Basic site plan is $14 per month billed yearly, CMS is $23 and Business is $39, with the Premium tier at $25 per month yearly. Add a workspace seat if a marketing team edits. Against a $13,400 median roofing job at 35% to 50% gross margin, the platform fee is decided by one job every few years - the build and content budget is the real number, not the subscription.
Will moving to Webflow increase roofing leads?
Only through speed, clarity and call handling. Median contractor sites convert 2% to 4% of visitors while the top 6% convert at 8% to 12%, and click-to-call rates run 3% to 5% on weak sites against 10% to 15% on well-built ones. Construction and AEC redesign programmes averaged 340% ROI with break-even at 8.3 months, and design plus content projects returned up to 70% more than a visual refresh alone. The platform removes excuses; the offer and the phone still do the converting.
How do roofing location pages perform on Webflow?
Webflow's CMS makes 60 city pages trivial to generate, which is exactly the risk. In one study of 16 million pages, 61.94% were never indexed by Google, with templated location pages heavily represented. A roofing CMS collection needs genuine per-city substance - local storm history, permit notes, named crews, real project photos - or it produces a large, fast, invisible site.
What should a roofing website do during storm week?
Answer the phone and load instantly. Post-storm call volume spikes 5 to 10 times, homeowners contact about 3.4 contractors, and the first to respond books roughly 62% of the time, with each missed call worth $8,000 to $15,000. Practically: a sticky click-to-call bar, an emergency banner editable in minutes, an inspection form under six fields, and no hero video on mobile.
Sources
Colorlib - Website Builder Market Share 2026
Popupsmart - Webflow Statistics
Webflow - Simplified Plans and Updated Pricing 2026
Web Nomads - Webflow Pricing Reference
PageSpeed Matters - WordPress vs Webflow vs Squarespace Speed
Onward Craft - Contractor Website Study
PipelineOn - Contractor Website Conversion Rates
Siana Marketing - Website Redesign ROI Statistics
GetX Media - 2026 Roofing Marketing Benchmarks
CallJolt - Roofing Industry Statistics 2026
Roofing Contractor - The Homeowner's Roofing Journey in 2026