Table of contents
Roofing demand does not arrive evenly. Call volume spikes 5-10x in the 72 hours after a hailstorm, and appointment rates run 210% above baseline for 30 days afterwards. Technical SEO debt is invisible for eleven months and then bills you in one week. Here is the 2026 data.
Key Takeaways
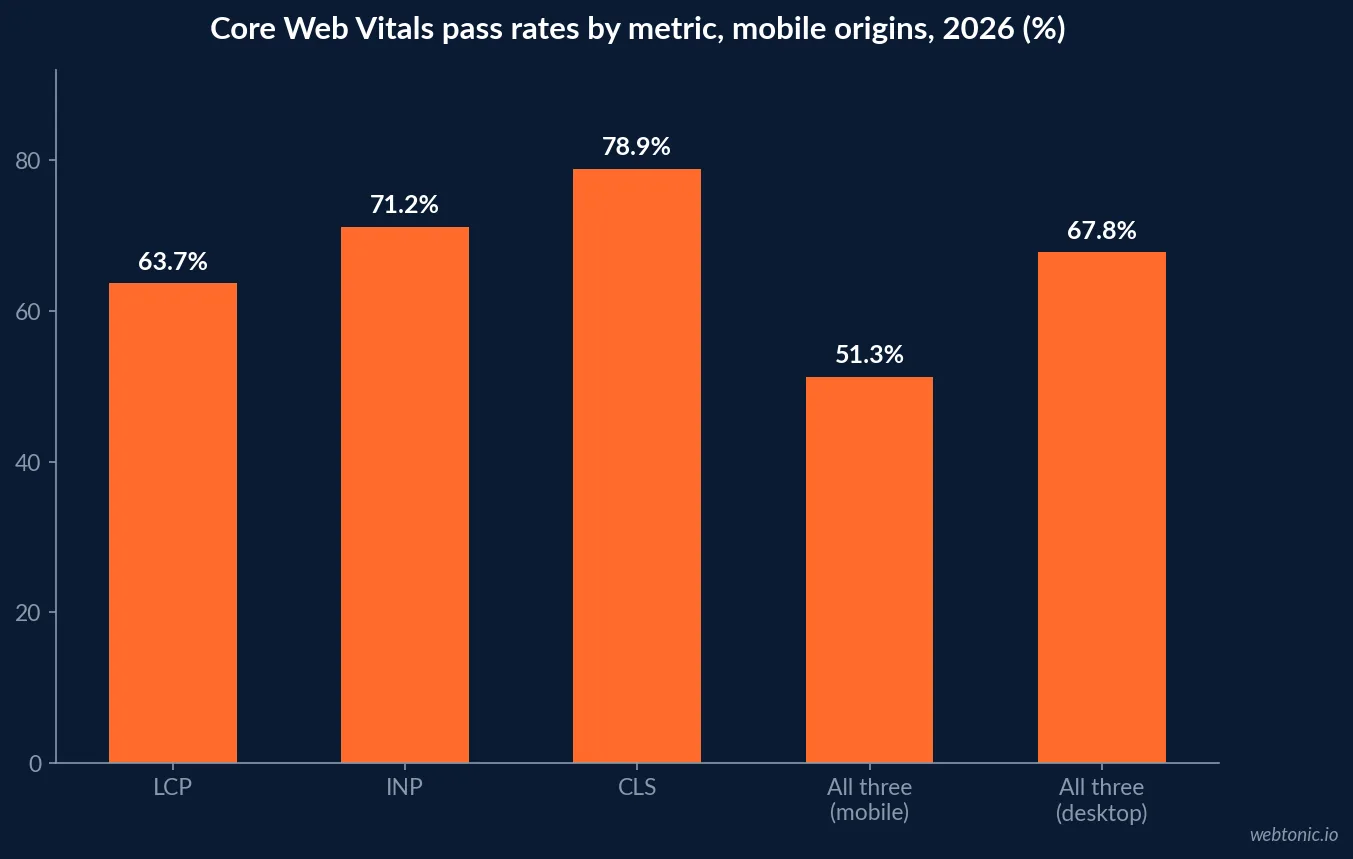
- Only 51.3% of origins pass all three Core Web Vitals on mobile (67.8% desktop) as of June 2026.
- WordPress origins pass 47.3% of the time - below the web average, and WordPress runs most contractor sites.
- LCP is the hardest metric at 63.7%, versus 71.2% for INP and 78.9% for CLS.
- Passing all three vitals is associated with roughly 24% lower bounce rates.
- The average contractor site loads in 5-8 seconds on mobile; strong builds run 1.5-2.5 seconds.
- Bounce probability rises 32% at three seconds and 90% at five seconds.
- Median load time of a top-ten result is 1.65 seconds; position one averages 1.4 seconds.
- 65-75% of home-services traffic is mobile, and above 80% on emergency-style searches - which is what a leaking roof is.
- Average contractor site conversion is 2-3%; well-built sites reach 8-12%.
- Mobile click-to-call runs 3-5% average and 10-15% on optimised sites.
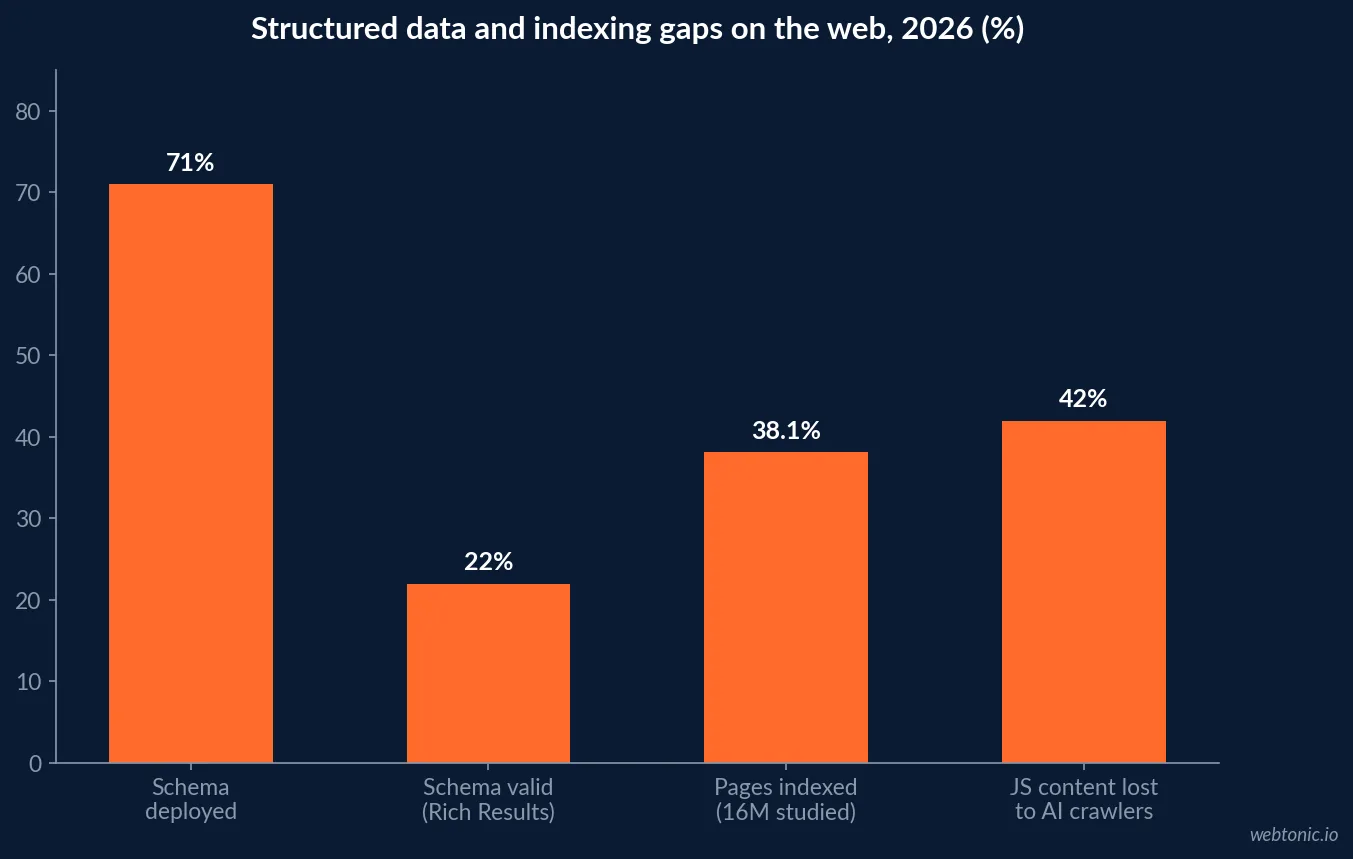
- Across 16 million pages studied, 61.94% were not indexed by Google.
- 26% of pages on enterprise sites go unindexed against 4% on small sites.
- 71% of sites deploy schema but only 22% pass the Rich Results Test cleanly.
- FAQ schema shows the largest CTR lift at about +87%, How-To at +52%.
- 42% of JavaScript-rendered content is never indexed by AI systems.
- Roofing pays $14.66 per search click and $313 per Google Ads lead - the price tag on every technical leak.
- A missed roofing call is worth $8,000-$15,000, and the median job is $13,400.
Roofing technical SEO benchmarks at a glance
The table below is the measuring stick. Web-wide figures come from Core Web Vitals origin data and a 2026 technical SEO statistics compilation; the contractor figures come from contractor site speed research.
| Metric | Web / contractor benchmark | Roofing target | Why it bites in roofing |
|---|---|---|---|
| Mobile CWV pass rate | 51.3% of origins | Pass all three | Storm traffic is 80%+ mobile |
| Mobile load time | 5-8s average contractor | 1.5-2.5s | 5-10x call spike in 72h |
| LCP pass rate | 63.7% mobile | Under 2.5s | Hero drone imagery is the usual culprit |
| INP pass rate | 71.2% mobile | Under 200ms | Quote forms and chat widgets |
| CLS pass rate | 78.9% mobile | Under 0.1 | Late-loading review badges shift the CTA |
| Site conversion | 2-3% contractor average | 8-12% | $313 per lead makes 1 point worth thousands |
| Mobile click-to-call | 3-5% average | 10-15% | 56% of roofing homeowners prefer phone |
| Indexed page share | 38% indexed of 16M studied | Above 80% | Location templates bloat the index |
| Valid schema | 22% of sites pass cleanly | 100% of key types | Review and FAQ rich results |
Speed is a storm-capacity problem, not a score
Most speed advice treats page weight as a ranking input. In roofing it is a capacity input. Post-storm call volume spikes 5-10x, 3.4 contractors get contacted per homeowner and the first responder books 62% of the time, so the fraction of a surge your site can absorb without stalling is revenue, not a score in a dashboard.
The gap is wide. The average contractor site loads in 5-8 seconds on mobile while the median top-ten result loads in 1.65 seconds. Bounce probability climbs 32% at three seconds and 90% at five. Against a $14.66 roofing search click, a four-second page is not a technical footnote - it is the most expensive line item nobody reports on.
| Mobile load time | Relative bounce probability | Where most roofing sites sit | Effect on a 1,000-visit storm day |
|---|---|---|---|
| 1 second | Baseline | Top decile builds | Full capture |
| 2 seconds | +9% | Well-built Webflow or headless | About 90 extra sessions retained |
| 3 seconds | +32% | Better-than-average WordPress | About 320 sessions at risk |
| 4 seconds | +60% range | Typical contractor template | Roughly half the surge leaking |
| 5 seconds | +90% | Image-heavy roofing themes | Most of the storm week wasted |
The composition of the problem is predictable in this trade: full-resolution drone and aerial photography, a hero video, three review widgets, a chat bubble and a financing calculator. LCP fails first, which matches the web-wide picture where LCP passes only 63.7% of the time on mobile. Our roofing landing page benchmarks cover the conversion side of the same page.
Indexing: the location-page tax
Roofing SEO has one dominant content pattern - the city page - and it is also the dominant source of crawl waste. Across 16 million pages analysed, 61.94% were not indexed by Google, and the split by site size is stark: 26% of pages on enterprise-scale sites go unindexed against 4% on small sites. A roofer who publishes 80 near-identical suburb pages is buying the enterprise problem without the enterprise authority. Crawl waste research and aggregate technical issue data both put duplication and thin templates at the top of the list.
| Index issue | Typical share of a roofing site | Root cause | Fix |
|---|---|---|---|
| Crawled, currently not indexed | 20-40% of location pages | Template text with a swapped city name | Consolidate; add jobs, photos and permits |
| Discovered, not crawled | 5-15% | Weak internal linking to deep pages | Link city pages from a real service hub |
| Duplicate without canonical | 5-10% | Service x city matrix overlap | Canonical to the strongest page |
| Soft 404 | 2-8% | Empty gallery or blog tag pages | Noindex or remove |
| Blocked by robots | 1-5% | Staging rules copied to production | Audit robots on every relaunch |
The practical rule for a roofing site: a location page earns its index slot when it contains something that could only be written about that city - a specific storm date, a permit requirement, a named neighbourhood, real job photos. Everything else should be a section on a stronger page. The local SEO data for roofing shows where that proof actually moves rankings.
Schema: deployed everywhere, valid almost nowhere
A 5,000-site schema audit found 71% of sites deploy structured data while only 22% pass the Rich Results Test cleanly. The measured CTR lift is real - +87% for FAQ markup and +52% for How-To - which means most roofers are paying the implementation cost and collecting none of the return.
| Schema type | Roofing use | Measured or expected impact | Common error |
|---|---|---|---|
| LocalBusiness / RoofingContractor | NAP, hours, service area | Eligibility for local panels | Service area left undefined |
| Service | Replacement, repair, storm restoration | Better entity matching | One generic Service node |
| FAQPage | Insurance, inspection, warranty questions | About +87% CTR lift | Answers hidden behind JS |
| Review / AggregateRating | Review count and score | Star eligibility | Self-serving ratings |
| ImageObject | Job photo galleries | Image search visibility | No captions or geo data |
The review node deserves attention in this trade specifically. The benchmark roofing profile now carries 200+ reviews at a 4.9 average while the median company sits at 51-100, so marking up an accurate count is a differentiator rather than decoration.
The AI-crawler layer changes what "rendered" means
Homeowners increasingly open an assistant before a search engine, and assistants read HTML, not JavaScript. Crawler rendering research and AI crawler traffic data converge on the same conclusion: 42% of JavaScript-rendered content is never indexed by AI systems.
For a roofing site that usually means the exact facts a homeowner asks about are missing from the machine view: the review widget, the financing table, the "areas we serve" accordion and the warranty terms are all typically injected client-side. Server-render them. Then check what the crawlers actually take: crawl-to-refer ratio data shows AI bots consume far more than they send back, so serving them cheap, clean HTML is also a hosting-cost decision.
Mobile and the click-to-call gap
Between 65% and 75% of home-services traffic is mobile, and emergency-style searches exceed 80%. A roof leak during a storm is the definition of an emergency search. Yet average contractor conversion sits at 2-3% against 8-12% for well-built sites, and mobile click-to-call runs 3-5% against 10-15% on optimised ones. With 56% of roofing homeowners preferring phone contact and each missed call worth $8,000-$15,000, the tap target is the highest-value element on the page.
| Mobile element | Average contractor site | Optimised roofing site | Delta on 1,000 mobile visits |
|---|---|---|---|
| Sticky call button | Absent or below fold | Persistent, thumb-zone | +50-100 calls |
| Form fields | 8-12 | 3-4 plus photo upload | +2-4 points of conversion |
| Hero image weight | 1.5-4 MB | Under 200 KB WebP | 1-3s of LCP |
| Inspection booking | Contact form only | Slot picker | 74% of homeowners require an inspection |
| Financing visibility | Buried | On the estimate CTA | 65% more likely to call when pricing shows |
A 60-day roofing technical SEO plan
Sequenced by return per hour, using the benchmarks above as acceptance criteria. Pair it with the wider roofing SEO benchmarks so the technical work has content to carry.
| Window | Work | Acceptance criterion | Expected effect |
|---|---|---|---|
| Days 1-10 | Image pipeline: WebP, responsive sizes, lazy-load below fold | LCP under 2.5s on 4G | Largest single speed gain |
| Days 11-20 | Third-party audit: chat, review, tag scripts | INP under 200ms | Fixes most INP failures |
| Days 21-30 | Index audit: consolidate thin location pages, canonicals | Indexed share above 80% | Crawl budget to pages that convert |
| Days 31-40 | Schema rebuild: LocalBusiness, Service, FAQ, Review | Rich Results Test clean | Up to +87% CTR on FAQ pages |
| Days 41-50 | Server-render service areas, reviews, pricing | Facts visible in raw HTML | Recovers the 42% AI blind spot |
| Days 51-60 | Mobile call path: sticky CTA, short forms, slot picker | Click-to-call above 10% | Directly moves booked jobs |
What a roofing site should never ship
- An autoplaying hero video above a 4G-visible fold - it is the most common LCP failure in the trade.
- Sixty suburb pages generated from one paragraph; 61.94% of pages studied went unindexed and templates are the reason.
- Reviews and service areas injected client-side, invisible to the 42% of AI indexing that never runs JavaScript.
- Schema copied from a competitor with their rating still in it - part of why only 22% of deployments validate.
- A phone number rendered as an image, on a channel where 56% of homeowners prefer phone.
- A relaunch without a redirect map, during storm season, at $313 per lead.
How roofing compares with the rest of home services
Roofing is not technically worse than plumbing or HVAC. It is exposed differently: seasonal traffic concentration, heavier media, and the highest lead cost in the trades at $313 per Google Ads lead, per 2026 roofing marketing benchmarks and roofing industry statistics. That combination means the same one-second delay costs a roofer several times what it costs a neighbouring trade. If you want the paid-side comparison, see the roofing Google Ads benchmarks, and for measurement plumbing, data intelligence.
Frequently Asked Questions
What is a good page speed for a roofing website?
Aim for 1.5 to 2.5 seconds on mobile. The average contractor site loads in 5 to 8 seconds, and bounce probability rises 32% at three seconds and 90% at five seconds against a one-second baseline. The median load time of a top-ten Google result is 1.65 seconds, and position one averages 1.4 seconds. For roofing the stakes are unusual because post-storm traffic spikes 5 to 10 times normal volume, so the slow page is slowest precisely in the week that decides the quarter.
How many roofing sites pass Core Web Vitals?
Only 51.3% of all origins pass all three Core Web Vitals on mobile as of June 2026, against 67.8% on desktop. WordPress origins, which dominate contractor websites, pass 47.3% of the time. Largest Contentful Paint is the hardest metric at a 63.7% pass rate, ahead of Interaction to Next Paint at 71.2% and Cumulative Layout Shift at 78.9%. Sites passing all three show roughly 24% lower bounce rates.
Does schema markup matter for roofing companies?
It is one of the cheapest wins left. Across a 5,000-site audit, 71% of sites deploy schema but only 22% pass the Rich Results Test cleanly, so most markup is present and broken. FAQ schema carries the largest measured click-through lift at about 87%, ahead of How-To at 52%. For a roofer the high-value types are LocalBusiness with service-area definitions, Service for each roof type, FAQPage on inspection and insurance questions, and Review markup - the review count matters because the benchmark roofing profile now carries 200+ reviews at 4.9.
Why are roofing pages not getting indexed?
Volume and duplication. Across 16 million pages studied, 61.94% were not indexed by Google, and 26% of pages on enterprise-scale sites go unindexed against 4% on small sites. Roofing sites earn that problem through location page templates: 60 city pages built from one paragraph of swapped text is the single most common source of crawl waste in the trade. Consolidate to pages with genuine local proof - jobs, photos, permits, reviews - and let the rest redirect.
Does technical SEO affect AI search visibility for roofers?
Directly. Roughly 42% of JavaScript-rendered content is never indexed by AI systems because most AI crawlers do not execute JavaScript, so a review widget or service list injected client-side is invisible to the assistants homeowners increasingly ask first. Server-render the facts that matter - service areas, pricing ranges, warranty terms, review counts - and keep them in the raw HTML.
Sources
State of Core Web Vitals 2026
Technical SEO Statistics 2026
Core Web Vitals Statistics 2026
Contractor Website Speed Optimization
Crawl Waste Report 2026
2026 Technical SEO Issues Aggregate
Schema Markup Adoption Audit
AI Crawlers and JavaScript Rendering
AI Crawler Bot Traffic Statistics
Crawl-to-Refer Ratio for LLM Bots
Roofing Marketing Benchmarks 2026
Roofing Industry Statistics 2026