



Table of contents

Real estate ABM does not mean marketing to homebuyers - it means building named-account programs for institutional investors, property management firms and portfolio owners, priced against cross-industry B2B benchmarks because no study prices ABM by property type. This page pairs those B2B figures with real trade-side account counts so the budget conversation starts from something real.
Key Takeaways
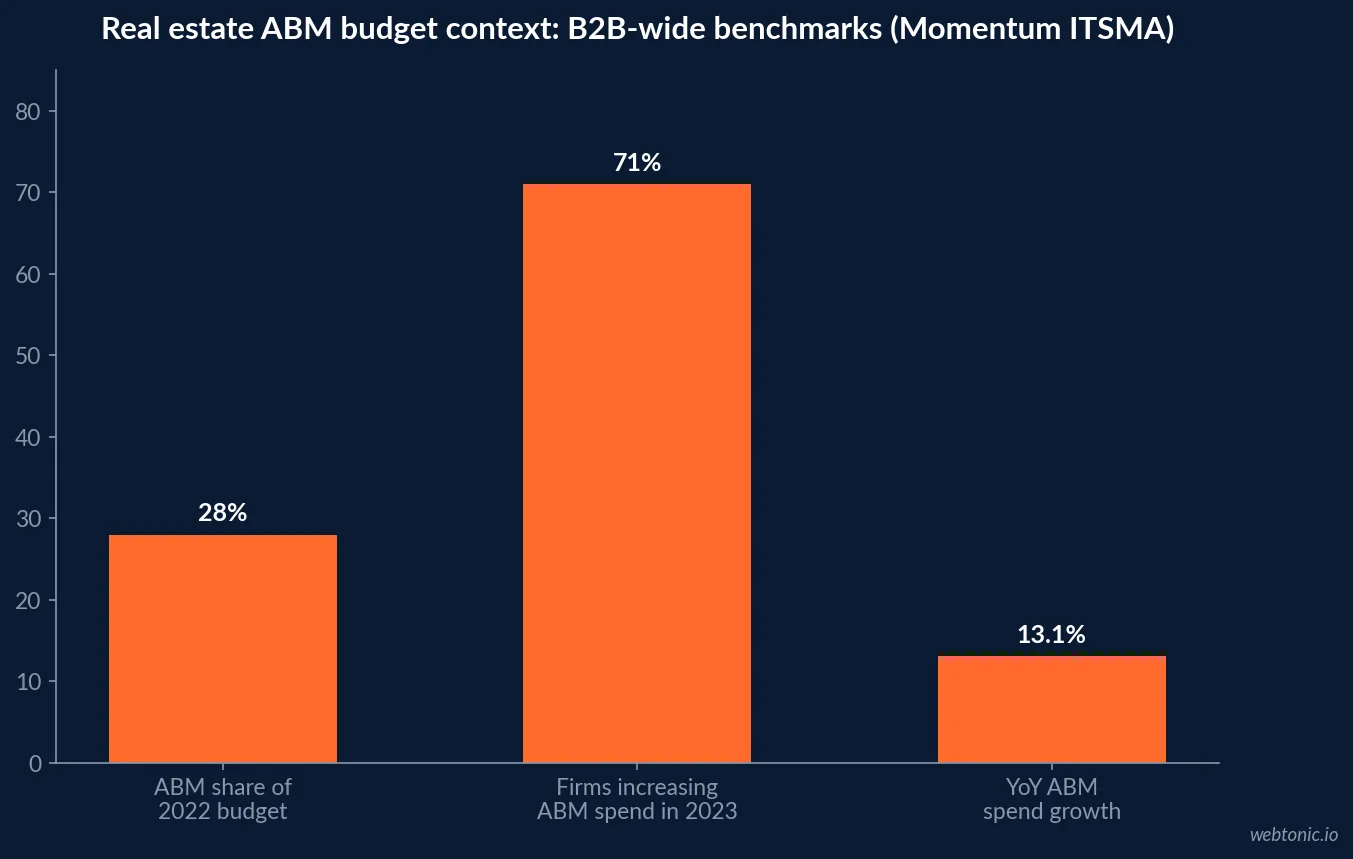
- 28% of the 2022 marketing budget went to ABM, per Momentum ITSMA's benchmarking study.
- 71% of companies planned to increase ABM spend in 2023, up 13.1% year on year.
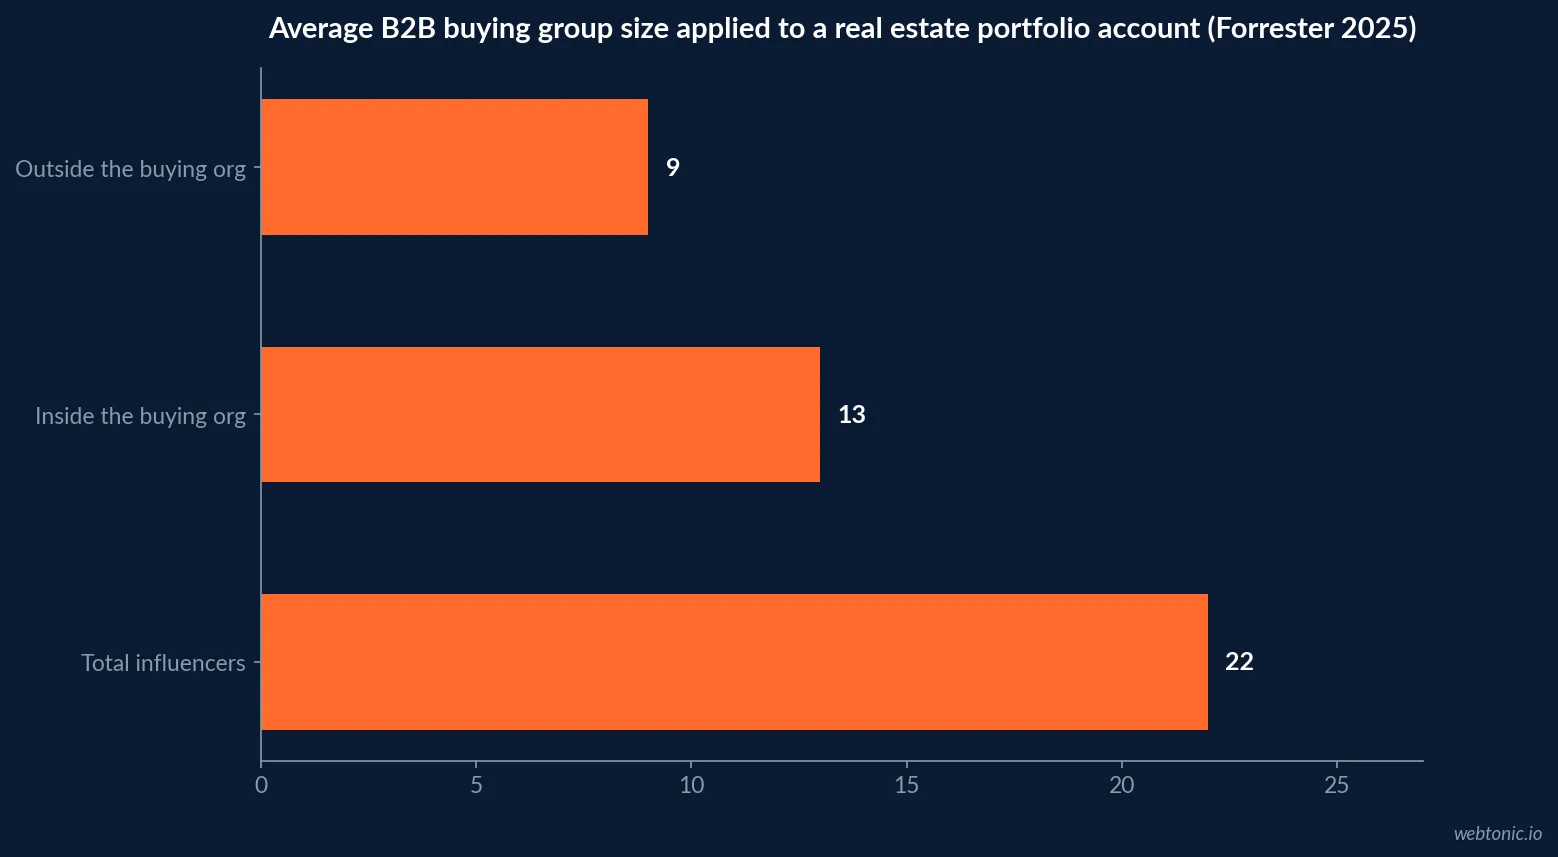
- 13 people sit inside the average B2B buying group, plus 9 more from outside it (Forrester 2025).
- 73% of B2B purchases involve three or more departments (Forrester 2025).
- 62% of ABM practitioners use their CRM to run ABM; 52% use a Marketing Automation Platform (ABM Leadership Alliance 2025).
- 37% of ABM practitioners report using AI tools in their program (same 2025 survey).
- 34% run programmatic ABM (1:many) against 22% running strategic/large-account ABM (1:1).
- 58.7% win rate for accounts using four advertising products, a 71% lift over accounts using none (Demandbase, 1,452 platform instances).
- Nearly $2.1 trillion in U.S. real estate assets are managed by IREM-certified property managers.
- 11.6 million residential units and 12 billion square feet of commercial space sit under IREM CPM management.
- 18,112 total IREM memberships as of January 2024, the target universe for a property-manager account list.
- 851,000 franchise establishments is not this page's universe - see the companion franchise ABM page for that account count.
- 40% of surveyed firms have integrated demand gen and ABM into one process (ABM Leadership Alliance 2025).
| Metric | Figure | Source | Real estate read |
|---|---|---|---|
| ABM share of marketing budget | 28%-30% | Momentum ITSMA / ABM Leadership Alliance | Budget baseline for a property-marketing team |
| Buying group size | 13 inside + 9 outside = 22 | Forrester Buyers' Journey Survey 2025 | Multi-stakeholder portfolio deals sit above this |
| Purchases with 3+ departments | 73% | Forrester 2025 | Property, finance, legal and facilities all weigh in |
| ABM win-rate lift (4 ad products) | 58.7% vs 34.3% baseline (71% lift) | Demandbase, 1,452 platform instances | Directional only - one vendor's customer base |
| Property manager account universe | 18,112 IREM memberships, $2.1T managed | IREM Fact Sheet, Jan 2024 | The real target list for a property-marketing ABM program |
Who a real estate ABM program actually targets
An account-based program in real estate names accounts the way any B2B ABM program does: institutional investors and REITs, private equity real estate funds, property management companies overseeing multi-asset portfolios, and corporate real estate teams sourcing space for their own employers. None of those accounts are individual homebuyers, and treating consumer real estate marketing as ABM misreads the term entirely.
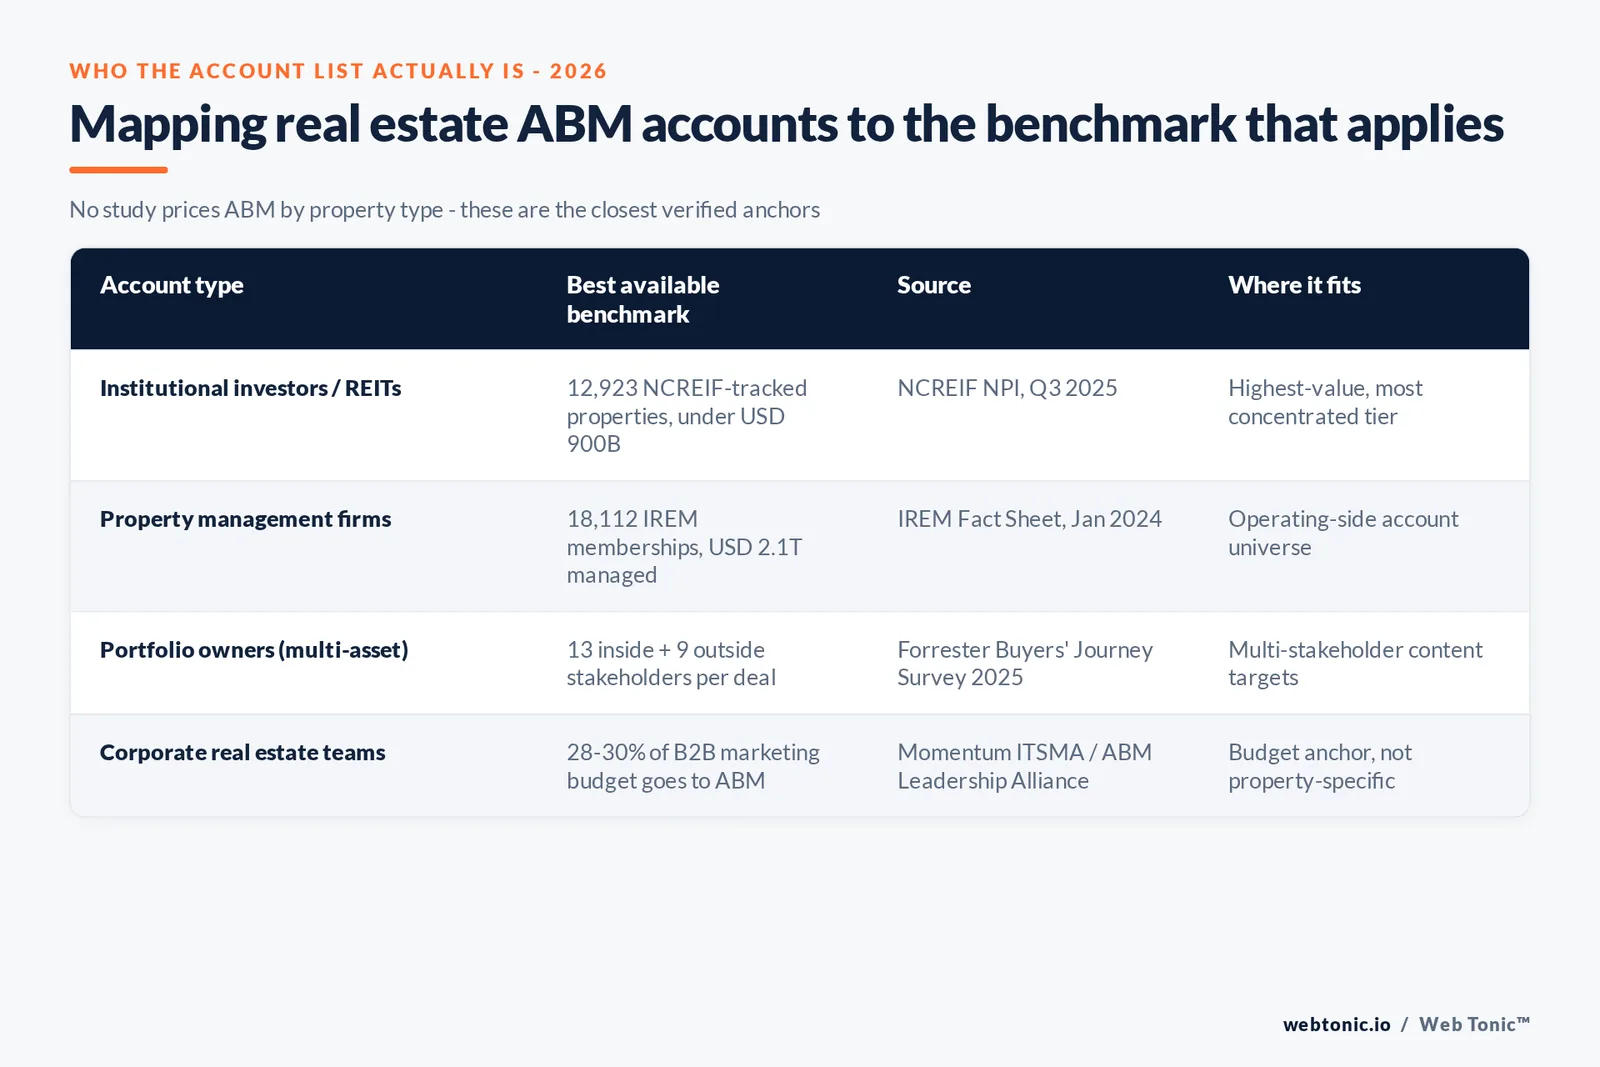
IREM's own fact sheet puts a number on that universe: 18,112 total memberships as of January 2024, with U.S. Certified Property Managers overseeing nearly $2.1 trillion in assets, 11.6 million residential units and 12 billion square feet of commercial space. That is the addressable account list a real estate ABM program is actually built against.
How much of the budget ABM should claim
Momentum ITSMA's annual ABM benchmarking study found 28% of the 2022 marketing budget dedicated to ABM, with 71% of companies planning to increase ABM spend in 2023, a jump of 13.1% year on year. A later ITSMA / ABM Leadership Alliance report continues that annual benchmark series. Neither study segments by real estate, so treat the roughly 28%-30% range as the B2B-wide anchor and adjust down for a smaller, concentrated account list - a real estate ABM program targeting a few dozen institutional portfolio owners needs less media spend than a demand-gen program aimed at a broad market.
| ABM budget benchmark | Figure | Year | Source |
|---|---|---|---|
| Share of marketing budget on ABM | 28% | 2022 | Momentum ITSMA |
| Companies increasing ABM spend | 71% | Planned for 2023 | Momentum ITSMA |
| Year-on-year ABM spend growth | 13.1% | 2022 to 2023 | Momentum ITSMA |
| Firms integrating demand gen + ABM | 40% | 2025 | ABM Leadership Alliance |
| Firms prioritizing traditional demand gen over ABM | 37% | 2025 | ABM Leadership Alliance |
The buying committee behind a real estate account
Forrester's Buyers' Journey Survey, 2025 found 73% of B2B purchases involve three or more departments, with an average of 13 people inside the buying organization and nine more from outside it weighing in on the decision - 22 influencers in total. For a portfolio-wide property management contract or a multi-site vendor deal, that committee plausibly includes asset managers, facilities leads, finance, legal and, on the tenant side, procurement - which is the case for building content and outreach for more than one job title per account, not one decision-maker.
| Stakeholder group | Average count | Share of purchases involving 3+ departments | Source |
|---|---|---|---|
| Inside the buying organization | 13 people | 73% | Forrester Buyers' Journey Survey 2025 |
| Outside the buying organization (advisors, colleagues) | 9 people | 73% | Forrester Buyers' Journey Survey 2025 |
| Total influencers on a typical purchase | 22 people | 73% | Forrester Buyers' Journey Survey 2025 |
What the ABM tooling actually costs
ABM platform vendors mostly do not publish list prices, which the pages themselves confirm. Demandbase's own pricing page states plainly that a plan is customized after a form submission: the pricing model features a platform fee plus a flat per-user fee, with no dollar figures or tiers disclosed - the model is public, the number is not.
For a property-marketing team, that means budgeting a seat-based range and confirming the account-list size (how many named institutional accounts you are targeting) before a vendor quote, since neither platform prices by property count or portfolio size.
| Vendor | Published pricing detail | What is NOT published | Source |
|---|---|---|---|
| Demandbase | Platform fee + flat per-user fee (model only) | Actual dollar figures, tiers | Demandbase pricing page (verified directly) |
| RollWorks (AdRoll ABM) | Dynamic CPM-based media pricing, no platform minimum for retargeting | ABM/advertising tier dollar amounts | RollWorks pricing FAQ (via tracker review) |
The only named win-rate study, and its limits
The single recent ABM performance study with a stated sample is Demandbase's own 2026 benchmark set, built from 1,452 instances of its platform: accounts engaged with four advertising products saw a 58.7% win rate, a 71% lift over accounts using none, and companies tracking 3-4 buying groups per product saw a 48.5% higher win rate than those taking a broader, less structured approach. That is one vendor's own customer base, not an independent study, and it says nothing about real estate specifically - cite it as evidence that multi-channel, multi-stakeholder engagement correlates with better outcomes, not as a promised lift for a property-marketing account list.
| Demandbase 2026 benchmark (own platform data) | Figure | Sample | Caveat |
|---|---|---|---|
| Win rate, 4 advertising products used | 58.7% | 1,452 platform instances | Vendor's own customer base |
| Win rate lift vs. 0 products used | 71% | Same sample | Correlation, not a real estate finding |
| Win-rate lift, 3-4 buying groups tracked per product | 48.5% | Same sample | Vs. a broader, less structured approach |
| MQA-to-pipeline conversion (higher end) | 22%+ | Same sample | Not segmented by industry |
What ABM tech stacks actually look like today
The ABM Leadership Alliance's 2025 benchmark survey found 62% of ABM practitioners using their CRM to run the program and 52% using a Marketing Automation Platform, with 37% reporting they now use AI tools inside their ABM process - a new category the survey added for 2025. Only 22% report a dedicated ABM platform fully integrated into their stack, while 34% practice programmatic (1:many) ABM against 22% running strategic 1:1 large-account programs.
For a real estate marketing team with a shortlist of 20-50 institutional accounts, that split argues for a CRM-plus-MAP foundation before a dedicated ABM platform purchase - the tooling most practitioners already run supports a 1:1 or small 1:many program without a new six-figure contract.
How big the institutional side of the account list actually is
The NCREIF Property Index tracked 12,923 properties worth under USD 900 billion in institutional-quality real estate as of Q3 2025, held by the pension funds, insurers and open-end funds that make up NCREIF's own membership. That is a materially smaller, more identifiable universe than the broader residential market - and it is the account tier a real estate ABM program built around institutional capital should actually be sized against, rather than the full 18,000-plus IREM property-manager count used for the operating side of the account list.
| Tool category | Share of ABM practitioners using it | Program type it best supports | Source |
|---|---|---|---|
| CRM (existing stack) | 62% | 1:1 or small 1:many programs | ABM Leadership Alliance 2025 |
| Marketing Automation Platform | 52% | 1:many programmatic ABM | ABM Leadership Alliance 2025 |
| Dedicated ABM platform | 22% | Large, multi-account programmatic ABM | ABM Leadership Alliance 2025 |
| AI tools inside the ABM process | 37% | Account scoring, content personalization | ABM Leadership Alliance 2025 |
Building a real estate ABM account list
- Start from the trade-side universe - IREM's roughly 18,000 certified property managers, REIT investor-relations lists, and known private-equity real estate funds - not a generic B2B contact database.
- Budget in the 28%-30% of marketing spend range as a B2B anchor, then scale down for a shorter, more concentrated account list than a mass-market program would need.
- Map content to the 13-inside, 9-outside buying group Forrester describes: asset management, finance, facilities and legal all need a reason to engage, not just the single relationship-holder contact.
- Confirm ABM tooling cost against the account list size before signing - Terminus and Demandbase both price on a per-seat or per-platform-fee model, not per property.
- Treat vendor win-rate studies (Demandbase's 58.7%/71% figures) as directional evidence for multi-channel engagement, not a real-estate-specific promise.
See the wider category benchmarks on our account-based marketing statistics hub, and for the outbound-channel side of B2B real estate prospecting, our data and analytics practice can help size and score an institutional account list before the first campaign launches. Talk to us about building one.
Frequently Asked Questions
What does account-based marketing mean in real estate?
It means targeting named commercial accounts, not individual homebuyers: institutional investors, REITs, private equity real estate funds, property management companies and portfolio owners who control multiple assets. There is no real-estate-specific ABM benchmark study, so this page pairs cross-industry B2B ABM data (ITSMA, Forrester, the ABM Leadership Alliance) with real trade-side account counts from IREM, which certifies U.S. property managers overseeing nearly $2.1 trillion in assets.
How much of a B2B marketing budget goes to ABM?
Momentum ITSMA's benchmarking study found 28% of the 2022 marketing budget dedicated to ABM, with 71% of companies planning to increase ABM spend the following year, up 13.1% year on year. A later ITSMA/ABM Leadership Alliance report puts the 2023 figure at roughly 30% of marketing budget. Neither study is real-estate-specific - apply the range to your marketing budget, not to deal volume.
How big is the buying group behind a real estate ABM account?
Forrester's 2025 Buyers' Journey Survey found 73% of B2B purchases involve three or more departments, with an average of 13 people inside the buying organization and nine more from outside it weighing in - 22 total influencers on a typical purchase. A property management contract or a portfolio-wide vendor deal will usually sit at or above that average, given how many stakeholders (asset managers, facilities, finance, legal) touch a multi-property agreement.
What does ABM tooling cost for a real estate marketing team?
Vendors do not publish list prices, but Demandbase's own pricing page shows the shape of the cost: a plan is customized after a form submission, with a platform fee plus a flat per-user fee and no dollar figures or tiers disclosed - meaning any quote needs to be negotiated against your actual account list size, not assumed from a competitor's number.
Does ABM improve win rates for real estate accounts?
The only recent named study with a stated sample is Demandbase's own 2026 benchmark set, built from 1,452 instances of its platform: accounts using four advertising products saw a 58.7% win rate, a 71% lift over accounts using none. That is one vendor's own customer base, not an independent study, and it is not real-estate-specific - cite it as directional evidence that multi-channel account engagement correlates with higher win rates, not as a guaranteed real estate result.
Sources
Momentum ITSMA & ABM Leadership Alliance - Elevating ABM: Building Blocks for Long-Term Growth (2022 Benchmark Study PDF)
ABM Leadership Alliance - Research reports
Demand Gen Report / ABM Leadership Alliance - 2025 Account-Based Marketing Benchmark Survey (PDF)
Forrester - Three Realities About B2B Buying Networks (Buyers' Journey Survey, 2025)
Demandbase - The state of ABM in 2026 (1,452 companies)
IREM - Fact Sheet, January 2024 (PDF)
NCREIF - NPI Press Release, Q3 2025 (PDF)


