Table of contents
1:1 account-based marketing wins 38% of opportunities in 2026, against a 9% win rate for the non-ABM B2B baseline - and the gap holds up across engagement, deal size, and sales-cycle length. This page collects the 2026 benchmark data B2B marketers need to size, staff, and defend an ABM program.
Key Takeaways
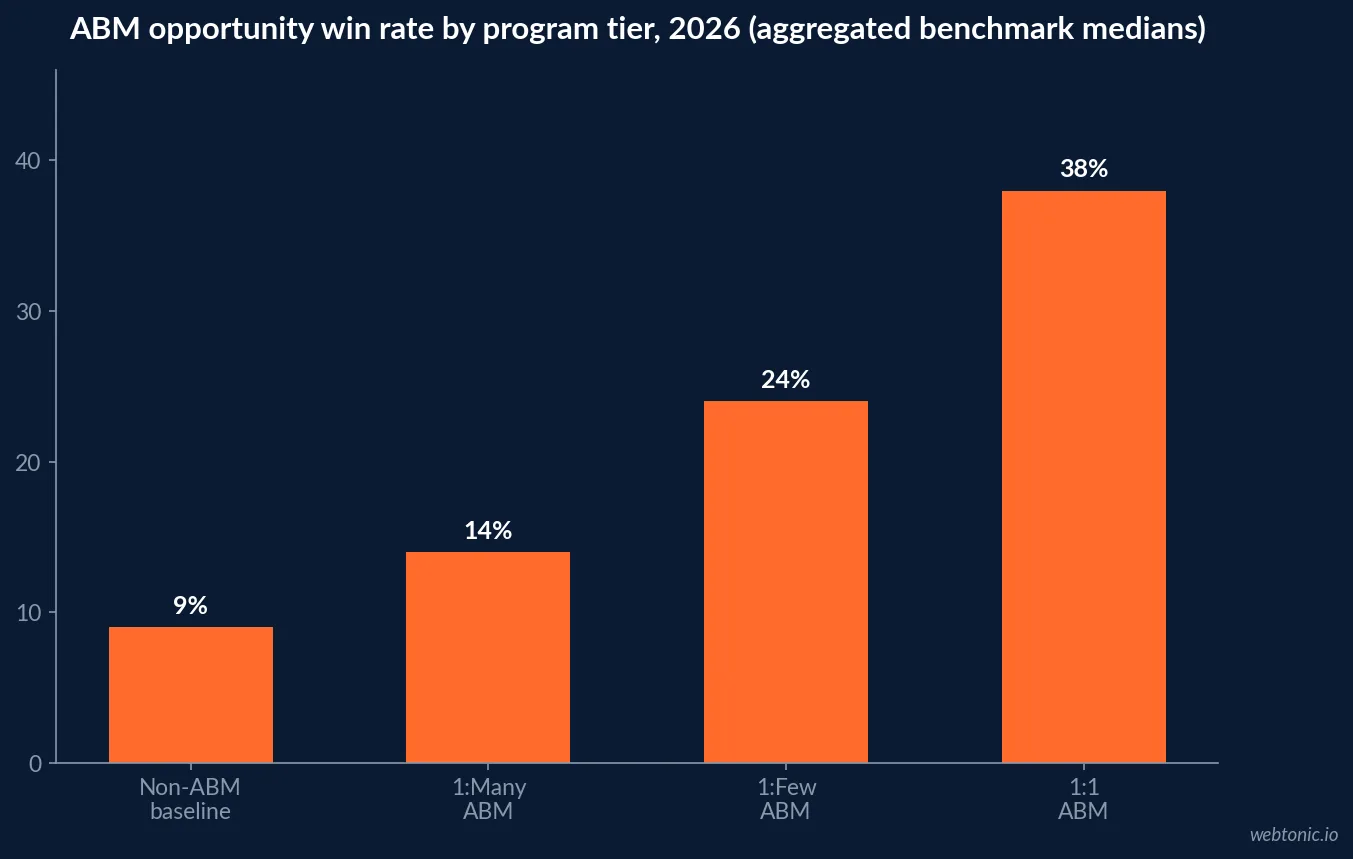
- 1:1 ABM wins 38% of opportunities, median, versus a 9% non-ABM baseline.
- 1:Few ABM wins 24% and 1:Many ABM wins 14% of opportunities.
- 1:1 ABM account engagement runs 78%, against 8-12% for non-ABM outreach.
- 89% of organizations reporting ABM ROI say ABM accounts beat a control group.
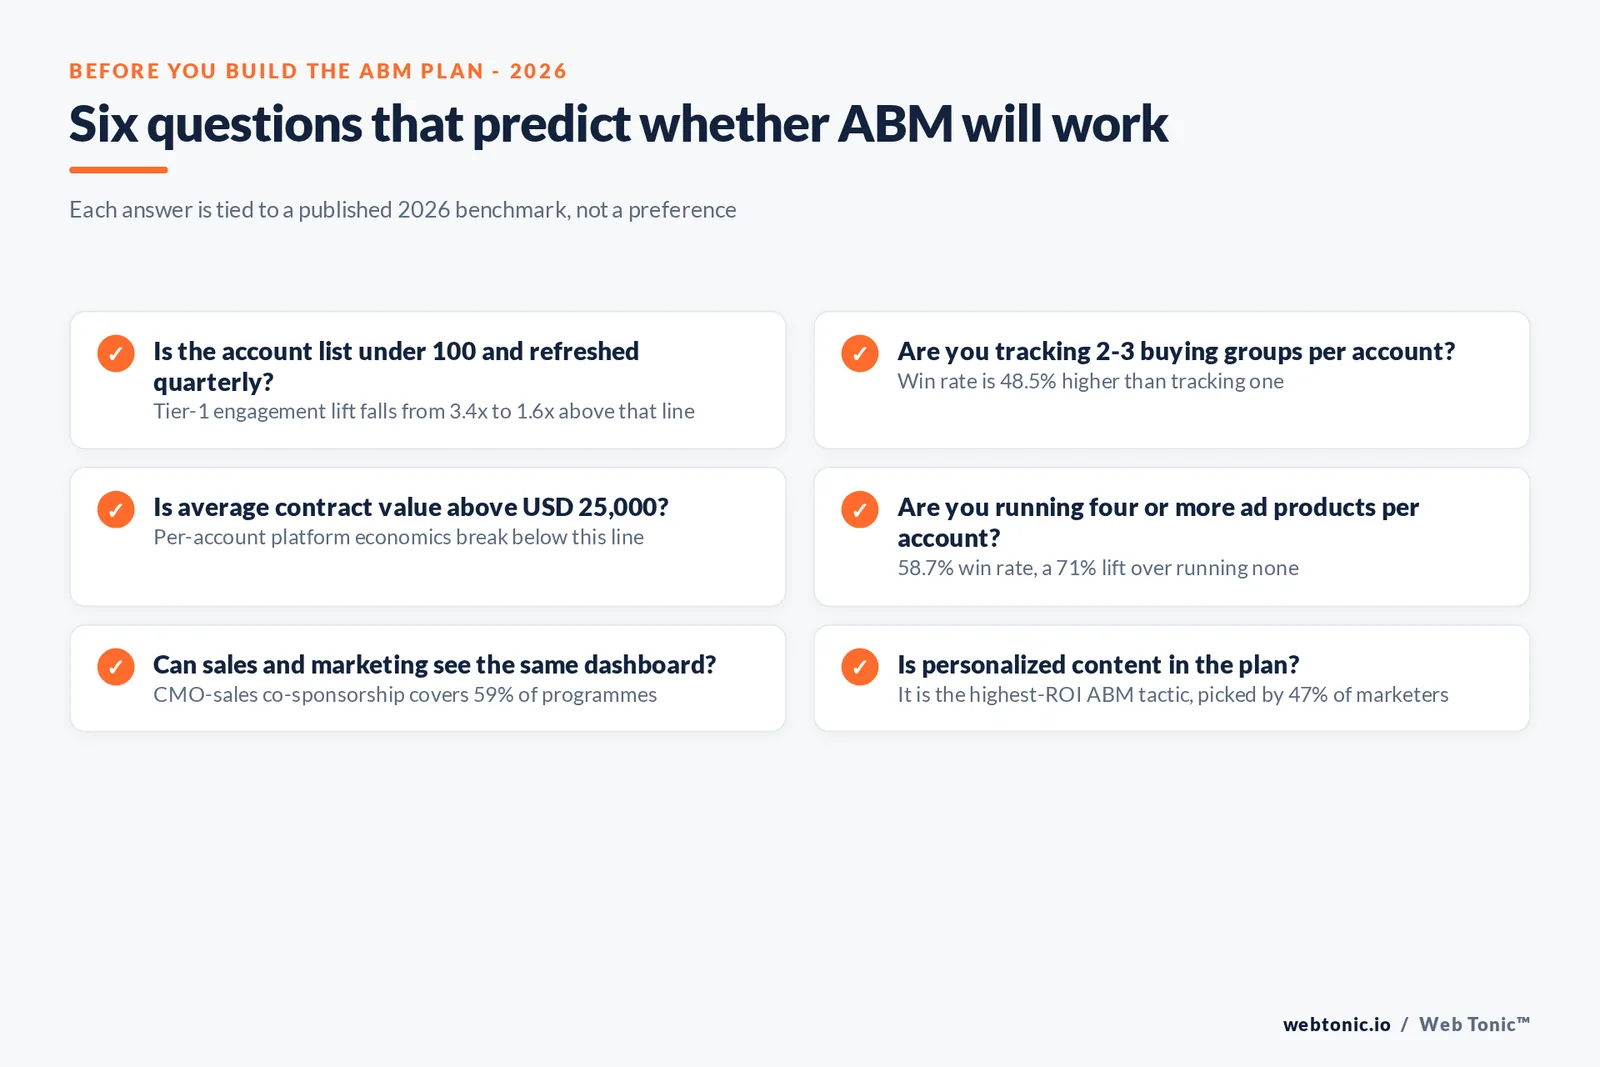
- Companies running four ad products per account win 58.7% of opportunities, a 71% lift over running none.
- Tracking 2-3 buying groups per account lifts win rate 48.5% over tracking one.
- Win rate peaks around 29% when a program focuses on 3 buying groups, falling to ~12% at 6.
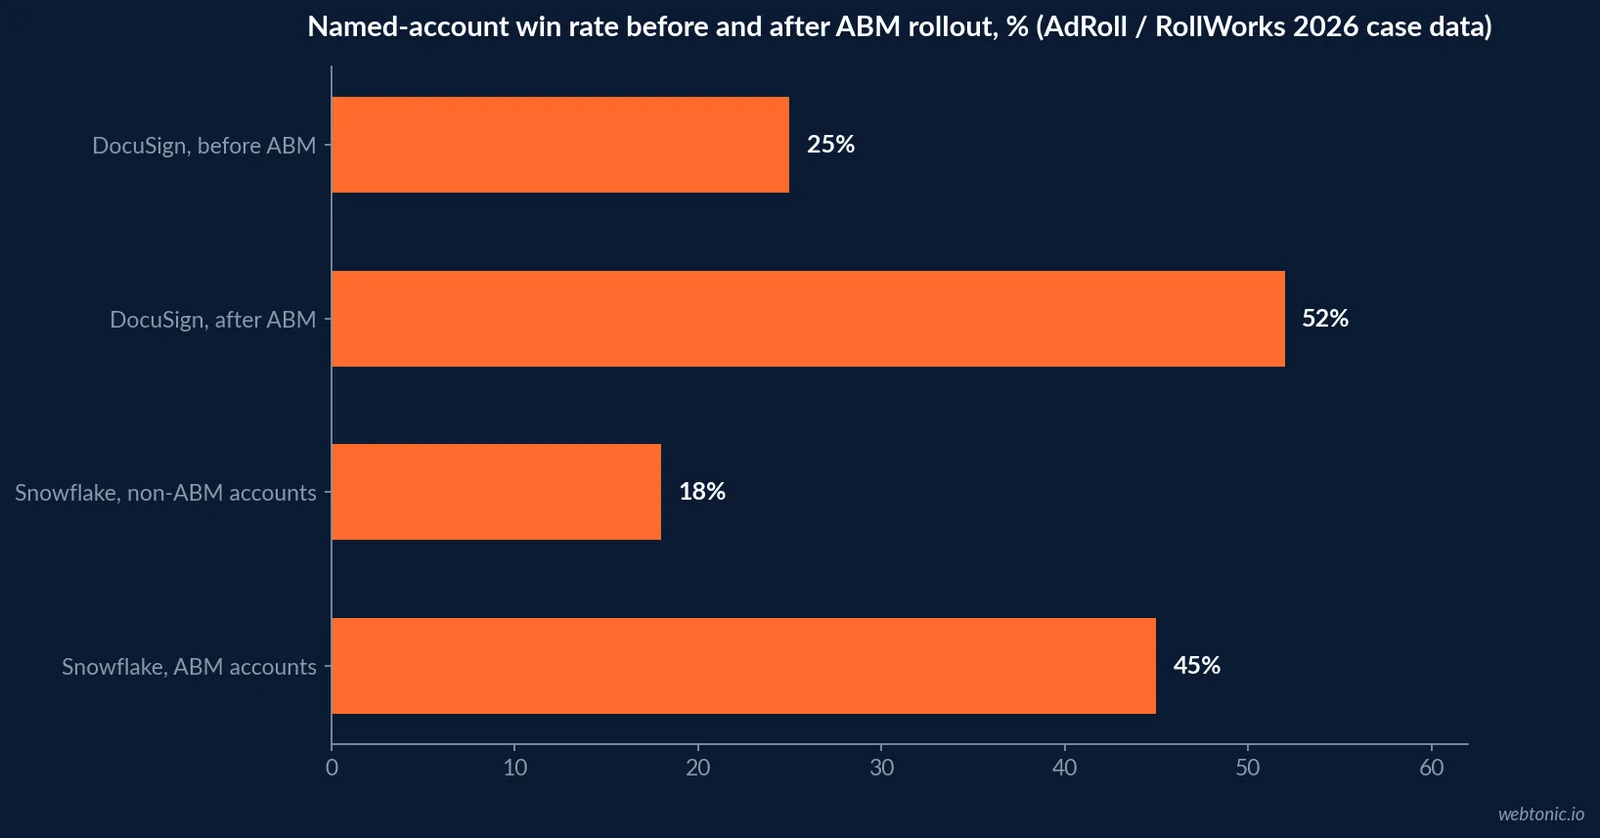
- Snowflake's ABM accounts won 45% of the time versus 18% for non-ABM accounts.
- DocuSign's enterprise win rate rose from 25% to 52% after its ABM rollout.
- Personalized content is the top-ROI ABM tactic, picked by 47% of marketers.
- Growing existing accounts is the top priority for 91% of ABM programmes.
- Strategic ABM is used by 88% of companies for their most important accounts.
- Median 6sense contract runs USD 58,617 a year; median Demandbase runs USD 65,981.
- A raw contact list matches roughly 30% of accounts to ad platforms before enrichment.
- Identity enrichment lifts that match rate to 70-99%.
- ABM-influenced deals close 32 days faster at the median, 58 days faster on $500K-plus deals.
- 74% of $50M-plus ARR companies now run an ABM platform.
ABM win rates by program tier
ABM programs are not one thing - the "1:1 / 1:Few / 1:Many" taxonomy still predicts outcomes even as real programs increasingly blend tiers. Benchmarks aggregated from Forrester, Gartner, Demandbase, 6sense, Terminus and the ITSMA/Momentum ABM Benchmark Study and normalized for 2026 (via Tomba's 2026 benchmark summary) show every ABM tier beating the non-ABM baseline by a wide margin.
| Metric | 1:1 ABM | 1:Few ABM | 1:Many ABM | Non-ABM baseline |
|---|---|---|---|---|
| Account engagement rate | 78% | 54% | 31% | 8-12% |
| MQA → Opportunity conversion | 32% | 24% | 18% | 6% |
| Opportunity → Closed-won win rate | 38% | 24% | 14% | 9% |
| Average contract value lift | +70% | +45% | +30% | baseline |
| Sales cycle length change | -32% | -22% | -10% | baseline |
What buying-group focus does to win rate
Demandbase Labs' inaugural State of ABM 2026 report analyzed 1,452 tenants, 429,634 advertising campaigns, 38 million marketing activities and 9.7 million sales interactions to isolate what actually moves ABM performance, and the answer is buying-group discipline more than budget. Tracking two to three buying groups per product lifts win rate 48.5% over tracking a single contact, and the optimal buying group size lands at 13-17 stakeholders. Win rate itself peaks around 29% at 3 buying groups and drops to roughly 12% once a team spreads attention across 6, per ContactLevel's 2026 ABM statistics roundup.
| Buying groups tracked per account | Reported opportunity win rate |
|---|---|
| 1 (single champion) | Baseline |
| 2-3 (focused) | ~29%, and 48.5% higher than tracking 1 |
| 6 (spread thin) | ~12% |
Advertising intensity and pipeline outcomes
The same Demandbase Labs dataset found a 58.7% win rate for companies running four advertising products against a given account, a 71% lift over companies running none, and 22%-plus MQA-to-pipeline conversion for organizations with a fully integrated CRM, MAP and predictive-model stack. Separately, list discipline on the account side compounds with ad intensity: Digital Applied's 2026 ABM benchmark set, sampled across 1,400-plus B2B teams, found tier-1 engagement runs 3.4x above non-ABM cohorts - but only while the tier-1 list stays under 100 accounts and refreshes quarterly. That lift collapses to 1.6x once the list exceeds 200 accounts and to 1.2x once refresh cadence drops below quarterly.
| Tier-1 list discipline | Engagement lift over non-ABM |
|---|---|
| Under 100 accounts, refreshed quarterly | 3.4x |
| 200-plus accounts | 1.6x |
| Refresh cadence slower than quarterly | 1.2x |
Deal size, sales cycle and pipeline velocity
Opportunity creation is also uneven by tier: 18% of tier-1 accounts convert to an opportunity, versus 7% of tier-2 and 3% of tier-3 - a roughly 6x spread between the top and bottom tier that Digital Applied's data calls the "silent failure mode" of programs that don't differentiate intensity by tier. Sales cycles compress a median of 32 days across ABM-influenced deals, and 58 days on deals above $500,000.
| Account tier | Opportunity creation rate |
|---|---|
| Tier-1 (top-priority accounts) | 18% |
| Tier-2 | 7% |
| Tier-3 | 3% |
Real company results: Snowflake and DocuSign
Aggregate benchmarks are useful for planning; named-company case data is useful for defending a budget. Two 2026 case studies, both cited in Modern Leads' ABM ROI analysis, show the win-rate gap holding at enterprise scale.
| Company | Result | Source detail |
|---|---|---|
| Snowflake | 45% win rate on ABM accounts vs. 18% on non-ABM accounts | RollWorks 2026 case study; $50M-plus pipeline sourced; AI creative lifted CTR 54% |
| DocuSign | Enterprise win rate rose from 25% to 52% after ABM rollout | AdRoll 2026 benchmarks; engagement +60%, page views tripled, targeted-account pipeline +22% |
The ABM tactics with the highest ROI
Not every ABM tactic pays off equally. In the 2026 Account Based Marketing Benchmark Survey, marketers ranked personalized content well ahead of every other tactic, with executive events a distant second. Account-based advertising and direct mail still register as strong contributors, just not at the top of the list.
| ABM tactic | Share of marketers rating it highest-ROI |
|---|---|
| Personalized content | 47% |
| Executive events | 27% |
| Account-based advertising | Rated strong, not top-ranked |
| Direct mail campaigns | Rated strong, not top-ranked |
What ABM programs are trying to achieve in 2026
According to Inflexion Group's 2026 ABM Benchmarking Study, most programs now carry multiple objectives at once rather than a single narrow goal. Growing existing accounts remains the dominant priority.
| Program objective | Share of programmes pursuing it |
|---|---|
| Grow existing accounts | 91% |
| Support specific deals (pursuit marketing) | 76% |
| Win new customers | 62% |
Account prioritization criteria are consistent year over year: future growth potential (97%), current revenues (77%) and competitive strength (68%) are the top three filters teams use to build a target list. Strategic ABM remains the backbone approach, used by 88% of companies for their most important accounts, and CMOs partner with sales to sponsor the program in 59% of cases - most ABM programs are not run as a standalone function with its own governance structure. Teams building out that kind of cross-functional growth marketing motion tend to treat ABM as one input into a broader pipeline plan rather than a siloed program.
Platform cost and the contact-level layer
Software cost scales with the platform's scope. Vendr's 2026 SaaS pricing dataset puts the median 6sense contract at USD 58,617 a year across 314 deals and the median Demandbase contract at USD 65,981 a year across 175 deals - both economics that work best above roughly $25,000 in average contract value. Below that threshold, teams tend to assemble a lighter stack: Terminus at USD 2,000-3,000 a month, or RollWorks bundled with HubSpot.
Underneath the platform layer sits a quieter problem: match rate. A raw CSV upload typically matches only about 30% of an account list to ad platforms, because CRM records store business emails while people log into Meta, Google and Reddit with personal ones. Identity enrichment lifts that match rate to 70-99%, and ContactLevel's 2026 data ties the gap directly to results - contact-level ABM reports a 320% ROI versus 180% for account-level ABM run on the same accounts, and 2.2x more meetings booked when contact-level ads warm a prospect before outreach. Anyone running paid distribution against a named-account list should treat match-rate hygiene as a prerequisite, not an optimization.
Cost per opportunity, by program tier
Win rate alone doesn't tell a CFO whether ABM is worth the spend - cost per opportunity does, and it moves in the opposite direction of win rate as programs get more focused. Tomba's 2026 benchmark aggregation puts cost per opportunity at USD 3,800 for 1:1 ABM, USD 2,100 for 1:few and USD 1,200 for 1:many, against an USD 850 baseline for lower-fit inbound leads. That looks expensive per opportunity until it's weighted by win rate and deal size: a 1:1 program's opportunities close at 38% and carry a 70% average contract-value lift, which is why pipeline velocity for 1:1 ABM still runs 2.1x the non-ABM baseline despite the higher up-front cost per opportunity.
| Program tier | Cost per opportunity | Win rate | Pipeline velocity vs. baseline |
|---|---|---|---|
| 1:1 ABM | USD 3,800 | 38% | 2.1x |
| 1:Few ABM | USD 2,100 | 24% | 1.7x |
| 1:Many ABM | USD 1,200 | 14% | 1.3x |
| Inbound MQL (non-ABM) | USD 850 | 9% | baseline |
The takeaway for a budget conversation: a higher cost per opportunity is not automatically a worse economic outcome once win rate and deal size are factored in, which is exactly the argument the 3Rs framework (revenue, relationships, reputation) that Inflexion Group documents is built to make to a skeptical CFO. Teams putting this in front of finance should model the full pipeline-velocity math, not just the cost-per-opportunity line, before deciding a tier is too expensive to run.
Governance data reinforces why that finance conversation needs a shared owner. Most ABM programs are not run through a dedicated department with its own P&L - Inflexion Group's study finds 38% of organizations support ABM with a formal center of excellence, 41% with a cross-functional community and 38% with a steering group, while for a meaningful share of companies ABM has simply become business as usual and no longer needs a separate governance layer at all. That variation matters when comparing win rates across companies: a program with senior sponsorship and a shared dashboard is measuring a different thing than one running informally inside a single marketer's task list, even if both call themselves "ABM" in a benchmark survey.
Frequently Asked Questions
How much better does ABM perform than a non-ABM approach?
Meaningfully better at every tier. Aggregated 2026 benchmarks put the median opportunity win rate at 38% for 1:1 ABM programs, 24% for 1:few, and 14% for 1:many - all of which beat the 9% win rate typical of non-ABM B2B pipeline. Account engagement rates follow the same pattern: 78% for 1:1 programs against 8-12% for non-ABM outreach.
What ROI can a company expect from ABM?
89% of organizations able to report ABM ROI said their ABM accounts outperformed a control group, per Forrester/SiriusDecisions research. Real company results back that up: Snowflake reported a 45% win rate on ABM accounts versus 18% on non-ABM accounts, sourcing more than USD 50 million in pipeline, and DocuSign moved from a 25% to a 52% enterprise win rate after its ABM rollout.
How many accounts should an ABM program target?
Fewer than most teams start with. Win rates peak around 29% when a program focuses on three buying groups at a time and fall to roughly 12% once that expands to six - focus outperforms scale. Separately, tier-1 engagement lift measures 3.4x over non-ABM cohorts, but only while the tier-1 list stays under 100 accounts and refreshes quarterly; it collapses to 1.6x once that list exceeds 200 accounts.
What does ABM software cost?
Enterprise ABM platforms carry enterprise pricing. Vendr's 2026 SaaS pricing data puts the median 6sense contract at USD 58,617 a year across 314 deals and the median Demandbase contract at USD 65,981 across 175 deals. Both fit best when average contract value is USD 25,000-plus; mid-market alternatives like Terminus run roughly USD 2,000-3,000 a month, and RollWorks is sometimes bundled with HubSpot.
Which ABM tactic delivers the highest ROI?
Personalized content, by a clear margin. It's the top-ROI tactic selected by 47% of marketers in a 2026 benchmark survey, well ahead of executive events at 27%. Account-based advertising and direct mail round out the tactics marketers rate as strong ROI drivers, though neither ranks above relevance-driven content and direct, high-touch engagement.
Sources
Tomba, Account-Based Marketing Benchmarks 2026
Debriefing, Demandbase State of ABM 2026
ContactLevel, ABM Statistics 2026
Modern Leads, ABM ROI 2026: 3 Patterns
Digital Applied, ABM Statistics 2026
Inflexion Group, 2026 ABM Benchmarking Study
Demand Gen Report, 2026 ABM Benchmark Survey