



Table of contents
Key Takeaways
- Pool builders spend $2.15–$3.50 per click on Facebook ads, roughly 60–70% less than Google search CPC for the same keywords.
- The average cost per lead from Meta campaigns for pool construction sits at $65–$120, while maintenance-focused campaigns achieve $25–$45 CPL.
- Video-first creative generates 3–4× the engagement of static image ads for pool companies, with drone footage of completed projects producing the highest click-through rates.
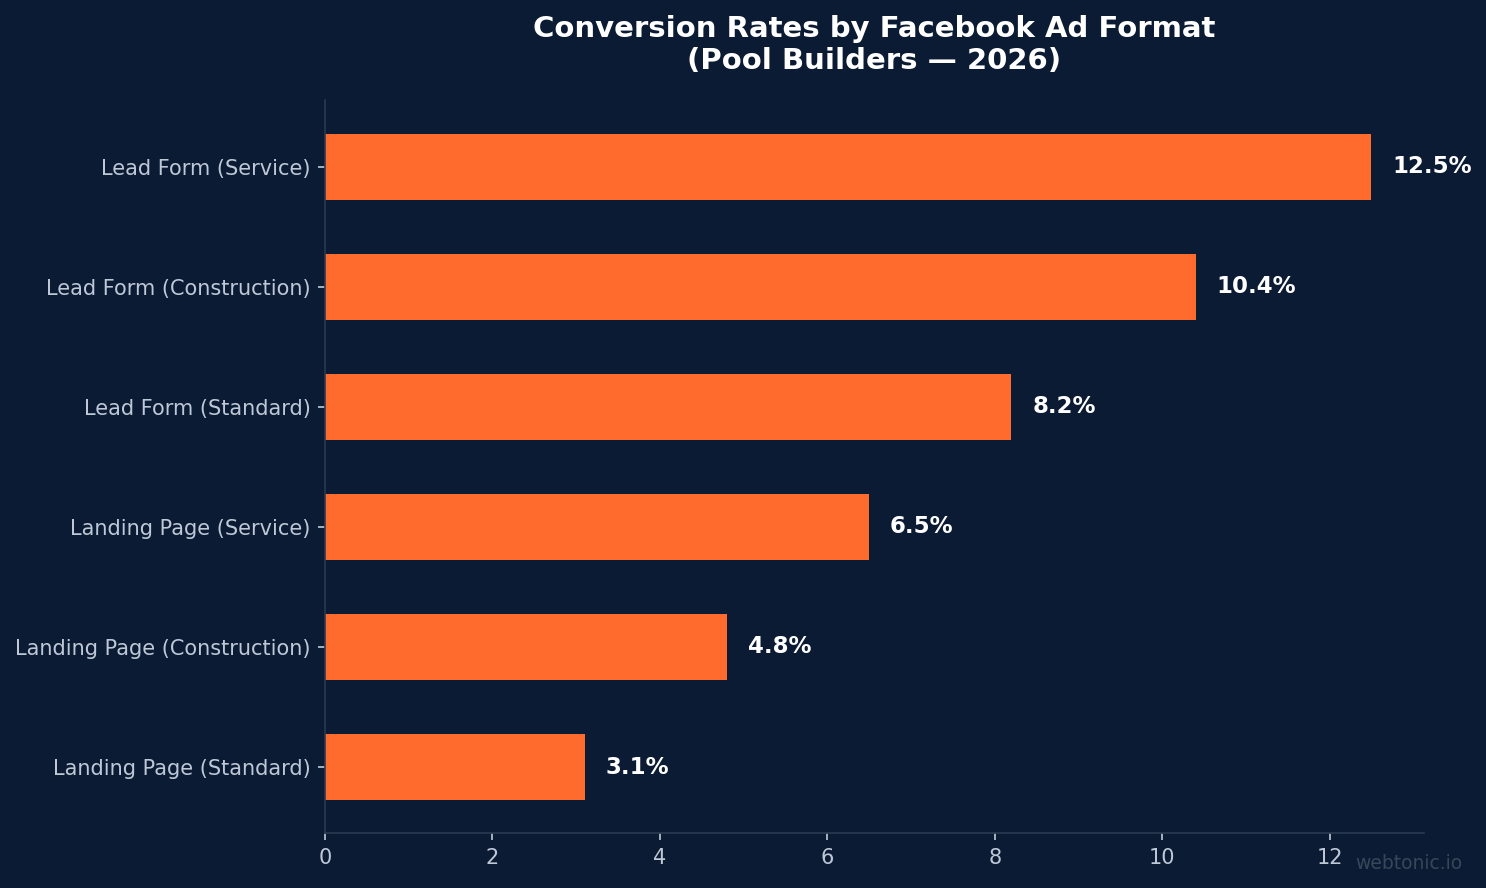
- Facebook lead form ads convert at 8.2–12.5% for pool builders, compared to 3.1–4.8% for traffic campaigns driving to external landing pages.
- Lookalike audiences built from past customers deliver 42% lower CPL than interest-based targeting alone for pool-construction advertisers.
- Retargeting campaigns reduce cost per acquisition by 35–50% when targeting website visitors who viewed pricing or gallery pages within the past 14 days.
Facebook Ads Benchmarks for Pool Builders at a Glance
The following table summarizes 2026 Meta advertising performance data for pool builders, aggregated from agency case studies, platform benchmarks, and contractor surveys. These figures apply to campaigns managed with proper creative strategy and audience targeting.
| Metric | Pool Construction | Pool Service / Maintenance |
|---|---|---|
| Average CPC | $2.15–$3.50 | $1.40–$2.60 |
| Average CPM | $12.80–$22.50 | $9.40–$16.70 |
| Cost per Lead (CPL) | $65–$120 | $25–$45 |
| Lead Form Conversion Rate | 8.2–12.5% | 10.4–15.8% |
| Landing Page Conversion Rate | 3.1–4.8% | 4.2–6.5% |
| Click-Through Rate (CTR) | 1.05–1.62% | 1.28–1.85% |
| Frequency Cap (recommended) | 2.5–3.5 / week | 3.0–4.0 / week |
| ROAS (top performers) | 6–12× | 4–8× |
Facebook Ads Cost Breakdown for Pool Companies
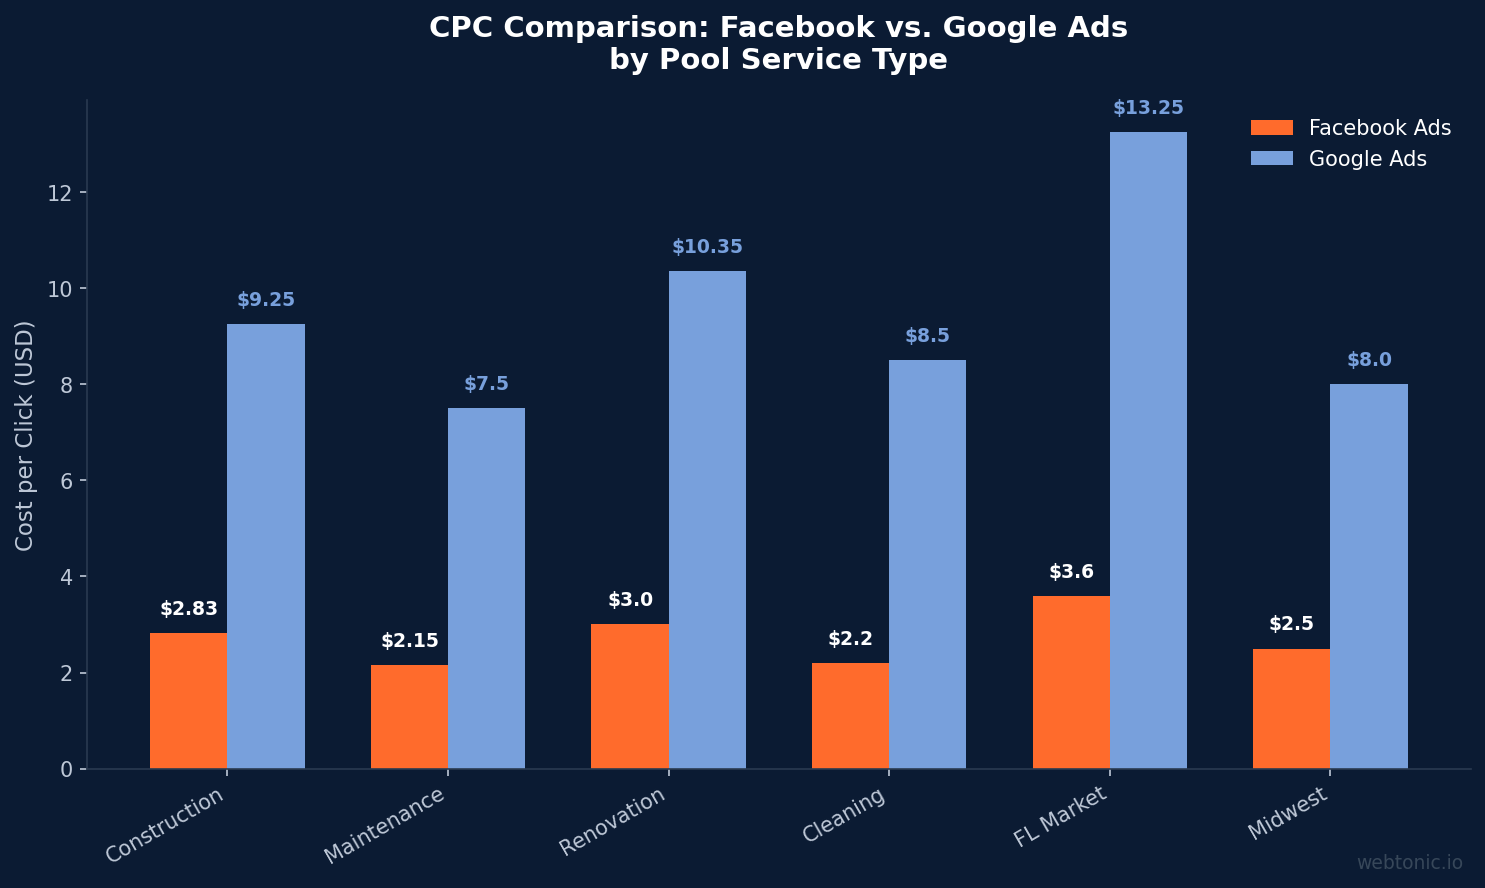
Pool builders allocate $2,000–$8,000 per month to Meta advertising, with construction-focused companies skewing toward the upper range due to higher ticket values and longer sales cycles. At $2.15–$3.50 per click (M.Wolf Media), Facebook offers a 60–70% cost advantage over Google search ads, where pool keywords average $7.50–$11 CPC.
The cost gap narrows on a per-lead basis, however. Facebook's $65–$120 construction CPL reflects a lower intent audience that requires more nurturing than Google search traffic. Contractors who pair Facebook lead generation with automated email follow-up sequences close 22–30% of Meta leads within 90 days, compared to 12–15% for companies relying on manual callbacks alone (Market Disruptors).
Monthly budget allocation best practices suggest dedicating 60–70% to prospecting campaigns and 30–40% to retargeting. Pool companies that maintain this ratio consistently achieve blended CPL 25–35% below industry average, as retargeting recoups value from awareness spend that would otherwise go unmeasured.
Ad Creative Performance: What Works for Pool Builders
Video ads outperform static images by 3–4× in engagement metrics for pool companies (M.Wolf Media). The most effective creative formats follow a clear hierarchy based on format, production quality, and placement alignment:
| Creative Format | Avg. CTR | Avg. CPL | Best Use Case |
|---|---|---|---|
| Drone Footage (completed projects) | 1.85% | $58–$95 | Construction lead gen |
| Before/After Carousel | 1.62% | $72–$110 | Renovation / remodel |
| Customer Testimonial Video | 1.48% | $65–$100 | Trust-building retargeting |
| Static Image + Offer | 0.92% | $95–$140 | Seasonal promotions |
| Time-Lapse Build Video | 1.71% | $62–$98 | Brand awareness + leads |
| Lead Form with Quiz | 1.35% | $55–$88 | Pre-qualification |
Drone footage dominates because pool projects are inherently visual — aerial shots of a finished backyard transformation trigger aspirational engagement that static images cannot match. Companies investing in professional 30–60 second drone reels see a 45% reduction in CPA compared to phone-shot content. The investment in drone videography — typically $300–$800 per shoot — pays back within 2–3 leads for construction campaigns.
Audience Targeting Strategies and Performance
Targeting precision determines whether a pool builder's Facebook budget produces profitable leads or expensive vanity metrics. Lookalike audiences modeled on past customers deliver the strongest results, producing 42% lower CPL than broad interest targeting (BoldPro Digital). Key audience segments ranked by efficiency:
- 1% Lookalike from customer email list — $52–$85 CPL, highest lead quality score among prospecting audiences.
- Website retargeting (14-day pricing and gallery visitors) — $38–$65 CPL, 35–50% lower CPA than cold prospecting.
- Homeowner + income layered interests — $75–$115 CPL, broad reach with moderate qualification filters.
- Home improvement interest stack — $85–$130 CPL, useful for awareness but weaker on conversions.
- Broad targeting with Advantage+ optimization — $70–$110 CPL, Meta's algorithm increasingly effective for service businesses.
Geographic radius targeting within 25–40 miles of the service area remains critical for pool builders, as construction projects require local crews. Combining radius targeting with homeownership filters eliminates 30–45% of unqualified impressions compared to zip-code-only approaches. Pool companies also benefit from seasonal audience rotation — shifting from construction-intent audiences in spring to maintenance and accessory buyers in summer.
Lead Form Ads vs. Landing Page Campaigns
Facebook's native lead forms have become the dominant conversion mechanism for pool builders, with 8.2–12.5% conversion rates compared to 3.1–4.8% for external landing pages. The friction reduction of staying on-platform is significant: 68.5% of pool-related ad clicks come from mobile devices (Reports and Data), where redirect-to-website drop-off is acute.
However, landing page leads convert to paying customers at 2.1× the rate of lead form submissions. The higher intent demonstrated by completing an external form produces leads that are $800–$1,200 more valuable on a per-close basis for pool construction projects. The optimal approach combines both: lead forms for volume and retargeting seed data, landing pages for high-intent remarketing audiences. Companies using integrated growth strategies typically run both in parallel, measuring cost per closed deal rather than raw CPL.
Regional Cost Variations Across the United States
Facebook advertising costs for pool builders vary substantially by geography, reflecting local competition density, seasonality, and median household income. Southern states with year-round pool seasons command premium pricing (Market Disruptors):
| Region / State | Avg. CPC | Avg. CPL (Construction) |
|---|---|---|
| Florida | $2.85–$4.20 | $85–$145 |
| Texas | $2.40–$3.60 | $70–$125 |
| Arizona | $2.60–$3.80 | $75–$130 |
| California | $3.10–$4.50 | $95–$160 |
| Southeast (GA, SC, NC) | $2.15–$3.20 | $60–$110 |
| Midwest (OH, IN, MI) | $1.80–$2.70 | $55–$95 |
| Northeast (NY, NJ, CT) | $2.90–$4.10 | $90–$150 |
Facebook Ads vs. Google Ads for Pool Builders
The two platforms serve complementary roles in a pool builder's acquisition funnel. Google Ads captures high-intent searchers — homeowners actively looking for "pool builder near me" — while Facebook generates demand among homeowners who haven't yet decided to build. Key comparisons:
- CPC: Facebook $2.15–$3.50 vs. Google $7.50–$11 — Facebook is 60–70% cheaper per click.
- CPL: Facebook $65–$120 vs. Google $125–$180 — Facebook delivers more leads per dollar, but at lower average intent.
- Close Rate: Google leads close at 15–22% vs. Facebook 8–14% — higher intent drives stronger conversion downstream.
- Average Deal Value: comparable at $55,000–$85,000 for construction; Google leads skew slightly larger ($68K vs. $62K avg).
- Best Use: Facebook excels at awareness and creative-driven prospecting; Google dominates bottom-funnel capture.
Top-performing pool companies run both channels simultaneously, using Facebook to warm audiences and Google to capture search demand. This dual-channel approach can reduce blended CPA by 18–25% compared to single-channel strategies (ROI.LIVE). For companies evaluating their Facebook advertising ROI, understanding this channel interplay is essential to accurate attribution.
Best Practices for Pool Builder Facebook Campaigns
- Lead with drone or time-lapse footage — video-first creative reduces CPA by 35–45% over static images across all campaign objectives.
- Use lead form ads with 3–5 qualifying questions — adding budget-range and timeline fields improves lead quality by 40% with minimal volume loss.
- Build 1% lookalike audiences from your best customers — model on closed-won deals, not just leads, for maximum signal strength.
- Set frequency caps at 2.5–3.5 impressions per week — ad fatigue sets in faster for high-ticket home services than for consumables.
- Retarget pricing and gallery page visitors within 14 days — these warm audiences convert at 2–3× prospecting rates.
- Test seasonal campaign offers quarterly — spring promotions drive 3× more engagement than generic year-round messaging.
- Integrate with CRM for closed-loop attribution — track Meta leads through to signed contracts to optimize for revenue, not just volume.
Campaign Budget Optimization and Scaling Strategies
Scaling Facebook campaigns for pool builders requires a disciplined approach to budget allocation and campaign structure. The most successful contractors follow a three-tier framework: Testing (15–20% of budget), Winners (50–60%), and Advantage+ Shopping/Lead (20–30%). This structure ensures continuous creative testing while concentrating spend on proven performers.
Campaign Budget Optimization (CBO) outperforms ad-set-level budgets by 12–18% for pool builders running three or more ad sets, as Meta's algorithm can shift spend toward the highest-performing audience and creative combinations dynamically. However, new campaign launches should start with ad-set-level budgets for the first 7–14 days to ensure each audience receives sufficient impressions for evaluation before consolidating into CBO (GetResponse).
Vertical scaling — increasing daily budget by 15–20% every 3–4 days on winning ad sets — preserves algorithmic learning while expanding reach. Pool builders who attempt to double budgets overnight trigger learning phase resets that inflate CPA by 30–50% for 5–7 days, often negating the intended scale benefit. Horizontal scaling, adding new audiences or creative variants at the existing budget level, is safer and typically maintains CPL within 10% of baseline performance.
Attribution and Measurement Challenges
Accurate attribution remains the single biggest challenge for pool builders measuring Facebook advertising ROI. The iOS 14.5+ privacy changes reduced trackable conversion windows, and pool construction sales cycles of 30–120 days extend well beyond Meta's default 7-day click / 1-day view attribution window. As a result, Facebook typically under-reports true ROAS by 20–40% for pool construction campaigns.
Pool companies that implement server-side Conversions API (CAPI) alongside the browser pixel recover 25–35% of lost attribution data. The setup requires developer support or a platform like Zapier or LeadsBridge to connect CRM conversions back to Meta, but the improved signal quality lifts campaign optimization accuracy and reduces wasted spend on underperforming audiences. Companies using both pixel and CAPI report Event Match Quality scores above 7.0, the threshold at which Meta's algorithm performs optimally (WorldMetrics).
For pool builders unable to implement CAPI, the pragmatic solution is measuring blended Marketing Efficiency Ratio (MER) — total revenue divided by total marketing spend — rather than platform-specific ROAS. A healthy MER for pool construction companies is 8–15×, meaning every dollar of total marketing investment should return $8–$15 in revenue across all channels combined.
Seasonal Campaign Adjustments for Pool Companies
Facebook campaign strategy for pool builders must adapt to seasonal demand patterns that vary by region. In northern climates, 72% of construction leads arrive between March and June, requiring aggressive prospecting budgets during this window and reduced maintenance-mode spend in winter. Southern markets see a more gradual curve, with lead flow remaining at 60–70% of peak throughout the year (WorldMetrics).
The most effective seasonal strategy involves pre-season awareness campaigns launching 6–8 weeks before peak demand. Pool builders who begin Facebook prospecting in late January (northern) or early February (southern) build warmed audiences that convert at 28–35% lower CPL during peak season compared to companies that launch cold campaigns when demand spikes. This early-bird approach also locks in lower CPMs before auction competition intensifies in spring.
Frequently Asked Questions
How much should a pool builder spend on Facebook ads?
Most pool builders invest $2,000–$8,000 per month on Meta advertising, with construction-focused companies at the higher end. A useful benchmark is 5–10% of gross revenue allocated to total marketing, with Facebook capturing 25–40% of that digital budget. Start at $2,500/month to generate enough data for optimization within 30 days.
Are Facebook ads effective for pool companies?
Yes — Facebook ads are highly effective for pool builders when paired with strong visual creative and proper audience targeting. The platform's capabilities let contractors reach homeowners by income, property type, and geography. Pool companies using video-first campaigns report 6–12× return on ad spend for construction leads and 4–8× ROAS for service campaigns.
What type of Facebook ad works best for pool builders?
Video ads — especially drone footage and before/after carousels — consistently outperform other formats. Drone footage of completed pool projects achieves 1.85% CTR and $58–$95 CPL, making it the most cost-effective creative type. Lead form ads paired with qualifying questions deliver the best lead volume-to-quality ratio.
How do Facebook ads compare to Google Ads for pool builders?
Facebook and Google serve different stages of the buyer journey. Facebook generates awareness-stage leads at $65–$120 CPL with lower close rates (8–14%), while Google captures high-intent leads at $125–$180 CPL with higher close rates (15–22%). Running both channels together reduces blended CPA by 18–25% compared to single-channel strategies.
How long does it take to see results from Facebook ads for pool building?
Expect 2–4 weeks for initial lead flow and 60–90 days for optimized campaign performance. Meta's algorithm needs 50+ conversion events per ad set per week to exit the learning phase effectively. Pool builders should plan a 90-day testing period before evaluating true ROI, ensuring sufficient budget for the algorithm to learn.
Sources
M.Wolf Media — Pool Marketing Services
Market Disruptors — Pool Lead Economics
ROI.LIVE — Pool Marketing
Reports and Data — Swimming Pool Market
BoldPro Digital — Case Studies
GetResponse — Email Marketing Benchmarks
WorldMetrics — Swimming Pool Statistics
WorldMetrics — Swimming Pool Statistics
Get X Media — Pool Marketing Case Studies


